1692
Resting-state Functional Network Connectivity Pattern as a Cognitive Marker for Task Performance1Department of Electrical and Computer Engineering, Texas Tech University, Lubbock, TX, United States, 2Section on Functional Imaging Methods, National Institute of Mental Health, National Institutes of Health, Bethesda, MD, United States, 3The Mind Research Network, Albuquerque, NM, United States, 4Department of Electrical and Computer Engineering, University of New Mexico, Albuquerque, NM, United States, 5Functional MRI Facility, National Institute of Mental Health, National Institutes of Health, Bethesda, MD, United States
Synopsis
Attentional lapses have been shown to be associated with an altered connectivity and activation pattern of the default-mode network. To further our understanding of the relationship between resting-state connectivity pattern and task performance, we analyzed a multitask dataset including four mental tasks (rest, memory, video, and math). We computed whole-brain connectivity patterns using all volumes during rest (rs-FNC), and the dynamic functional network connectivity (dFNC) patterns during tasks with a sliding window method. We compared similarity between the rs-FNC pattern and dFNCs, which was correlated to the task performance and thus might be used as a cognitive biomarker.
Purpose
To evaluate whether whole-brain resting-state connectivity (rs-FNC) patterns can be used as a cognitive marker to track task performance by comparing the similarity between the rs-FNC pattern and connectivity dynamics during tasks.Methods
Previous studies have shown that the increased activity of the default-mode network might be related to longer response time 1 or decreased accuracy 2. Moreover, in a recent connectivity-based study, the increased connectivity between the default-mode network and the left superior frontal gyrus is found to be related to faster reaction time 3. Based on the previous evidence, we hypothesized that the rs-FNC pattern may be used as a cognitive marker for task performance. The more similar the brain’s functional dynamics during tasks, represented by dFNCs, is to the functional configuration at rest, described by rs-FNC patterns, the worse task performance (longer reaction time and decreased correctness) is to be expected from a subject.
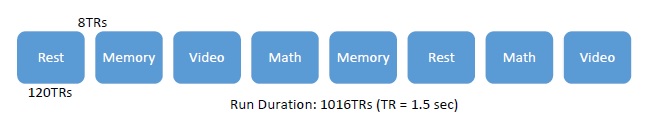
To validate our hypothesis, we analyzed a multitask fMRI dataset in which subjects were continuously scanned for 25 min and 24 s while performing four different mental tasks (rest, simple math, a two-back memory task and visual attention task) as shown in Fig. 1. Functional imaging data of seventeen subjects from the original study by Gonzalez-Castillo et al. 4 were used in this study, which was obtained using a 7 Tesla MRI scanner with TR = 1.5 sec, TE = 25 ms; FA = 50°, 40 interleaved slices; FOV = 192 mm; voxel size = 2 × 2 x 2 mm.
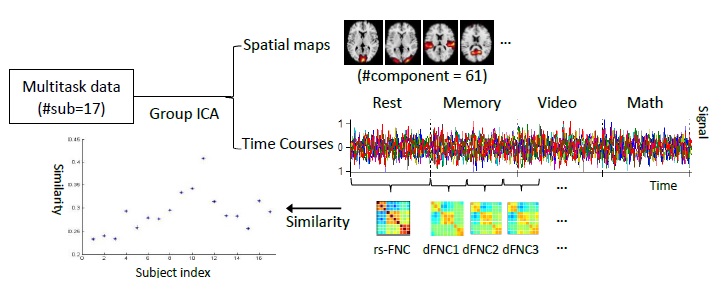
With a combination of toolboxes (SPM5, SPM12 and AFNI) and customized code developed at the Mind Research Network, the preprocessed data underwent the following preprocessing steps: removing first four volumes; slice timing correction; motion correction; despiking; detrending; spatial normalization to Montreal Neurological Institute (MNI) space; spatial smoothing with a Gaussian kernel (FWHM = 4 mm); and intensity normalization to percentage signal change. The preprocessed data were further decomposed using GIFT toolbox to achieve 100 independent components (ICs) and 61 ICs were manually selected for further analysis excluding ICs related to imaging artifacts or noise 5. The time courses of the selected 61 ICs were regressed on the motion parameters and the first derivatives and then filtered with a 6th order Butterworth bandpass filter (0.01 - 0.18Hz). Resting-state functional network connectivity (rs-FNC) pattern was calculated as pairwise Pearson’s correlation between time points during rest. The time points during three tasks were windowed using a non-overlapping Tukey window with a width of 20TRs (30s), and the correlation matrix of which was computed, leading to 120/20 = 6 (see Fig. 1) windowed correlation matrices (dFNCs) for each task block. A total of 36 task-related dFNCs (6 dFNCs per block x 6 task blocks) were computed for each subject with a penalty on the L1 norm of the precision matrix (inverse correlation matrix). Then we compared individuals’ dFNCs with their corresponding rs-FNC patterns using Pearson’s correlation and the similarities were averaged across all windows. The mean similarity was then correlated with their behavior data (average reaction time and percentage of correctness).Results
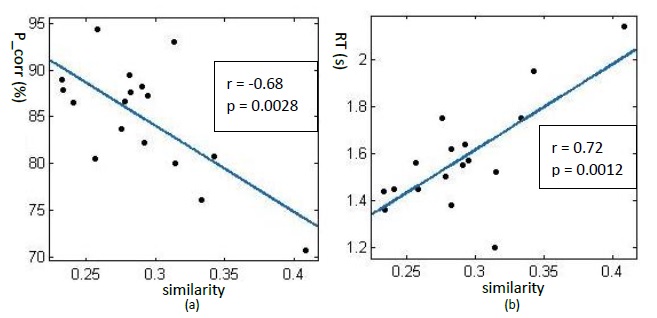
A significant negative correlation (r = -0.68, p = 0.0028) between the similarity with rs-FNC patterns and percentage of correctness as well as a significant positive correlation (r = 0.72, p = 0.0012) between the similarity with rs-FNC patterns and reaction time was observed, as shown in Fig. 3.Conclusions
Our results correlated negative task performance with higher similarity between dFNCs and rs-FNC patterns. In other words, the less engaged an individual is in a task, the more similar the brain’s dynamic functional reconfiguration is to the functional organization observed during rest. Our work indicates that “task-negative" network associated with negative task performance might have a counterpart in terms of the connectivity pattern. We utilized a novel whole-brain connectivity dynamic approach 6, which better captures the transient behavior of the brain on a global level as opposed to just a subset of connections (e.g. static connectivity within default-mode network 3 or between a few chosen regions 7). Our finding highlights the potential of using the complex high-dimensional rs-FNC pattern as a cognitive marker for task performance.Acknowledgements
No acknowledgement found.References
1. Weissman, Daniel H., et al. "The neural bases of momentary lapses in attention." Nature neuroscience 9.7 (2006): 971-978.
2. Eichele, Tom, et al. "Prediction of human errors by maladaptive changes in event-related brain networks." Proceedings of the National Academy of Sciences 105.16 (2008): 6173-6178.
3. Vatansever, D., et al. "Default mode network connectivity during task execution." Neuroimage 122 (2015): 96-104.
4. Gonzalez-Castillo, Javier, et al. "Tracking ongoing cognition in individuals using brief, whole-brain functional connectivity patterns." Proceedings of the National Academy of Sciences 112.28 (2015): 8762-8767.
5. Allen, Elena A., et al. "Tracking whole-brain connectivity dynamics in the resting state." Cerebral cortex (2012): bhs352.
6. Calhoun, Vince D., et al. "The chronnectome: time-varying connectivity networks as the next frontier in fMRI data discovery." Neuron 84.2 (2014): 262-274.
7. Rosenberg, Monica D., et al. "A neuromarker of sustained attention from whole-brain functional connectivity." Nature neuroscience (2015).
Figures