1688
Connectome Based Predictive Modeling: Relating Social Measures to Functional Brain OrganizationEvelyn MR Lake1, Emily S Finn2, Monica D Rosenberg3, Xilin Shen4,5, Dustin Scheinost4,5, Marvin M Chun2,3,6, and R Todd Constable1,2,7
1Radiology and Biomedical Imaging, Yale University, Cambridge, MA, United States, 2Interdepartmental Neuroscience Program, Yale University, 3Department of Psychology, Yale University, 4Department of Diagnostic Radiology, Yale School of Medicine, 5Radiology and Biomedical Imaging, Yale University, 6Department of Neurobiology, Yale University, 7Department of Neurosurgery, Yale School of Medicine
Synopsis
We examine the relationship between functional brain networks and behaviour in individuals with autism from the Autism-Brain-Imaging-Data-Exchange. We find a difference in attention network strength between groups (autism vs. control) using an a priori defined network for high-attention [1]. In addition, connectome based predictive modeling (CPM) successfully predicted inattention and communication scores. Finally, on a test group of autistic patients (not used in the CPM), we found network strengths to be more similar to individuals used the CPM with autism than controls. Together, these results indicate that connectivity may prove to be a valuable tool in the diagnosis and treatment of autistic individuals.
Introduction
The Autism-Brain-Imaging-Data-Exchange (ABIDEI/II) aims to support the discovery of unique brain connectivity in individuals with autism spectrum disorder (ASD). Individuals with ASD (and/or attention deficit hyperactivity disorder ADHD) perform poorly on assessments of attention and communication. The present work investigates how measures of functional network strength correspond to abnormal behaviours in ASD individuals. Establishing neurological markers with resting-state functional magnetic resonance imaging (rs-fMRI) may help estimate symptom severity and plan treatment. Indeed such passively acquired markers may prove valuable when evaluating individuals that are challenged to perform tasks or participate in behavioural assessments such as very young individuals and/or individuals with autism.Methods
Results from school-age individuals 8±2 yrs. from ABIDE-II (New York University, NYU-1&2, N=69) are reported. Data was included from two cohorts: (1) NYU-1 individuals without autism (controls, N=25) and individuals diagnosed with autism (Gr.1, N=27), and (2) NYU-2 individuals diagnosed with autism (Gr.2, N=17). Pre-processing included motion correction and warping of images to a common space as described previously [2]. All individuals included (N=69) had low head motion (frame-to-frame <0.1mm). Images were smoothed (6mm) and global signal regression applied. Calculation of node based connectivity matrices was conducted within BioImage Suite [3]. The final 268x268 symmetric connectivity matrices for each individual resulted from Pearson correlation coefficients generated from the time-courses of node pairs normalized to z-scores using the Fisher transformation [4]. Predicted behaviour from connectome-based predictive modeling (CPM), which employed leave-one-subject-out cross-validation [4] analysis, were compared to known performance. Network strengths, known and predicted behaviour were compared between groups using linear mixed effects modeling (R-Software).Results
In the present work, connectivity strengths in an a priori network previously shown to predict high-attentional function across individuals both with and without ADHD [1], were compared between individuals with and without autism. As hypothesized, high-attention network strengths were lower in individuals with autism (Fig.1). Behaviour scores for inattention (Conners Parental Rating Scale CPRS), and communication (social responsiveness scale SRS), were greater (indicating more severe symptoms/impairment) in individuals with autism (Gr.1 and Gr.2) than controls (Fig.2). CPM was conducted on NYU-1 (N=52) individuals to identify inattention and communication networks given known behaviour scores. Edges identified in all iterations of the CPM analysis were used to calculate the positive and negative network scores plotted for NYU-1 (control and Gr.1) and NYU-2 (Gr.2) in Fig.3. Note: NYU-2 individuals represent an independent data set, as they were not included in the CPM analysis. Inattention and communication network strengths from NYU-2 individuals (all part of the autism group) were more like NYU-1 autism individuals (Gr.1) than controls. Furthermore, CPM [4] successfully predicted individual inattention and communication scores (Fig.4). Notably, as motion is a known confound, frame-to-frame motion did not differ between groups, nor correlate with behaviour.Conclusion
Using an a priori defined network and a data driven analysis reveals a strong link between brain connectivity in individuals with autism and behavioural characterization. These results indicate that the connectome of individuals with autism contains valuable information on the functional organization of the brain which is different from unaffected individuals. Furthermore, CPM in this patient group can be used to predict behaviour. Together these findings indicate that rs-fMRI may prove to be a valuable tool in the diagnosis and treatment of ASD individuals.Acknowledgements
No acknowledgement found.References
[1] Rosenberg MD, Finn ES, Scheinost D, et al. A neuromarker of sustained attention from whole-brain functional connectivity. Nature Neurosci. 2015;19(1):165-171. [2] Shen X, Tokoglu F, Papademetris X, et al. Groupwise whole-brain parcellation from resting-state fMRI data for network node identification. Neuroimage. 2013;82:403-415. [3] Joshi A, Scheinost D, Okuda H, et al. Unified framework for development, deployment and robust testing of neuroimaging algorithms. Neuroinformatics. 2011;9(1):69-84. [4] Finn ES, Shen X, Scheinost D, et al. Functional connectome fingerprinting: identifying individuals using patterns of brain connectivity. Nature Neurosci. 2015;18(11):1664-1671.Figures
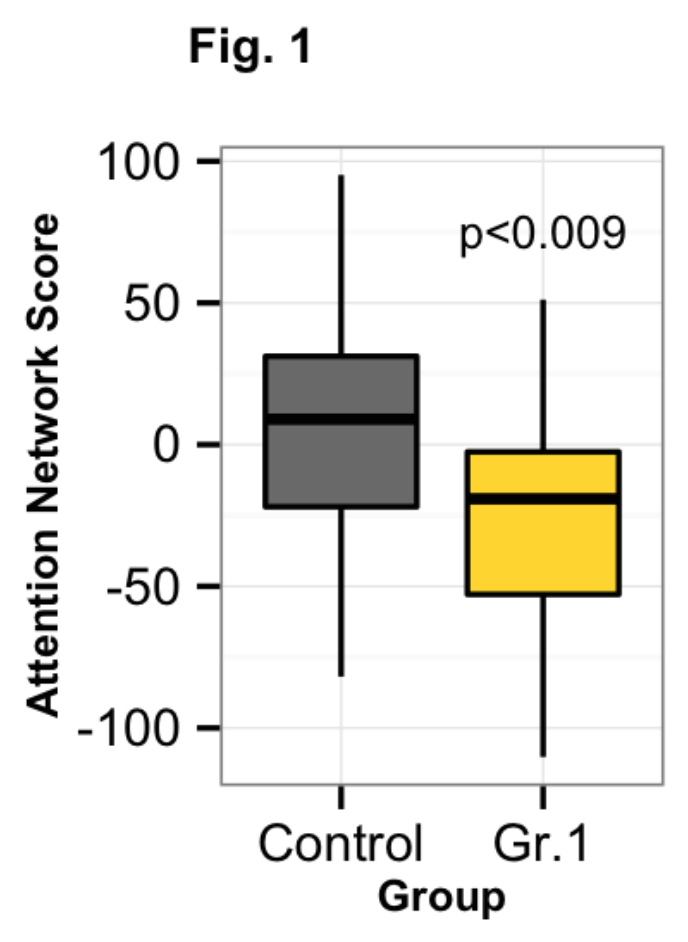
Attention network strengths for individuals from NYU-1 (N=52). Individuals without autism (controls) are plotted in grey, and individuals with autism in yellow (Gr.1). Attention network strengths were lower in individuals diagnosed with autism.
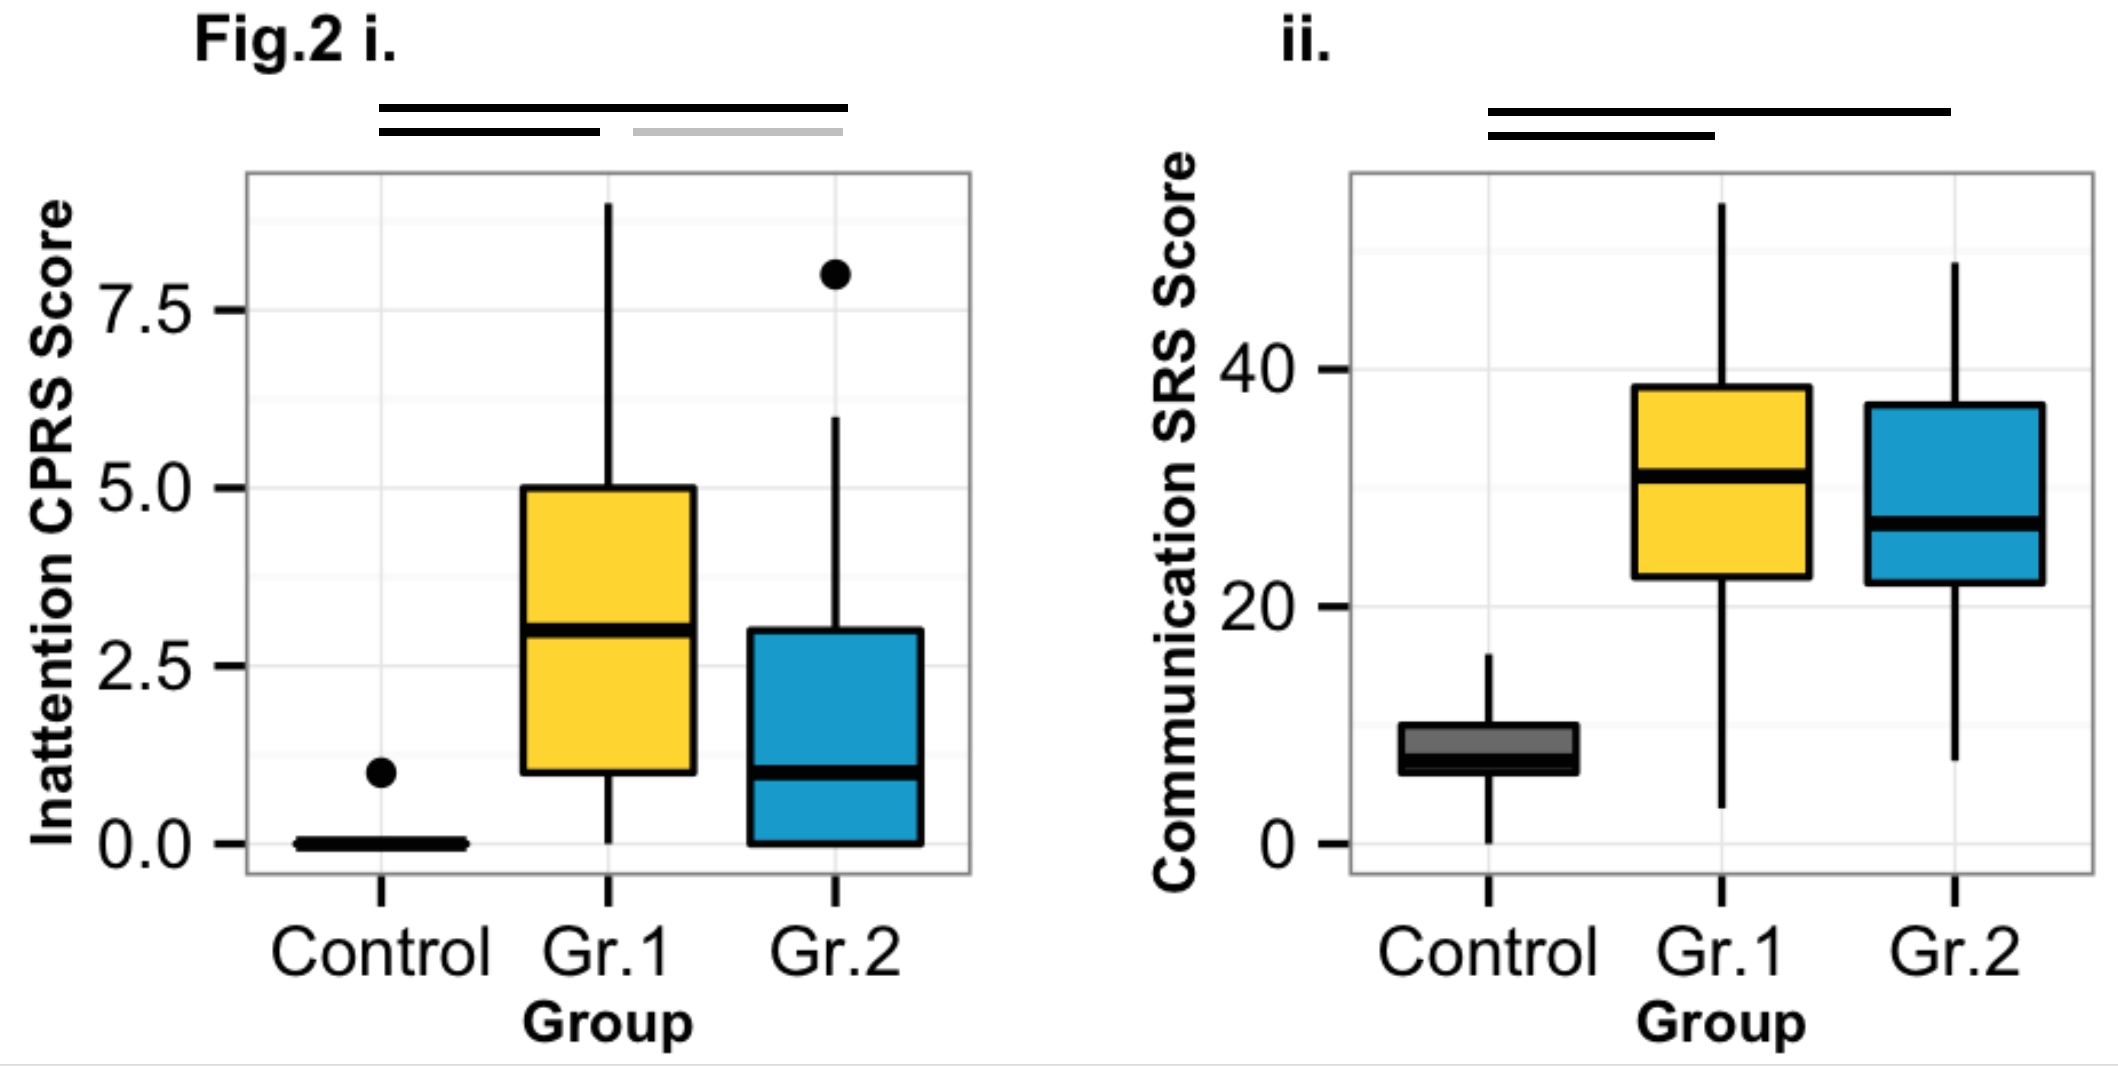
CPRS (i.) and SRS (ii.) behaviour scores for individuals from NYU-1 (N=52, controls in grey, and individuals with autism in yellow Gr.1) and NYU-2 (N=17, individuals with autism in blue Gr.2). Black lines p<0.00001, grey line p<0.01.
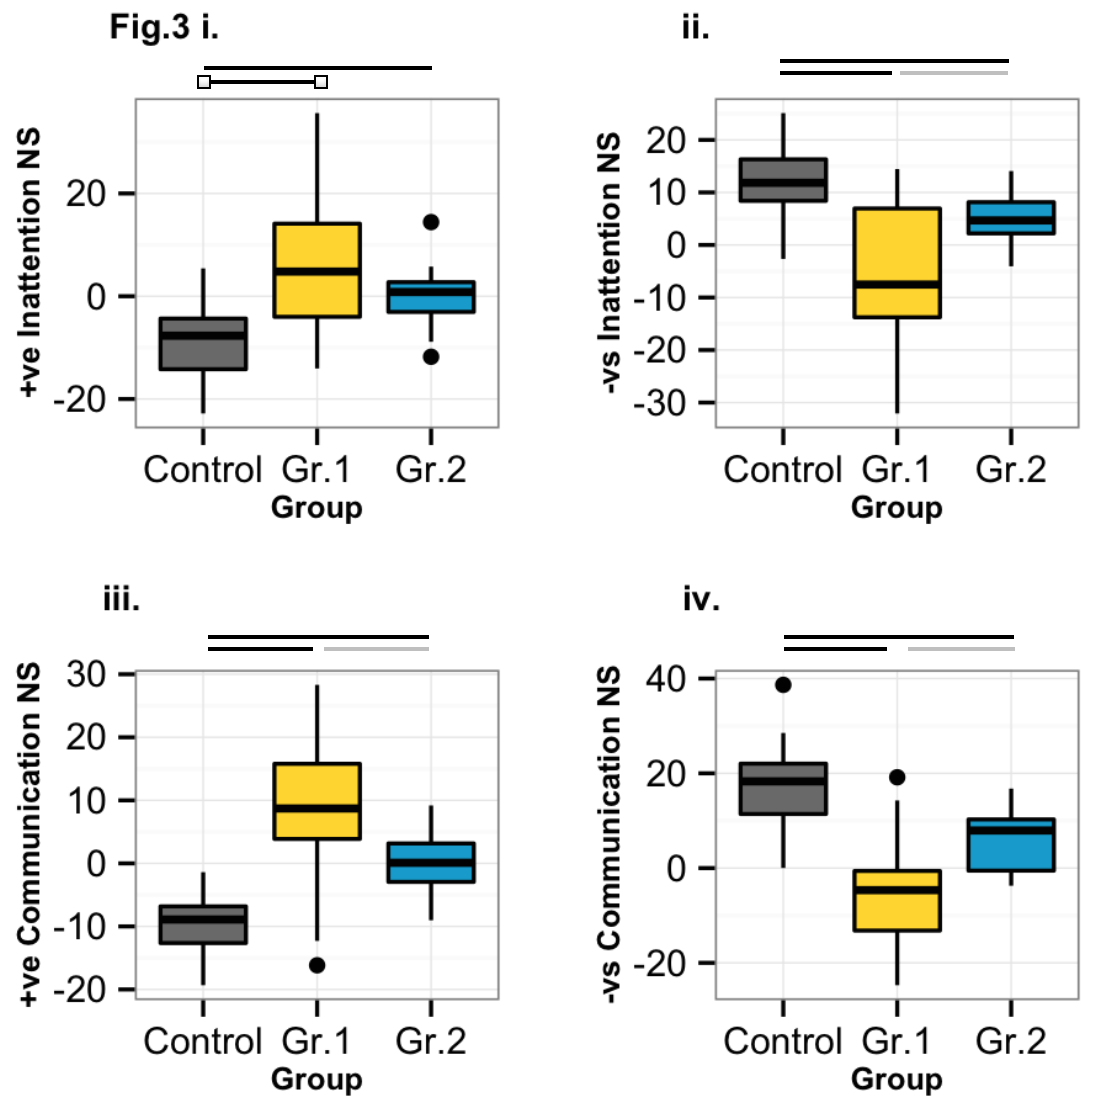
Positive (i. and iii.) and negative (ii. and iv.) network strengths for inattention (ii. and ii.) and communication (iii. and iv.) defined using NYU-1 data (N=52) with LOSO analysis. NYU-1 control individuals plotted in grey, and autism (Gr.1) individuals plotted in yellow. NYU-2 individuals in blue. NYU-1 data was used as the training set, while NYU-2 individuals served as the test set. NYU-2 (Gr.2) network strengths were more similar to NYU-1 (Gr.1) scores than controls. Black lines p<0.00001, grey lines p<0.01.
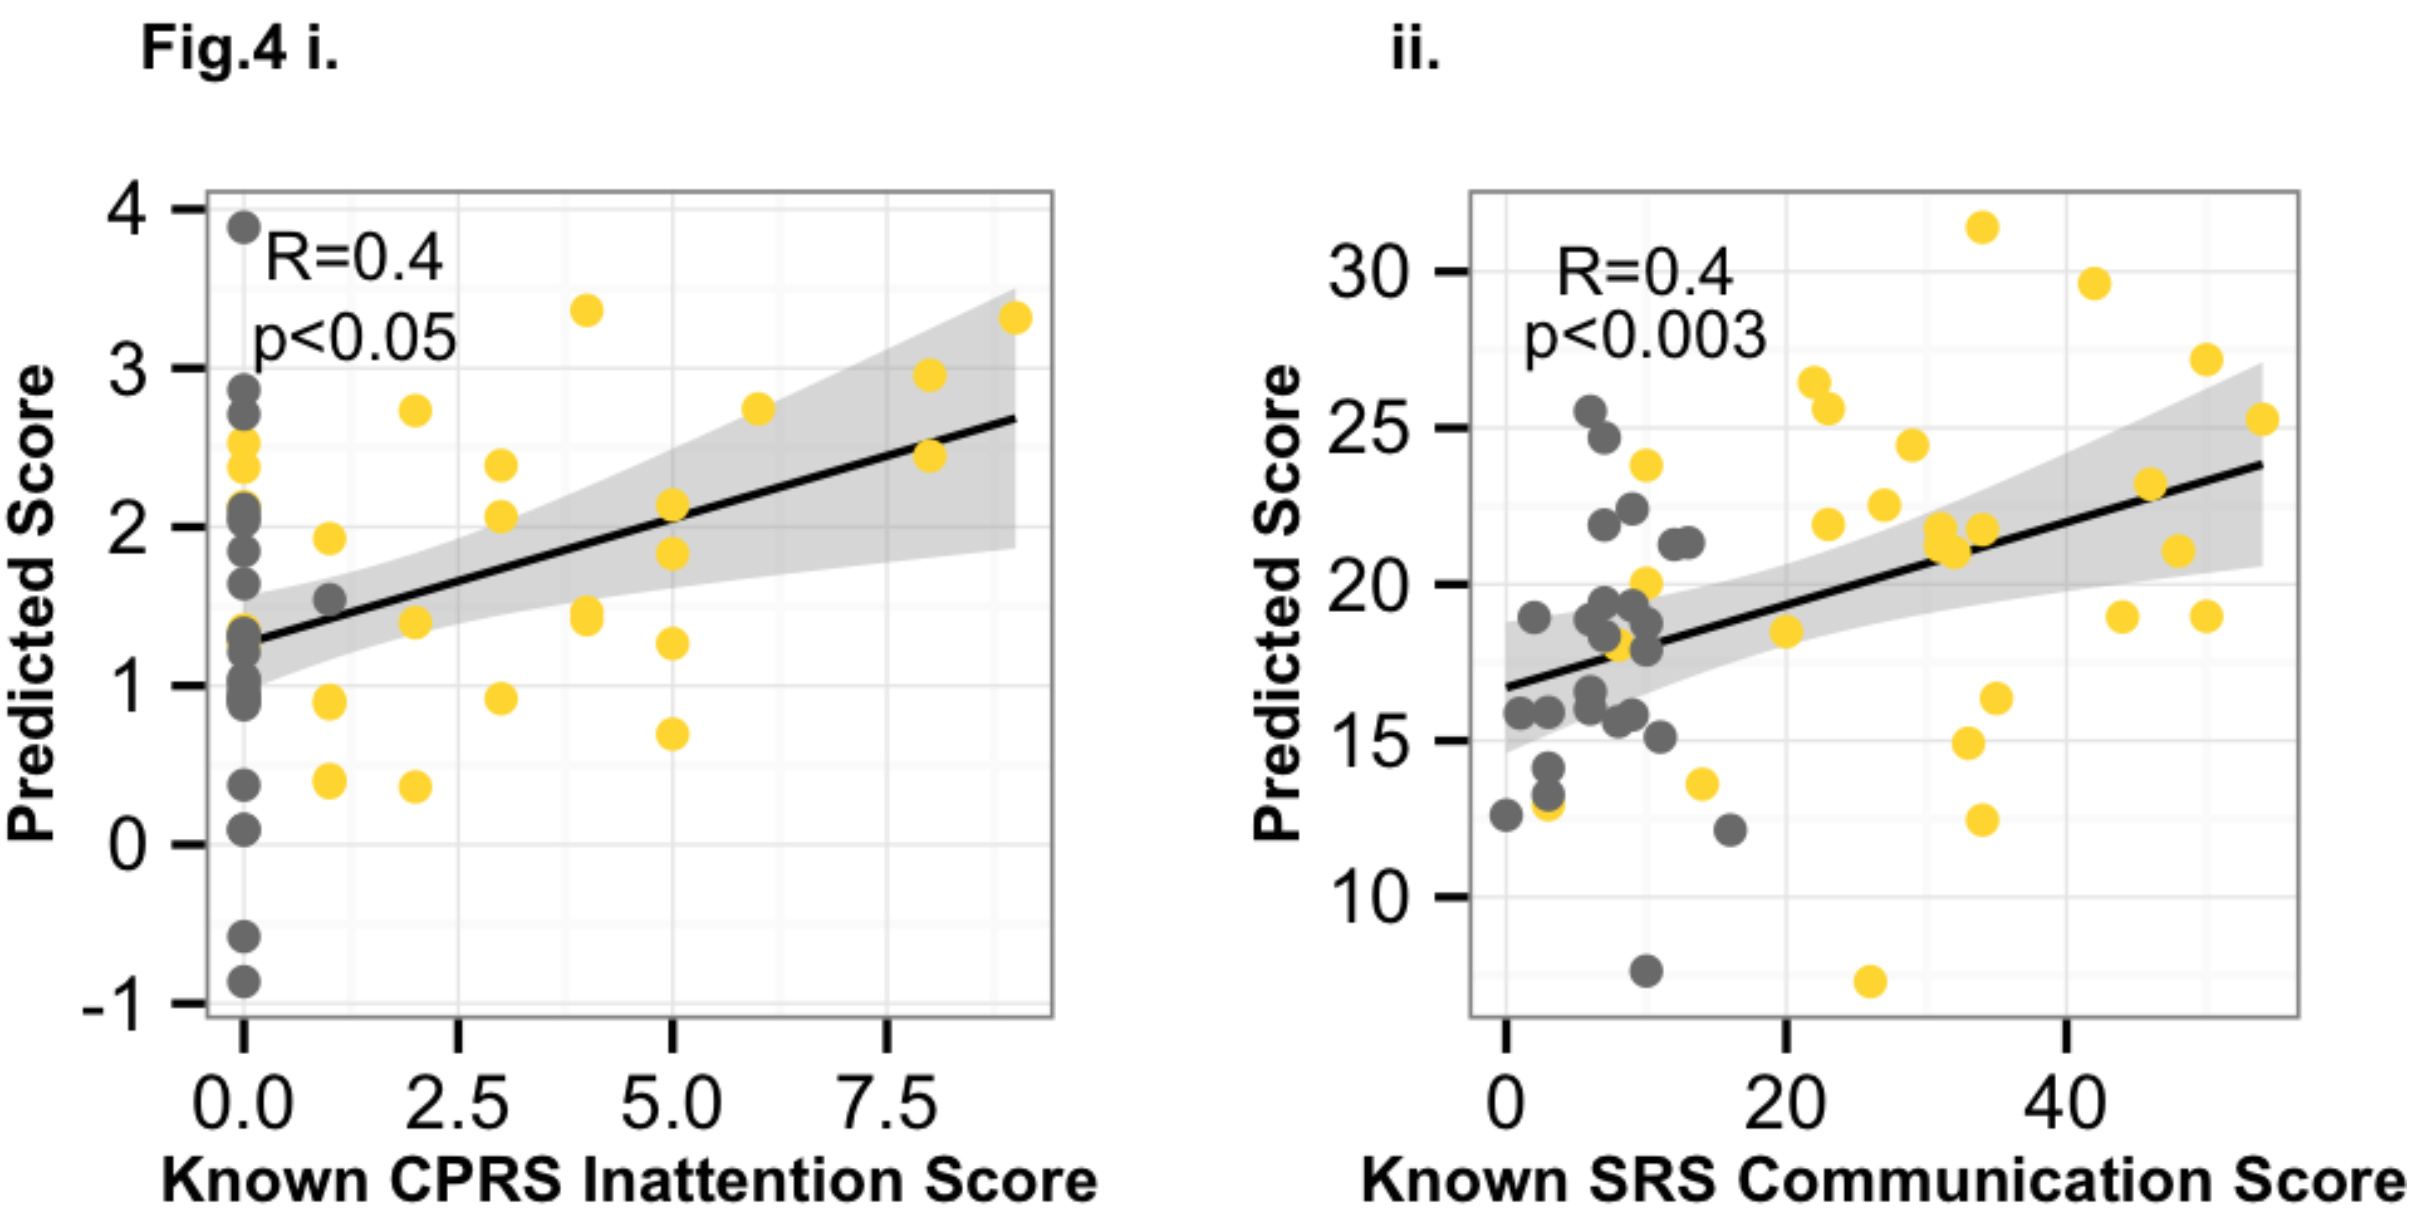
Predicted behaviour from the LOSO analysis are plotted against known inattention (i.) and communication (ii.) scores for NYU-1 data (N=52). Controls plotted in grey, and Gr.1 autism in yellow. There was a significant (p<0.05) relationship between known and predicted behaviour.