1687
Pediatric Brain Functional Parcellation from Birth to 2-Years-Old1Department of Biomedical Engineering and Biomedical Research Imaging Center, University of North Carolina at Chapel Hill, Chapel Hill, NC, United States, 2Department of Radiology and Biomedical Research Imaging Center, University of North Carolina at Chapel Hill, Chapel Hill, NC, United States
Synopsis
Brain functional parcellation has been shown to discern brain functional atlases in adults. In this study, multigraph K-way clustering1 was employed to reveal temporal evaluation of brain funcitonal atlases in 71 healthy children longitudinally scanned at 1/3/6/9/12/18/24 months of age. Results revealed temporal evolution of brain functional networks during the first two years of life.
Purpose
The first two years of life represent one of the critical time periods of early brain development both structurally2-10 and functionally11-14,16. Rapid maturation of major brain funcitonal networks have been reported, including basic as well as higher order brain functional networks such as the default mode network14. ROIs using the AAL15, 16 atlas have been widely employed to discern brain functional maturation. However, results obtained from this approach could be biased by the variable size of ROIs and incorrect functional representations. Impacts of the latter bias on our ability to characterize brain functional networks could be even greater in early infancy owing to the lack of clearly delineations of brain functional regions in children. To this end, we seeked to build functional atlases at 1, 3, 6, 9, 12, 18 and 24 months of age.Methods
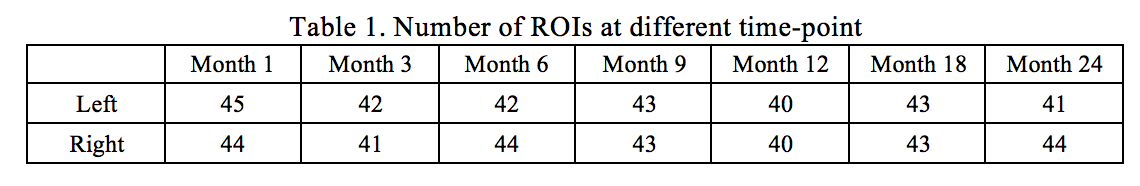
A total of 71 healthy children, 0 – 2 years of age, were longitudinally imaged at 1, 3, 6, 9, 12, 18 and 24 months of age. Resting functional MR images were acquried and preprocessed with FSL software17-19, including discarding the first 10 volumes, slice-timing correction, motion correction, spatial smoothing (6mm FWHM), bandpass filtering (0.01 Hz ~ 0.08 Hz), global mean/white matter/CSF signal regression, as well as FD-DVARS20 “scrubbing” process. Each indivual scan was registered to a standard template with the group-wise regritration method21, 22. These images were resampled to 4mm resolution for further processing. After co-registering fMRI data of all subjects to a standard template, multigraph K-way clustering1 method was performed for functional parcellation at each age. The parcellation was performed at each hemisphere individually and the number of regions (K) was set to 50. After the initial parcellation, ROIs less than 20 voxels were merged to one of their neighbour ROIs exhibiting the highest similarity.Result
The number of ROIs at each age is provided in Figure 1, whereas brain functional atlas at each time point is shown in Figure 2.
Discussion
Age specific functional atlases were obtained, exhibiting temporal variation of brain functional regions during the first two years of life. In our study, the number of ROIs at each hemisphere was set at 50 owing to the following two reasons. First, multigraph K-way method using larger numbers of ROIs were conducted at the individual subject level. Compared with large numbers of ROIs, K=50 provided a higher reproducibility across subjects. Second, considering the small pediatric brain size, a large number of ROIs could lead to ROIs with few voxels, which could suffer from a low SNR. Considering these two factors, K=50 was thus chosen in our study. Nevertheless, it should be noted that the optimal number of ROIs remains elusive. Future studies with comprehensive behavioral assessments may enable association analyses to determine the validity of functional parcellations and the choice of K.
We merged ROIs less than 20 voxels to one of their neighbours with the highest similarity. In standard space, we have around 10000 voxels at each hemisphere, giving the average ROI size as 200 voxels. Less than 10% of the average ROI size could suggest substantial noise influence when performing analysis.
As shown in Figure 2, we found stable parcellation in the precentral gyrus, postcentral gyrus, and occipital area in both the left and right hemispheres, which could suggest early maturation of basic brain functions. On the other hand, we also found active re-union at the temporal and frontal area, suggesting continuing evaluation of brain maturation processs of higher order brain functions during the first two years of life.
Conclusion
In this study, we presented the whole-brain functional parcellation based on resting-state fMRI data using the Multigraph K-way clustering approach. To the best of our knowledge, our study represent the first functional atlases for 0, 3, 6, 9, 12, 18 and 24 months of age. Results could pontentially pave the way for further delineation of brain functional development analysis.Acknowledgements
No acknowledgement found.References
1. Shen, X., et al., Groupwise whole-brain parcellation from resting-state fMRI data for network node identification. NeuroImage, 2013. 82: p. 403-415.
2. Knickmeyer, R.C., et al., A Structural MRI Study of Human Brain Development from Birth to 2 Years. Journal of Neuroscience, 2008. 28(47): p. 12176-12182.
3. Li, G., et al., Spatial Patterns, Longitudinal Development, and Hemispheric Asymmetries of Cortical Thickness in Infants from Birth to 2 Years of Age. J Neurosci, 2015. 35(24): p. 9150-62.
4. Li, G., et al., Measuring the dynamic longitudinal cortex development in infants by reconstruction of temporally consistent cortical surfaces. Neuroimage, 2014. 90: p. 266-79.
5. Li, G., et al., Mapping region-specific longitudinal cortical surface expansion from birth to 2 years of age. Cereb Cortex, 2013. 23(11): p. 2724-33.
6. Li, G., et al., Mapping longitudinal hemispheric structural asymmetries of the human cerebral cortex from birth to 2 years of age. Cereb Cortex, 2014. 24(5): p. 1289-300.
7. Li, G., et al., Construction of 4D high-definition cortical surface atlases of infants: Methods and applications. Med Image Anal, 2015. 25(1): p. 22-36.
8. Li, G., et al., Simultaneous and consistent labeling of longitudinal dynamic developing cortical surfaces in infants. Med Image Anal, 2014. 18(8): p. 1274-89.
9. Li, G., et al., Cortical thickness and surface area in neonates at high risk for schizophrenia. Brain Struct Funct, 2016. 221(1): p. 447-61.
10. Li, G., et al., Mapping longitudinal development of local cortical gyrification in infants from birth to 2 years of age. J Neurosci, 2014. 34(12): p. 4228-38.
11. Emerson, R.W., W. Gao, and W. Lin, Longitudinal Study of the Emerging Functional Connectivity Asymmetry of Primary Language Regions during Infancy. J Neurosci, 2016. 36(42): p. 10883-10892.
12. Gao, W., et al., Development of human brain cortical network architecture during infancy. Brain Struct Funct, 2015. 220(2): p. 1173-86.
13. Gao, W., et al., Intersubject variability of and genetic effects on the brain's functional connectivity during infancy. J Neurosci, 2014. 34(34): p. 11288-96.
14. Gao, W., et al., Evidence on the emergence of the brain's default network from 2-week-old to 2-year-old healthy pediatric subjects (vol 106, pg 6790, 2009). Proceedings of the National Academy of Sciences of the United States of America, 2009. 106(24): p. 9931-9931.
15. Tzourio-Mazoyer, N., et al., Automated anatomical labeling of activations in SPM using a macroscopic anatomical parcellation of the MNI MRI single-subject brain. Neuroimage, 2002. 15(1): p. 273-289.
16. Gao, W., et al., Temporal and Spatial Evolution of Brain Network Topology during the First Two Years of Life. PLoS ONE, 2011. 6(9): p. e25278.
17. Jenkinson, M., et al., Fsl. Neuroimage, 2012. 62(2): p. 782-790.
18. Smith, S.M., et al., Advances in functional and structural MR image analysis and implementation as FSL. Neuroimage, 2004. 23: p. S208-S219.
19. Woolrich, M.W., et al., Bayesian analysis of neuroimaging data in FSL. Neuroimage, 2009. 45(1): p. S173-S186.
20. Power, J.D., et al., Methods to detect, characterize, and remove motion artifact in resting state fMRI. Neuroimage, 2014. 84: p. 320-41.
21. Wu, G.R., et al., SharpMean: Groupwise registration guided by sharp mean image and tree-based registration. Neuroimage, 2011. 56(4): p. 1968-1981.
22. Wu, G.R., et al., Groupwise Registration with Sharp Mean. Medical Image Computing and Computer-Assisted Intervention - Miccai 2010, Pt Ii,, 2010. 6362: p. 570-577.
Figures