1684
The impact of geometric distortion correction on multisite rs-fMRI data1GE Global Research, Munich, Germany, 2Department of Medical Engineering, Technische Universität München, Munich, Germany, 3Department of Psychiatry and Psychotherapy, Ludwig-Maximilians-Universität, Munich, Germany, 4Department of Informatics, Technische Universität München, Munich, Germany
Synopsis
This study addresses the goal of reducing
site-variance in the correlation values of multisite rs-fMRI data by correcting
for site-specific EPI-related geometric distortions. Three geometric distortion
correction methods (B0 fieldmap and image-based unwarping) were applied separately
to a calibration dataset consisting of six subjects traveling to three sites.
The change of the correlation values and their site-homogeneity was evaluated
in dependency of the quantified geometric distortion correction values for six
networks and all subjects. It could be shown that the distortion correction had
no significant impact on the correlation values and no correlation between the
two parameters was found.
Keywords
Multi-site fMRI; Multi-center; Functional connectivity; Distortion correction; EPIIntroduction
One main goal of multisite neuroimaging studies is the usage of harmonized resting-state functional connectivity data as a potential biomarker. Multisite data not only facilitates recruitment, but also offers the possibility to overcome site variance and therefore produce more generalizable results1,2. One component of site variance are the site-specific EPI-related rs-fMRI geometric distortions. This study focuses on the impact of the correction of these distortions on the correlation values and their homogeneity on a multisite level.Data
Six volunteers (age: 29 +/- 6 years; sex: 2 females, 4 males) were scanned at three sites with clinical 3T scanners in March 2015 within two weeks. The MR system specifications and harmonized protocol parameters for the acquisition of the EPI-based rs-fMRI, sMRI and B0 field map are summarized in Table 1. This setup allows the study of site variance effects without any population bias.Methods
Image preprocessing
Basic fMRI preprocessing was applied to the data including skull-stripping and correction for head motion. Three geometric distortion correction methods were applied to the realigned fMRI series and processed separately (inspired by 3, Figure 1):
a) FMU (Field Map based Unwarping)4: Voxel shift maps along the phase encoding direction are calculated using the unwrapped phase field map. The intensity values of the voxels of the rs-fMRI images are then corrected by the Jacobian of the unwarping model.
b) DR (Deformable Registration): The rs-fMRI images are registered via DRAMMS to the magnitude image of the B0 field map (same contrast / resolution)5.
c) FMG-DR (Field Map Guided - Deformable Registration): The rs-fMRI images are registered to the magnitude image of the B0 field map including information about dropout regions.
ROIs and networks definition
116 weighted ROIs in the fMRI space were obtained by an AAL parcellation of the 2mm MNI 152 atlas and non-linear registration to the higher resolution, segmented (GM, WM, CSF) sMRI and six parameter linear transformation to the lower resolution fMRI space6. Using the major representative resting functional networks described by Smith7, these ROIs were divided into six networks: occipital, default mode, cerebellum, sensorimotor, auditory and fronto-parietal.
Geometric distortion maps
The undistorted magnitude image of the B0 field map was registered via a six parameter linear transformation to the fMRI image (original and corrected), averaged over the time series. Both were segmented subsequently into tissue (GM and WM combined), CSF and air. Differences in the respective tissue probability values were added up to obtain geometric distortion maps (Figure 1). Mean geometric distortion values were calculated for the 116 weighted ROIs.
Connectivity matrices
The fMRI signals were band-pass filtered (0,01 - 0,08 Hz) and the mean signal for each ROI (original and corrected) was calculated. Six rigid body motion parameters, WM, CSF and global signals were regressed out. Pearson correlation values were calculated for each ROI-pair and Fisher z-transformed to obtain normally distributed z-values.
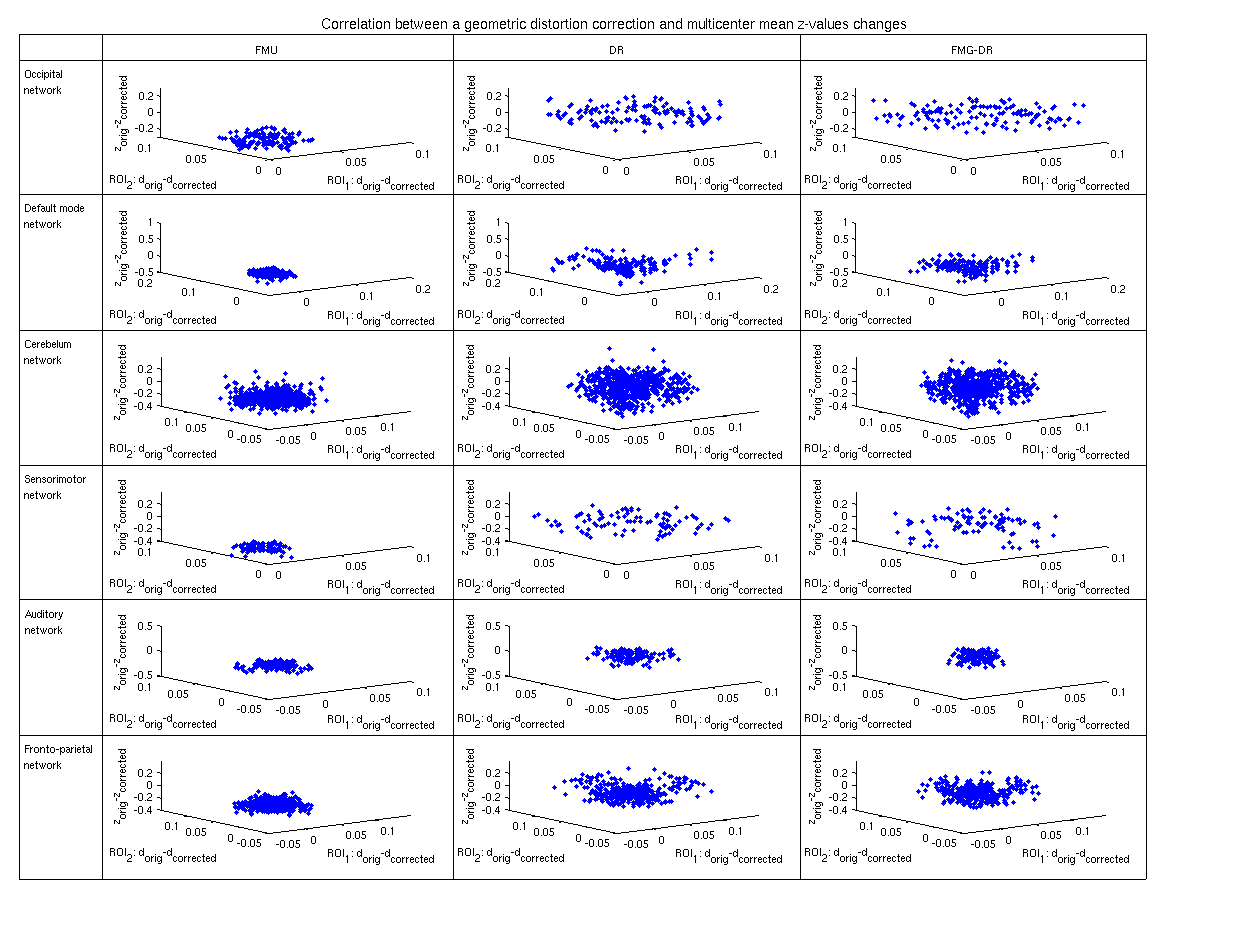
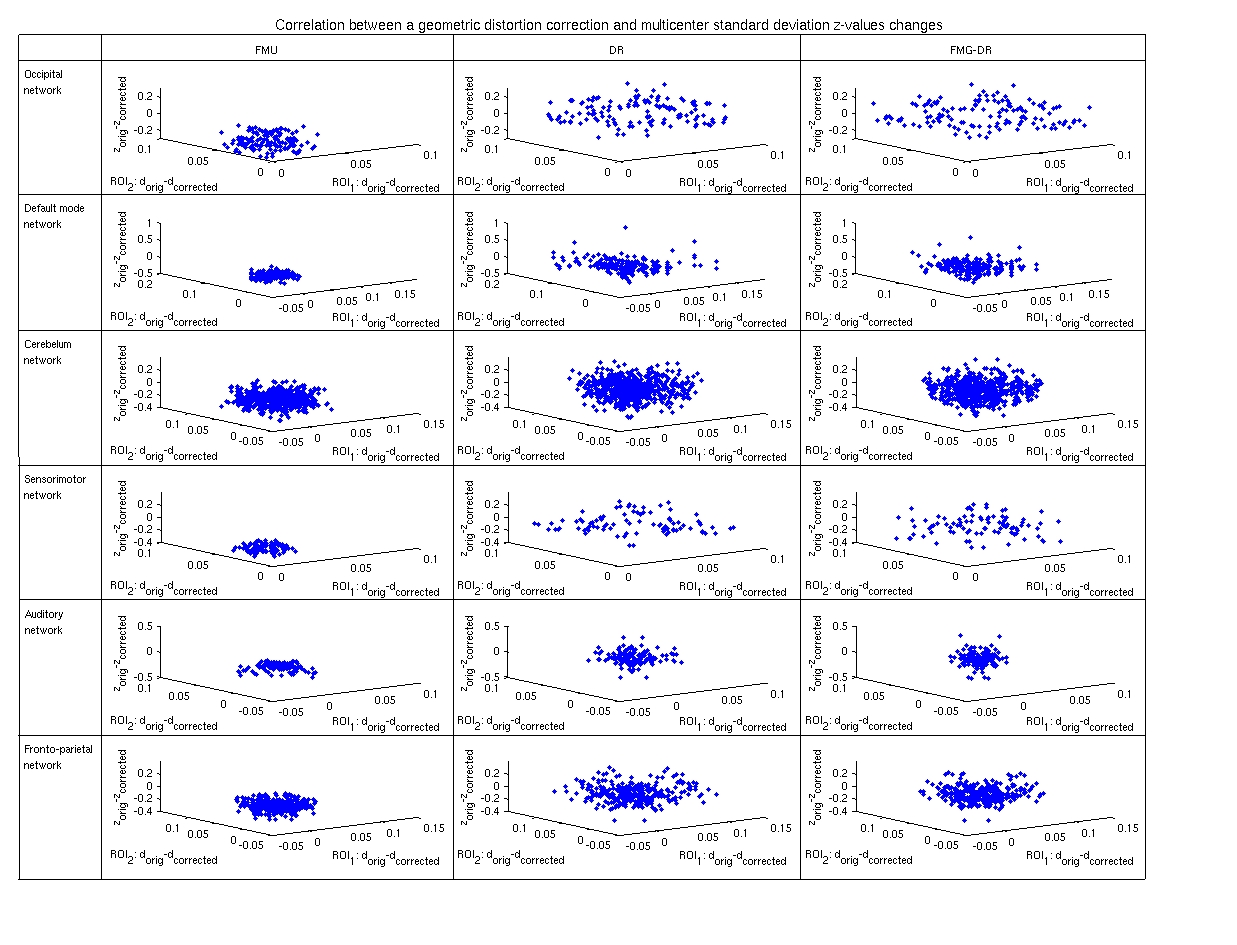
Geometric distortion correction and correlation values on a multisite level
The geometric distortion values of each ROI were averaged over the three sites. The mean values after distortion correction were subtracted from the original values, with positive values representing an improvement of geometric distortion within the respective ROI. Similarly, the mean and standard deviation values of the correlation values over the sites were calculated and the corrected values subtracted from the original ones. A negative change of the mean values within each of the defined networks indicates a correction7, a positive difference of the standard deviation values an improvement of site-homogeneity.
Results / Discussion
For each subject and correction method, the differences in the mean / standard deviation z-values were plotted against the geometric distortion values of the respective two ROIs, shown exemplary for one subject in the Figures 2 / 3. DR and FMG-DR show similar distributions, higher geometric distortion correction and a tendency to higher mean / standard deviation z-value changes than FMU. However, in absolute terms the mean / standard deviation z-value differences are considered small / not significant. No correlation between the geometric distortion correction values and mean / standard deviation z-value changes could be found in any network of the six subjects.Conclusion
It was shown that for a correlation-based fMRI analysis the applied geometric distortion correction methods don’t show the potential to improve the correlation values nor their homogeneity on a multisite level. The latter could indicate that the site-specific distortions contribute little to the overall site-variance.Acknowledgements
The research leading to these results is funded by the European Union's Seventh Framework Programme (FP7/2007-2013) under grant agreement n° 602152 (PRONIA).References
1. Gradin V, Gountouna VE, Waiter G, Ahearn TS, Brennan D, Condon B, Marshall I, McGonigle DJ, Murray AD, Whalley H, Cavanagh J. Between-and within-scanner variability in the CaliBrain study n-back cognitive task. Psychiatry Research: Neuroimaging. 2010 Nov 30;184(2):86-95.
2. Moorhead TW, Gountouna VE, Job DE, McIntosh AM, Romaniuk L, Lymer GK, Whalley HC, Waiter GD, Brennan D, Ahearn TS, Cavanagh J. Prospective multi-centre Voxel Based Morphometry study employing scanner specific segmentations: procedure development using CaliBrain structural MRI data. BMC medical imaging. 2009 May 15;9(1):1.
3. Gholipour A, Kehtarnavaz N, Scherrer B, Warfield SK. On the accuracy of unwarping techniques for the correction of susceptibility-induced geometric distortion in magnetic resonance Echo-planar images. In2011 Annual International Conference of the IEEE Engineering in Medicine and Biology Society 2011 Aug 30 (pp. 6997-7000). IEEE.
4. Jezzard P, Balaban RS. Correction for geometric distortion in echo planar images from B0 field variations. Magnetic resonance in medicine. 1995 Jul 1;34(1):65-73.
5. Ou Y, Sotiras A, Paragios N, Davatzikos C. DRAMMS: Deformable registration via attribute matching and mutual-saliency weighting. Medical image analysis. 2011 Aug 31;15(4):622-39.
6. Tzourio-Mazoyer N, Landeau B, Papathanassiou D, Crivello F, Etard O, Delcroix N, Mazoyer B, Joliot M. Automated anatomical labeling of activations in SPM using a macroscopic anatomical parcellation of the MNI MRI single-subject brain. Neuroimage. 2002 Jan 31;15(1):273-89.
7. Smith SM, Fox PT, Miller KL, Glahn DC, Fox PM, Mackay CE, Filippini N, Watkins KE, Toro R, Laird AR, Beckmann CF. Correspondence of the brain's functional architecture during activation and rest. Proceedings of the National Academy of Sciences. 2009 Aug 4;106(31):13040-5.
Figures
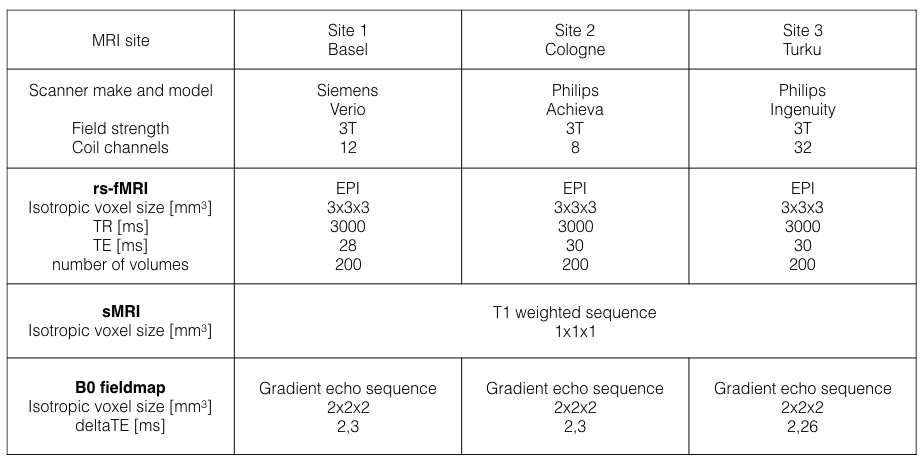
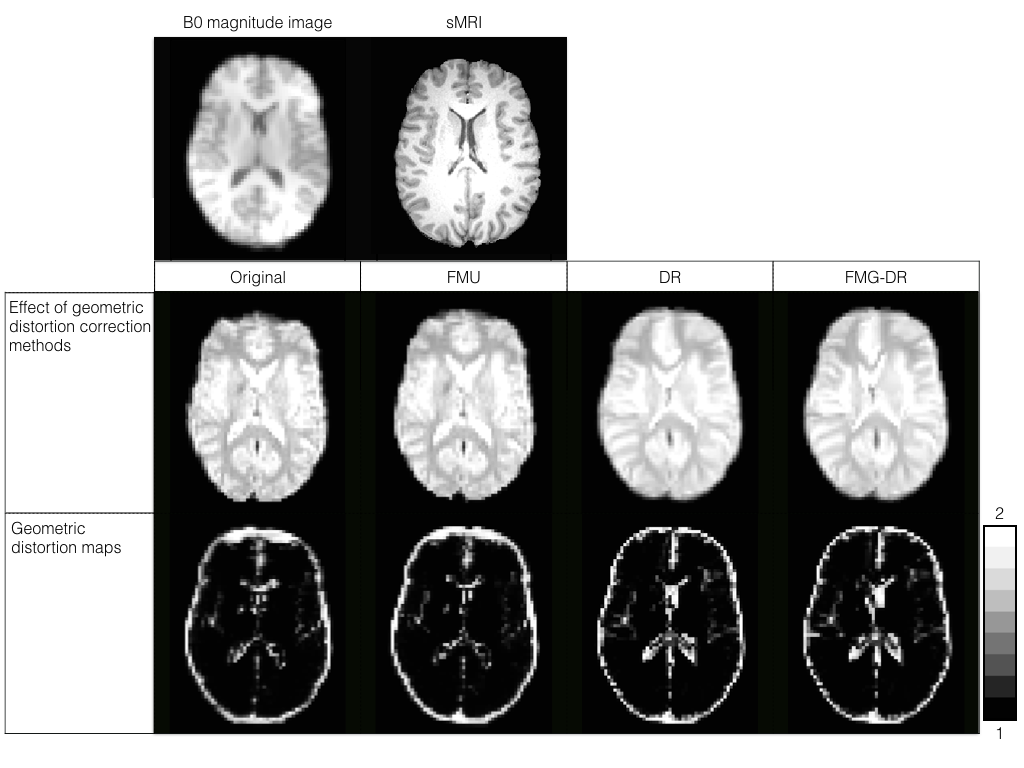
Figure 1: Top: Axial slice of undistorted B0 magnitude and sMRI image
Middle: The effect of the three geometric distortion correction methods is shown in an axial slice of the fMRI image, averaged over the time series. The original severe distortions in the frontal and cerebellar regions are corrected significantly.
Bottom: Axial geometric distortion maps based on the tissue probability difference between fMRI and the B0 magnitude image after segmentation. The geometric distortion values range from 2 indicating maximum to 0 expressing no distortion within the voxel.