1683
Is resting-state fMRI guided brain target localization for TMS reliable and reproducible?1Brigham and Women's Hospital, Boston, MA, United States, 2Massachusetts General Hospital, Boston, MA, United States
Synopsis
Transcranial magnetic stimulation (TMS) is a noninvasive treatment approach for major depressive disorder (MDD). A recently proposed method1 is to stimulate a sub-region in the left dorsolateral prefrontal cortex (DLPFC) that is most anti-correlated with the subgenual cingulate (SGC) as obtained from resting-state functional MRI (rsfMRI). To test the reliability of this approach, we examined 100 data sets from the Human Connectome Project (HCP)5 with each subject scanned 4 times on two different days. We found large variability in the inter-scan rsfMRI-guided target for each subject, which can significantly reduce the efficacy of TMS therapy in MDD.
Purpose
TMS is an FDA-approved neuromodulation treatment for adults with treatment-resistant MDD. It works by focally applying trains of electromagnetic pulses that increase the cortical excitability of the left DLPFC, a large and functionally diverse structure. Neuroimaging-guided approaches have been proposed to improve anatomical accuracy for the stimulation target, particularly seed-based rsfMRI of the SGC: the node within the DLPFC with the strongest anticorrelated connectivity with the SGC represents a window into the cortico-subcortical circuits that are affected by MDD. Nevertheless, the reliability of this approach has never been validated on a large cohort of subjects. In this work, we examined the left-DLPFC-SGC rsfMRI connectivity in 100 subjects from HCP with each subject having 4 scans in two days. As an additional control region, we also examined the connection between left DLPFC and the nucleus accumbens (NAc), a deep brain region close to SGC with lower EPI distortion effect. We also examined the functional connectivity using both volume and surface data with different preprocessing methods.Methods
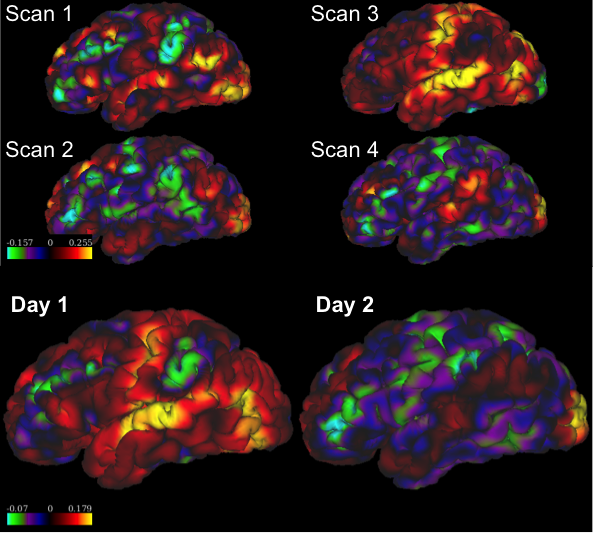
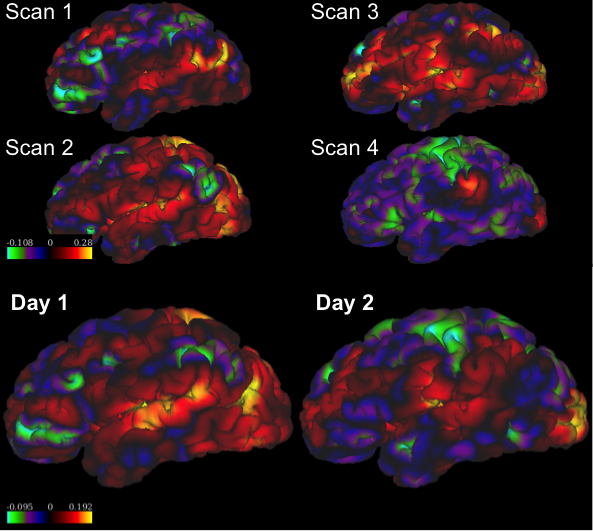
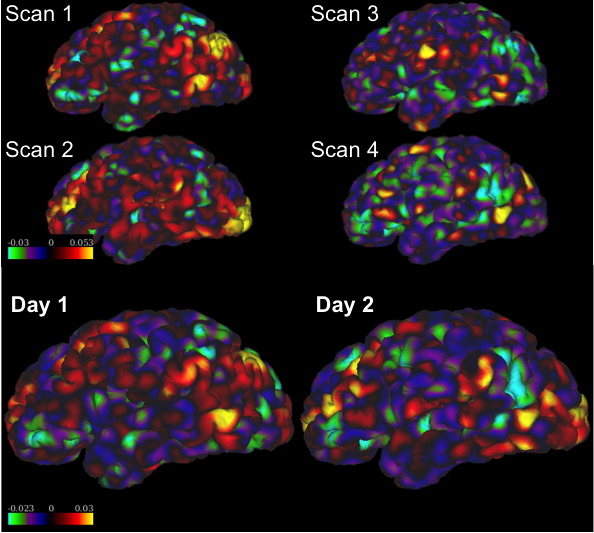
We used the minimally-processed rsfMRI volume data and ICA-FIX processed surface data4. Preprocessing: The volume data sets were processed by the SPM package2 as follows: drop 4 initial volumes, smoothing using 4mm-FWHM Gaussian kernel, temporal filter with pass band between 0.01 and 0.08 Hz, and regress-out nuisance signals from the white-matter and CSF regions. Label map: We defined an approximate left DLPFC region by combing the rostral middle frontal, caudal middle frontal, and the superior frontal regions from Freesurfer in the left cortex. The bilateral SGC region was manually drawn on one data set, and then it was nonlinearly transformed to other subjects using ANTS3. Since this SGC region is not contained in the surface data, only the volume data was used to investigate the left-DLPFC-SGC connection. For the left-DLPFC-NAc connection, Freesurfer label maps were used to localize the NAc region. Correlation map: For the volume and surface data, we computed the correlation coefficient between the signal at each voxel (or vertex) and the average signal in the SGC or NAc regions followed by spatial smoothing using a 4mm-FWHM Gaussian (Figures 1, 2 and 3). Comparison metrics: We first estimated the coordinates of the voxels/vertices in the left DLPFC that had the most negative correlation with SGC for each of the 4 correlation maps (from the 4 rsfMRI scans) of the same subject. Then we computed the Euclidean distance between each pair of the identified voxels/vertices denoted as the inter-scan distance. We also computed the correlation maps by combining the two data sets scanned on each day and computed the inter-day distance for each subject. For the left-DLPFC-NAc connections, we evaluated the inter-scan and inter-day distances between the voxels/vertices with the most positive or most negative values, respectively. To evaluate the variability of the correlation maps in the entire region of left DLPFC, we computed the correlation coefficient between these maps, which we call the consistency coefficient. For example, the consistency coefficient between two identical correlations maps is equal to 1. We computed the inter-scan consistency and inter-day consistency for the left-DLPFC–SGC and left-DLPFC-NAc connections, respectively.Results
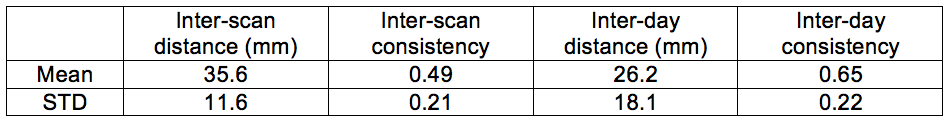
Table 1 and 2 show the mean and standard deviation (STD) of the inter-scan and inter-day distances and consistencies of the left-DLPFC-SGC and the left-DLPFC-NAc correlation maps from 100 subjects, respectively. The distances in Table 1 were computed between the voxels with most negative values in the left DLPFC, and the distances in Table 2 were computed for both positive and negative correlations. The main results are: 1) The inter-day distance is smaller than the inter-scan distance, 2) The inter-day consistency is also higher, as more data is used for computing the correlation maps, 3) In the left-DLPFC-NAc map, the distances between positively correlated voxels/vertices have lower values than the distance between negatively correlated voxels, 4) The results from volume data have much higher consistency than the results from surface data, which may be due to application of band-pass filters. Figure 1 illustrates the SGC correlation maps for the left cortex of a representative subject. Figures 2 and 3 illustrate the NAc correlation map for the same subject using volume and surface data, respectively.Discussion
The inter-scan distance between the rsfMRI-guided TMS target in the left-DLPFC-SGC network is about 35 mm (on average). Using more rsfMRI data (~30 min) could reduce the variability of the rsfMRI-guided target location. The described variability is larger than the spatial resolution of many TMS protocols, and hence it should inform the choice of stimulation parameters, which determine the focality of TMS neuromodulation.Acknowledgements
The authors would like to acknowledge the following grant which supported this work: R01MH099797 (PI: Rathi).References
1. Fox, M.D., Buckner, R.L., White, M.P., Greicius, M.D., Pascual-Leone, A., Efficacy of transcranial magnetic stimulation targets for depression is related to intrinsic functional connectivity with the subgenual cingulate. Biol. Psychiatry. 2012; 72, 595–603.
2. FcMRI Processing Tools: http://mrtools.mgh.harvard.edu/index.php?title=FcMRI_Processing_Tools
3. SPM package: http://www.fil.ion.ucl.ac.uk/spm/
4. ANTS package: http://stnava.github.io/ANTs/
5. David C. Van Essen, Stephen M. Smith, Deanna M. Barch, Timothy E.J. Behrens, Essa Yacoub, Kamil Ugurbil, for the WU-Minn HCP Consortium. (2013). The WU-Minn Human Connectome Project: An overview. NeuroImage 80(2013):62-79.
Figures