1675
Anesthesia-dependent effects on BOLD onset and amplitude assessed by line scanning fMRI with 50 ms temporal resolution1Department of Clinical Radiology, University of Muenster, Muenster, Germany
Synopsis
Medetomidine sedation is a common anesthetic regimen for rodent fMRI studies. However, depth and duration of the sedation may prove insufficient for MR imaging. Adding isoflurane is an efficient way to increase depth and duration of sedation. In rats we varied the concentration of additional isoflurane (0 - 1.5 %) and performed 1D line scanning upon electric forepaw stimulation to characterize the effect of increasing isoflurane on amplitude and onset of the BOLD response. While low concentrations did not significantly alter amplitudes or onsets, we found severely reduced amplitudes and delayed onsets for higher concentrations (> 0.7 %) of isoflurane.
Purpose
To study the effect of varying isoflurane dosage in combination with medetomidine sedation on amplitude and onset of the BOLD response.Introduction
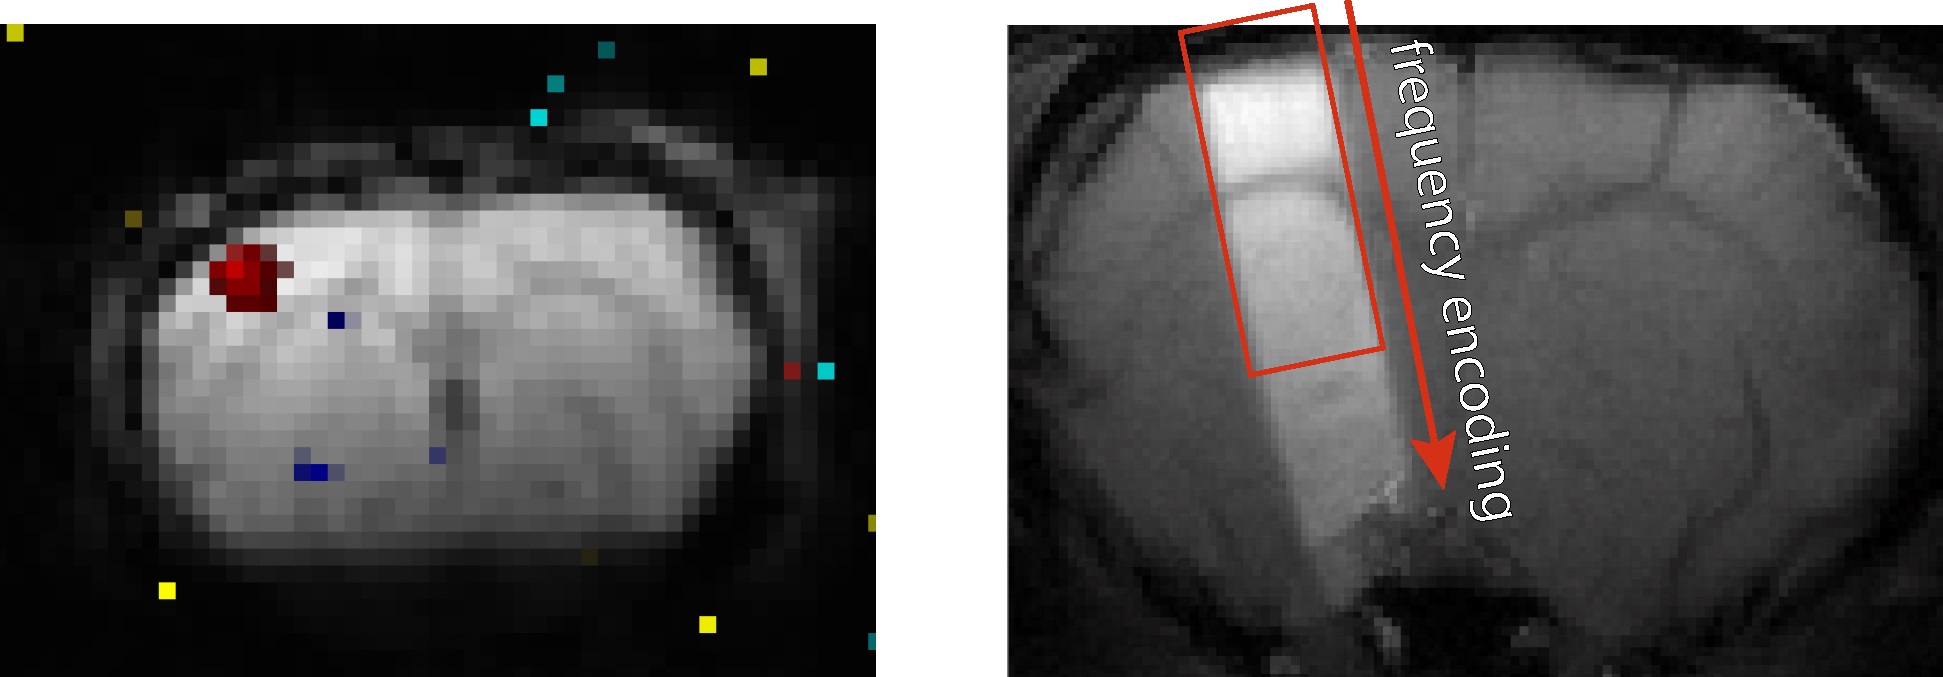
Medetomidine sedation is often used in rodent fMRI, as it preserves a strong BOLD response. Especially for prolonged experiments, the addition of isoflurane leads to deeper and more stable sedation, but isoflurane is known to reduce the BOLD response as it dilates vessels in the brain. We examined the BOLD response upon electric fore paw stimulation under increasing concentrations of 0 – 1.5 % isoflurane using line scanning fMRI1. Line scanning allows for acquisition of BOLD time courses with 50 ms temporal resolution from a defined imaging volume. 1D line scanning employs a FLASH sequence without phase encoding. Instead of 2D images, line profiles are acquired in each TR. The imaging volume is defined by slice selection, and saturation slices placed along the former phase encoding direction (Fig. 1).Methods
Female Fisher rats (n=5) were anesthetized with isoflurane (2-3 % isoflurane) and placed in the MRI scanner (9.4 T, 10 mm receive-only surface coil). Anesthesia was switched to medetomidine (bolus 0.04 mg/kg, permanent infusion of 0.05 mg/kg/h) and isoflurane was reduced (within 15 min) to 0 %. 40 minutes after bolus injection imaging experiments without isoflurane were performed. First, 2D BOLD fMRI with electric fore paw stimulation (5 s ON, 25 s OFF, 9 Hz, 1 ms-pulses, 1 mA) was performed using a GE-EPI sequence (TE = 18 ms, TR = 1 s, spatial resolution 350 x 325 µm², slice thickness 1.2 mm, 9 contiguous slices). BOLD maps were calculated to adjust slice position and width of the FOV for 1D line scanning, limited to a maximum of 2.1 mm. Frequency encoding was set perpendicular to the cortical surface (Fig. 1, TR 50 ms, TE 18 ms, flip angle 13°, FOV in frequency encoding direction 3.2-6.4 mm, resolution in frequency encoding direction 50-100 µm, acquisition bandwidth 5 kHz, 600 acquisitions, 64 repetitions, scan time 32 min). Using Matlab, a Fourier Transform was calculated along the frequency encoding direction and data were averaged across 63 repetitions (steady state signal) and across all cortical layers. Maximum BOLD amplitude of each filtered time course (low-pass filter, cut off frequency 0.475 Hz, zero-phase filtering) is reported. Measurements with BOLD amplitudes below 0.3 % or deformed responses were discarded. For the remaining scans (n=5 for 0 %, 0.2 % and 0.4 % isoflurane, n=3 for 0.7 % and 1 % isoflurane) onsets, defined as time after start of the stimulation, were determined by calculating the delay to half maximum T50 of filtered time courses and by fitting a gamma function with an explicit delay parameter T0 to the time courses2:
$$\begin{align}h(t) &= A \cdot \frac{(t-T_0)^{a-1} \cdot b^a}{\Gamma(a)} \cdot e^{-(t-T_0)b} ~~\mbox{for}~~ t\geq T_0 \\h(t) &= 0 ~~~~~~~~~~~~~~~~~~~~~~~~~~~~~~~~~~~~~~~~~~~~~~~~~~\mbox{for}~~t<T_0\end{align}$$.
Statistics are given as mean $$$\pm$$$ standard deviation and significance was assessed by Mann-Whitney U tests.
Results
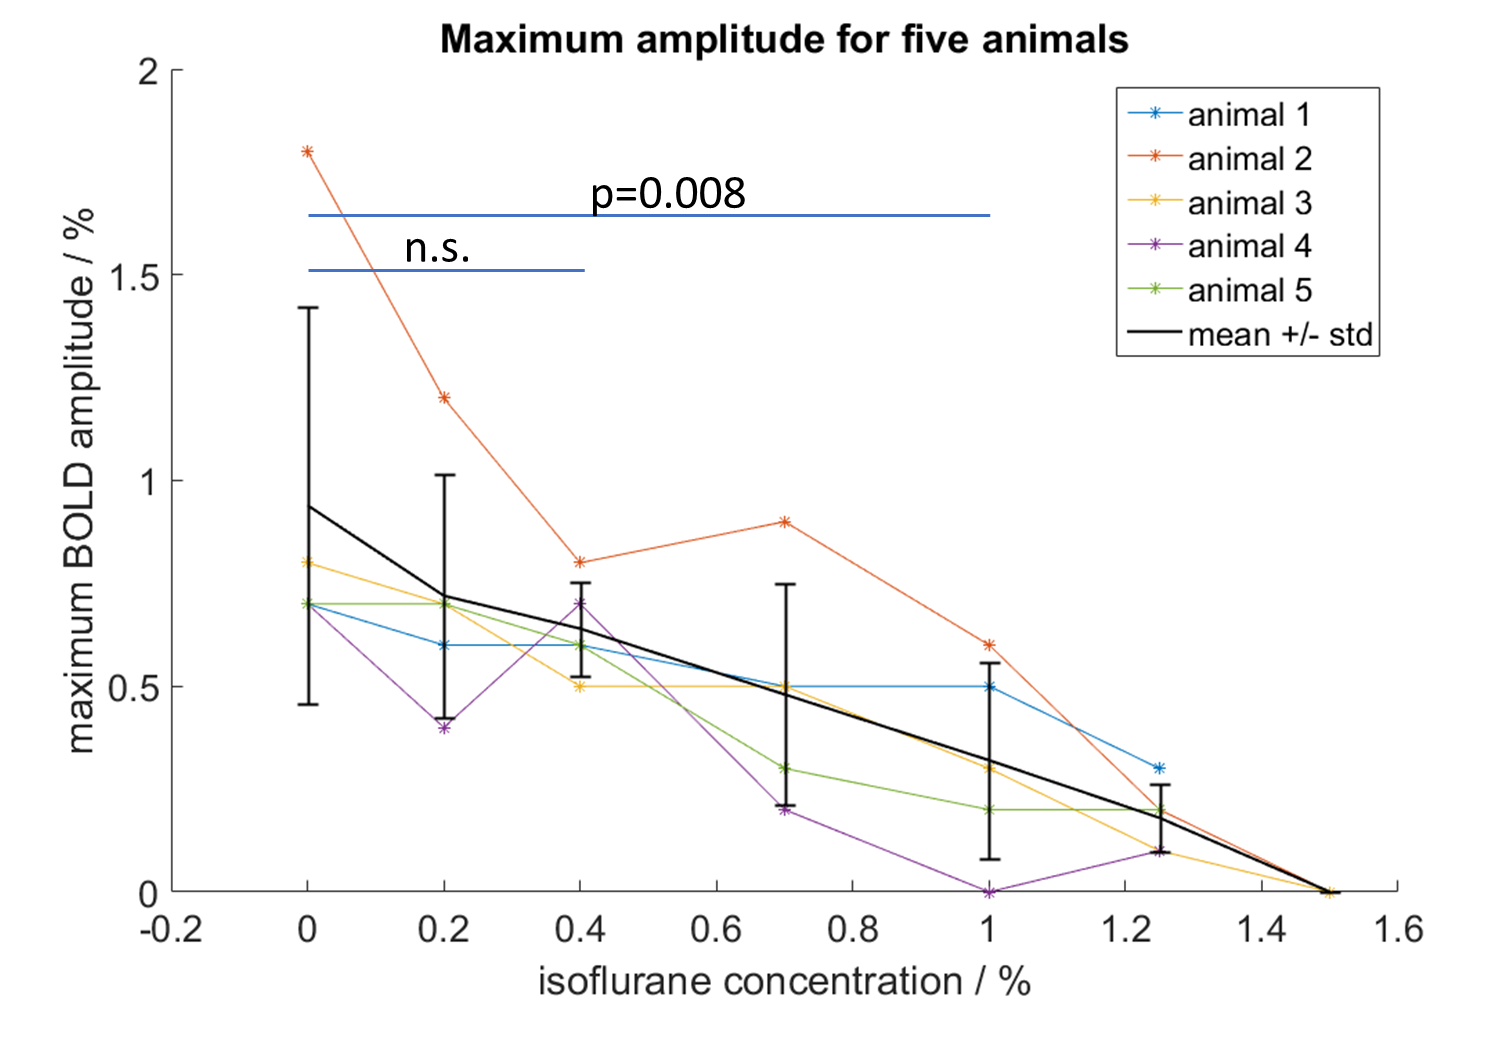
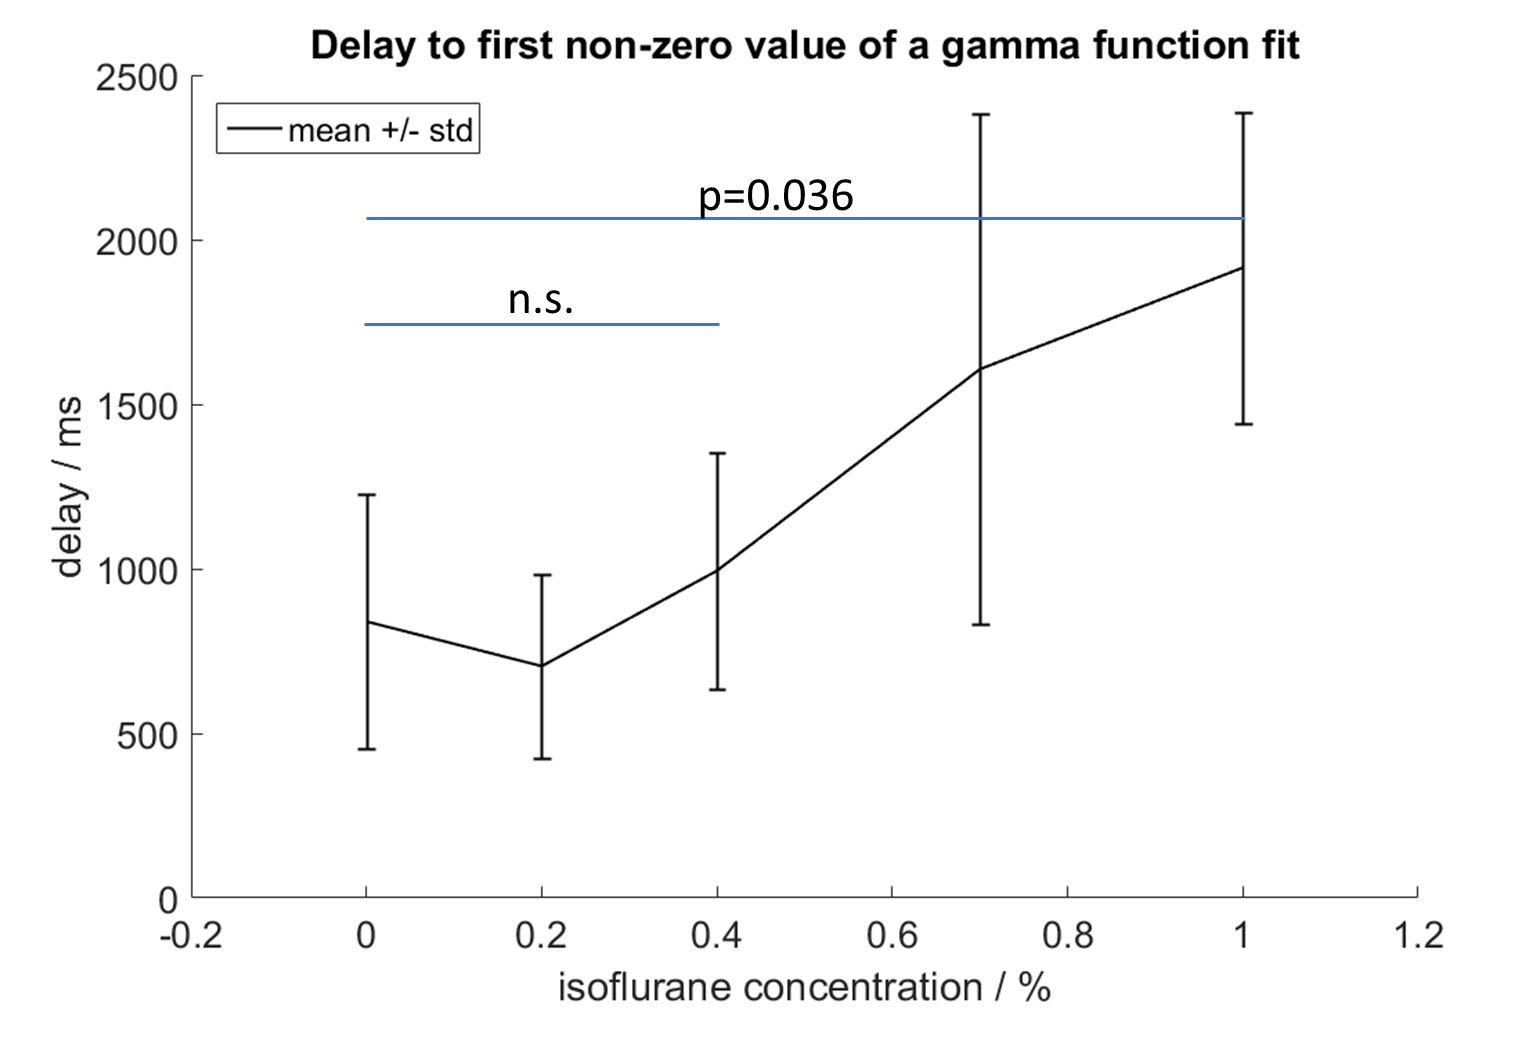
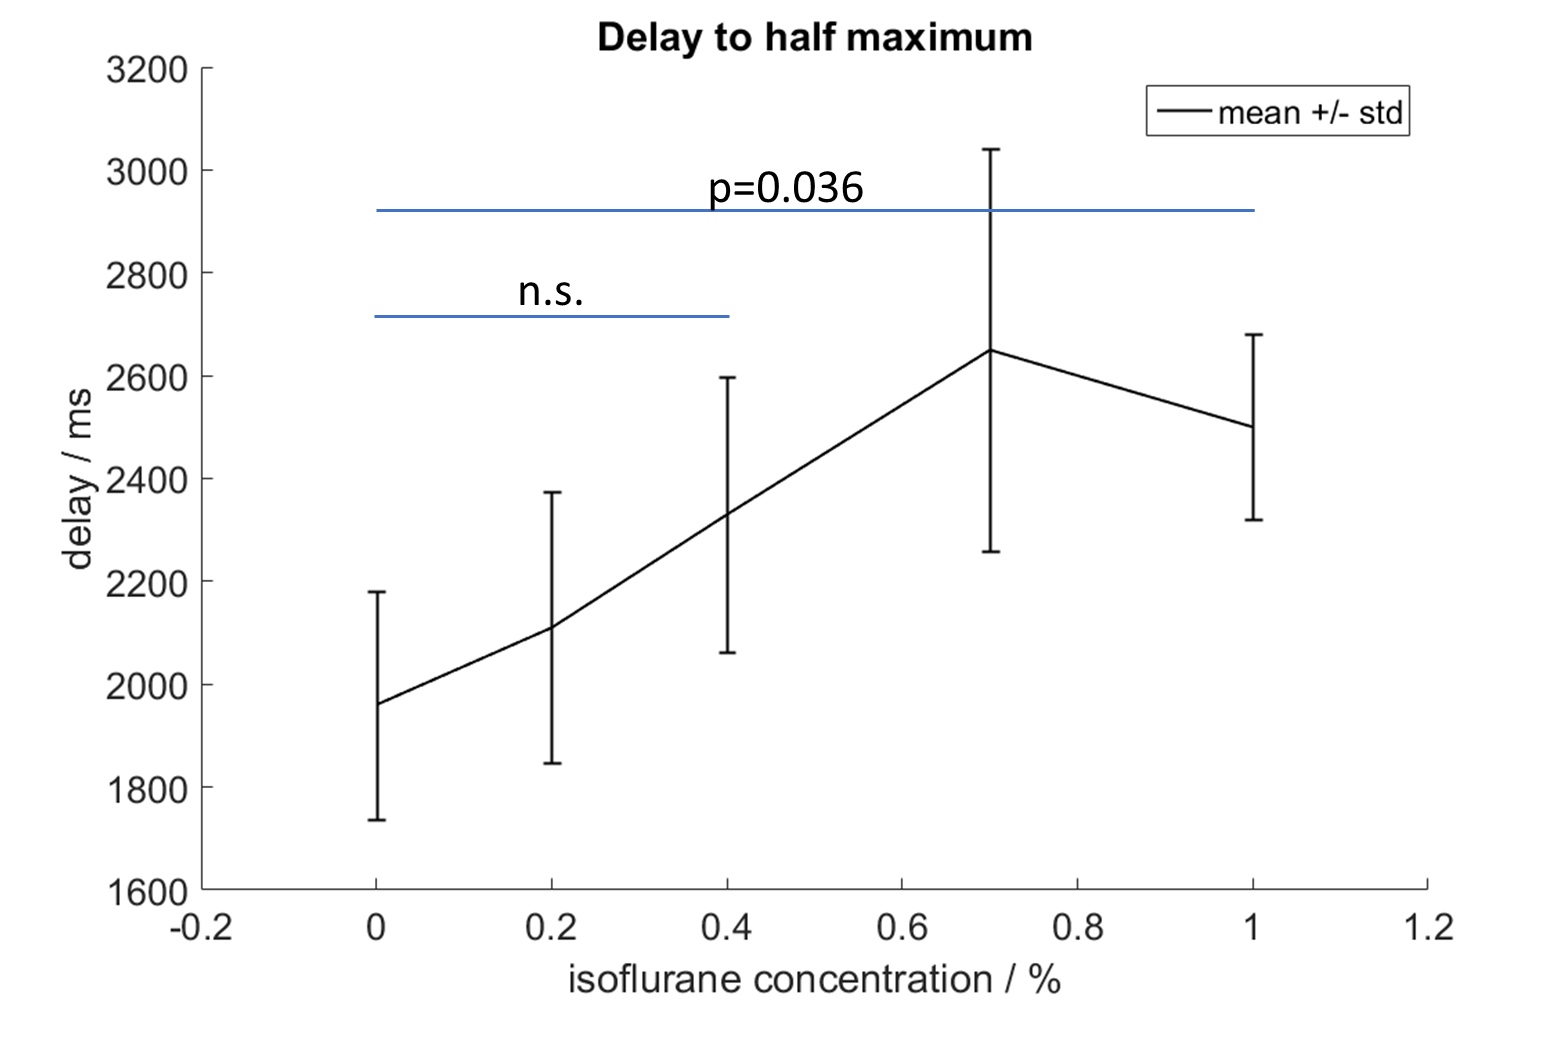
Line scanning was performed in medetomidine sedated rats with additional doses of 0 %, 0.2 %, 0.4 %, 0.7 %, 1 % and 1.25 % isoflurane (n=5). Measurements for 1.5 % were only possible in two of these animals, while the others showed too strong respiratory depression to continue. The BOLD amplitude strongly decreased with increasing isoflurane concentration (Fig. 2). The mean residual BOLD at 0.4 % isoflurane was 70±24 % of peak BOLD at 0 % isoflurane. BOLD amplitude at 1 % isoflurane was 30±27 % of peak BOLD. Only the reduction at 1 % isoflurane was significant (p=0.008 for 1 % vs 0 % and p=0.151 for 0.4 % vs 0 %). The delays, T50 and T0, increased for increasing isoflurane (Fig. 3 and Fig. 4). At 0 % isoflurane mean T0 was 800±400 ms, and 1900±500 ms at 1 % isoflurane. Mean T50 was 1960±220 at 0 % isoflurane, and 2500±180 at 1 % isoflurane. Differences were significant between 0 % and 1 % (p=0.036), but not between 0 % and 0.4 % isoflurane (p=0.222 for T50 and p=0.690 for T0).Conclusion
The combination of medetomidine with isoflurane has been proposed to preserve stable sedation for prolonged rat fMRI experiments. For low isoflurane concentrations up to 0.4 %, we did not detect significantly reduced amplitudes or altered onsets of the BOLD response. For higher isoflurane dosages, however, our observation of significantly reduced amplitude and delayed onset of the BOLD response call for caution with this anesthetic regimen. We propose to add only 0.2-0.4 % isoflurane for prolonged scan protocols under medetomidine sedation.Acknowledgements
No acknowledgement found.References
1. Yu X, Qian C, Chen D et al. Deciphering laminar-specific neural inputs with line-scanning fMRI. Nat Methods. 2014;11(1):55–58.
2. Boynton GM, Engel SA, Glover GH et al. Linear Systems Analysis of Functional Magnetic Resonance Imaging in Human V1. J Neurosci. 1996;16(13):4207–4221.
Figures