1673
Non-invasive evaluation of functional and structural connectome changes in the mouse brain related to drug-induced neuro-modulation1Advanced Molecular Imaging Research (AMIR), Medical Physics, Department of Radiology, University Medical Center Freiburg, Freiburg, Germany, 2Faculty of Biology, University of Freiburg, Freiburg, Germany, 3Department of Translational Medicine and Neurogenetics, Institute of Genetics and Molecular and Cellular Biology (IGBMC), Illkirch-Graffenstaden, Strasbourg, France, 4Medical Physics, Department of Radiology, University Medical Center Freiburg, Freiburg, Germany, 5Division of Stereotactic and Functional Neurosurgery, Department of Neurosurgery, University Medical Center Freiburg, Freiburg, Germany, 6Experimental Epilepsy Research, Department of Neurosurgery, University Medical Center Freiburg, Freiburg, Germany, 7Department of Biophysics and Nuclear Medicine, University Hospital Strasbourg, Strasbourg, France, 8Laboratory of Engineering, Informatics and Imaging, University of Strasbourg, Strasbourg, France, 9Department of Neuroradiology, University Medical Center Freiburg, Freiburg, Germany
Synopsis
Analysis of neuro-functional connectivity derived from rs-fMRI and neuro-structural connectivity derived from DTI/Fiber Tracking might enable researchers to monitor and characterize physiological or drug induced neuro-modulation in the mouse brain. In our study we present a framework for the analysis on healthy mice with erythropoietin (EPO) treatment. Brain regions with pronounced neuro-modulation in histology also showed changes in neuro-functional and neuro-structural data.
Introduction
The structural and functional
effects on mouse brain connectome after treatment with the neuromodulating drug
erythropoietin (EPO) were systematically evaluated with resting-state Functional
Magnetic Resonance Imaging (rs-fMRI) and streamline/fiber tracking to identify contrast
specific changes, which may be related to histologically observed structural differences
as well as improved learning capabilities of the EPO treated mice as seen in
the “Morris water maze” test. This holds the chance to study and monitor drug
and/or learning induced microstructural effects of the healthy mouse brain by
different MRI contrasts.
Methods
Animal preparation
Twelve male C57BL/6 N, 8–9
weeks old mice, weighting 25–30
g (Charles River), were randomly separated in 2 groups with 6 mice each. Two
weeks of habituation with a maximum of 3 mice per cage and baseline MRI, were
followed by intraperitoneal (i.p.) injections of EPO (5U/g) for one group (6
mice) and the same volume of 0.9% Saline i.p. injections for the other group (6
mice) every second day for 16 days. Additionally to the last 3 i.p.
EPO-/saline-injections all mice received 0.15 ml bromdesoxyuridin (BrdU)
solution (10 mg/ml) to label proliferating cells. After the injection periods
of 16 days a follow-up MRI was performed1.
MRI
In vivo mouse brain MRI (DTI, EPI) was performed before and after the i.p. injection-periods using a 7T Bruker small bore Biospin animal scanner with a mouse brain adapted CryoCoil (Bruker, Ettlingen, Germany). The imaging was performed under isoflurane (1.5%) anesthesia. Physiological parameters (heart rate, respiration rate, body temperature, blood oxygenation) were monitored throughout the scanning procedure.
rs-fMRI and ICA
rsfMRI data of the mouse brain excluding the cerebellum was acquired with a T2* - weighted single shot GE-EPI sequence (TE/TR = 10 ms/1700 ms, 200 Volumes, interlaced, 12 axial slices with 0.7mm thickness). The field of view was 19.2x12 mm2 with a planar resolution of 150x150 μm2. The images were smoothed with a Gaussian kernel (FWHM of 0.4x0.4x1mm3) and Spatial group independent component analysis (ICA) was performed using the GroupICATv4.0a (http://mialab.mrn.org/software/gift/) for Matlab (100 IC, ICASSO with bootstrapping+RandInit, 20 repetitions). Of the 100 components a total of 8 components were excluded (5 had an Iq < 0.7 and 3 were of vascular origin), leaving 92 independent components (ICs) for further analysis.
DTI and global fiber tracking
DTI was performed using a respiration triggered four-shot diffusion-weighted echo planar imaging sequence (repetition time: 7.750 ms; echo time: 20 ms. Time between the application of diffusion gradient pulses Δ = 10 ms; diffusion gradient duration δ = 4 ms; gradient amplitude G = 46.52 mT/m). The acquisition protocol included 30 gradient diffusion directions2 (Jones 30 encoding scheme), with a b-factor of 1000 s/mm2. The ICs from the rs-fMRI analysis were used as seeds for evaluating the inter-component fiber connectivity by counting the number of stream-lines derived from the DTI global fiber tracking analysis3.
Results and Discussion
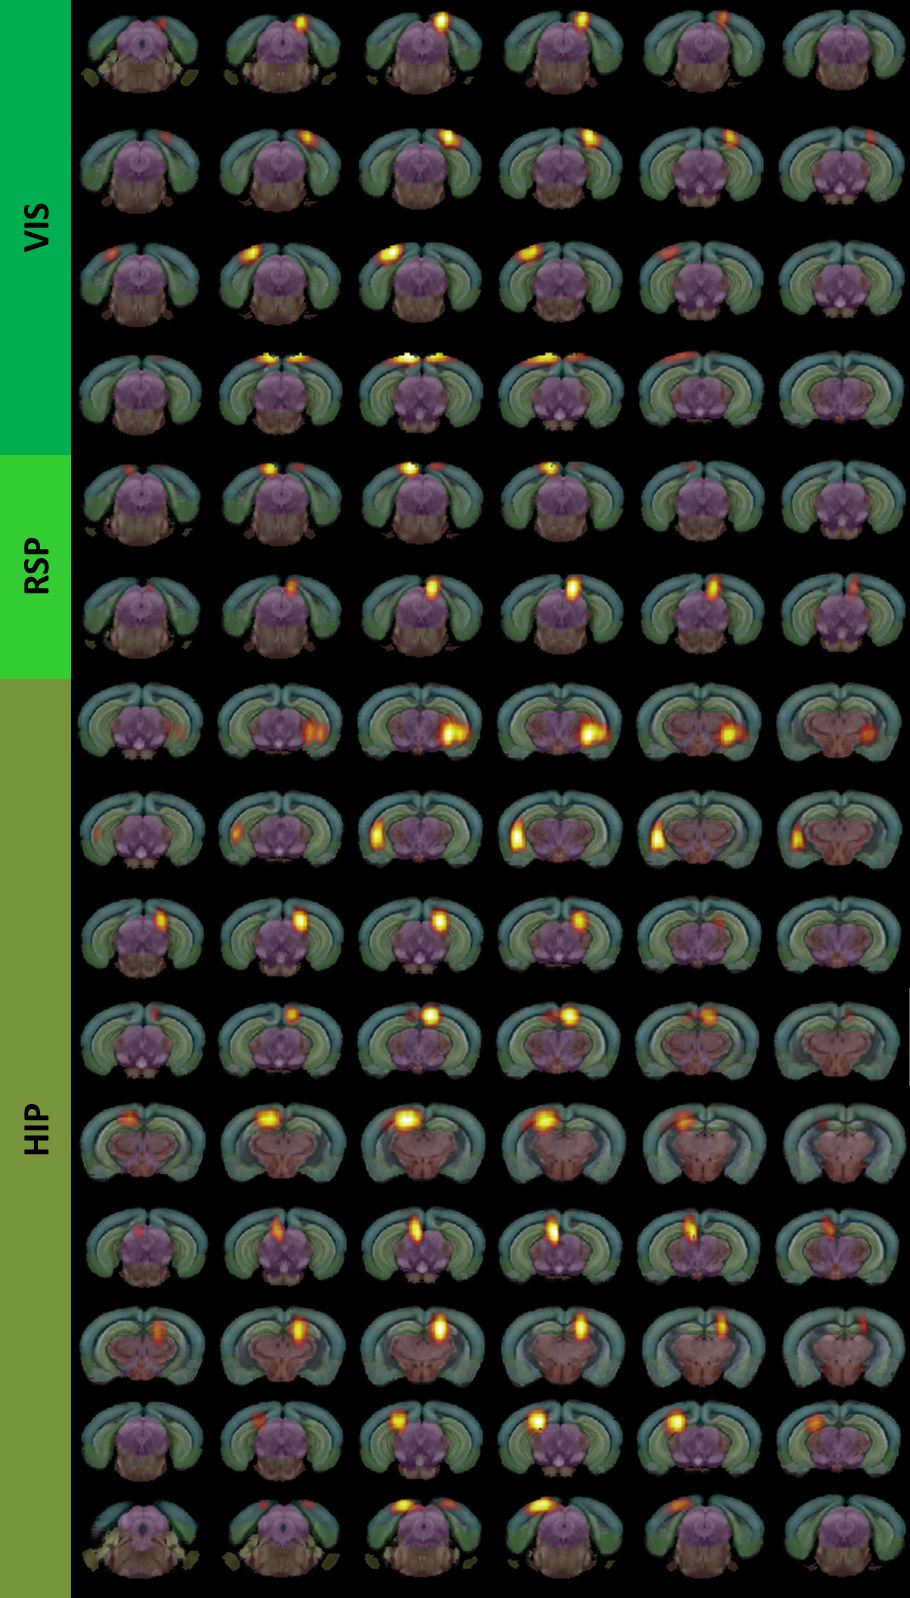
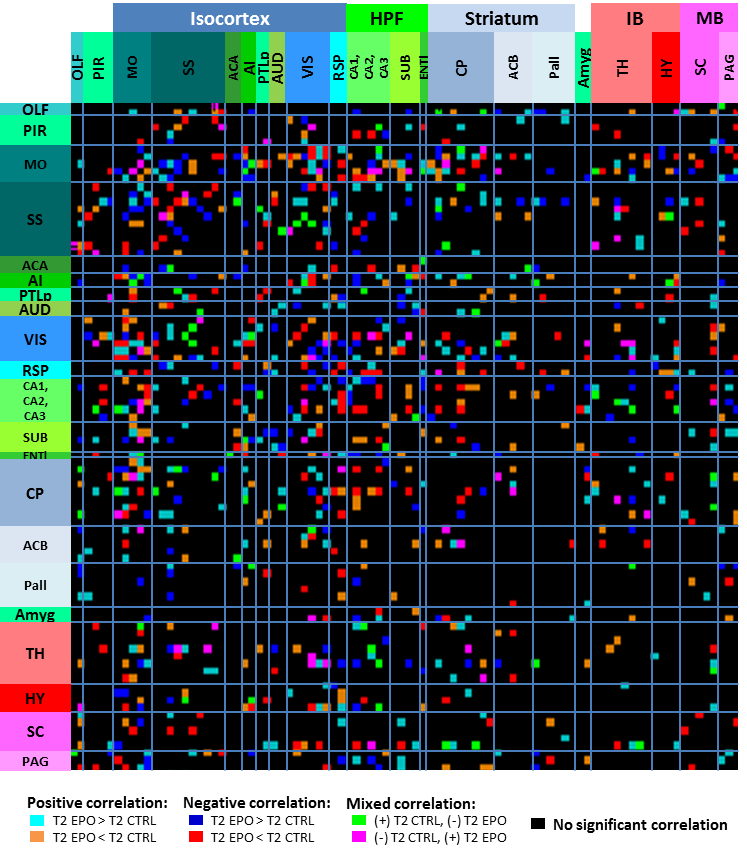
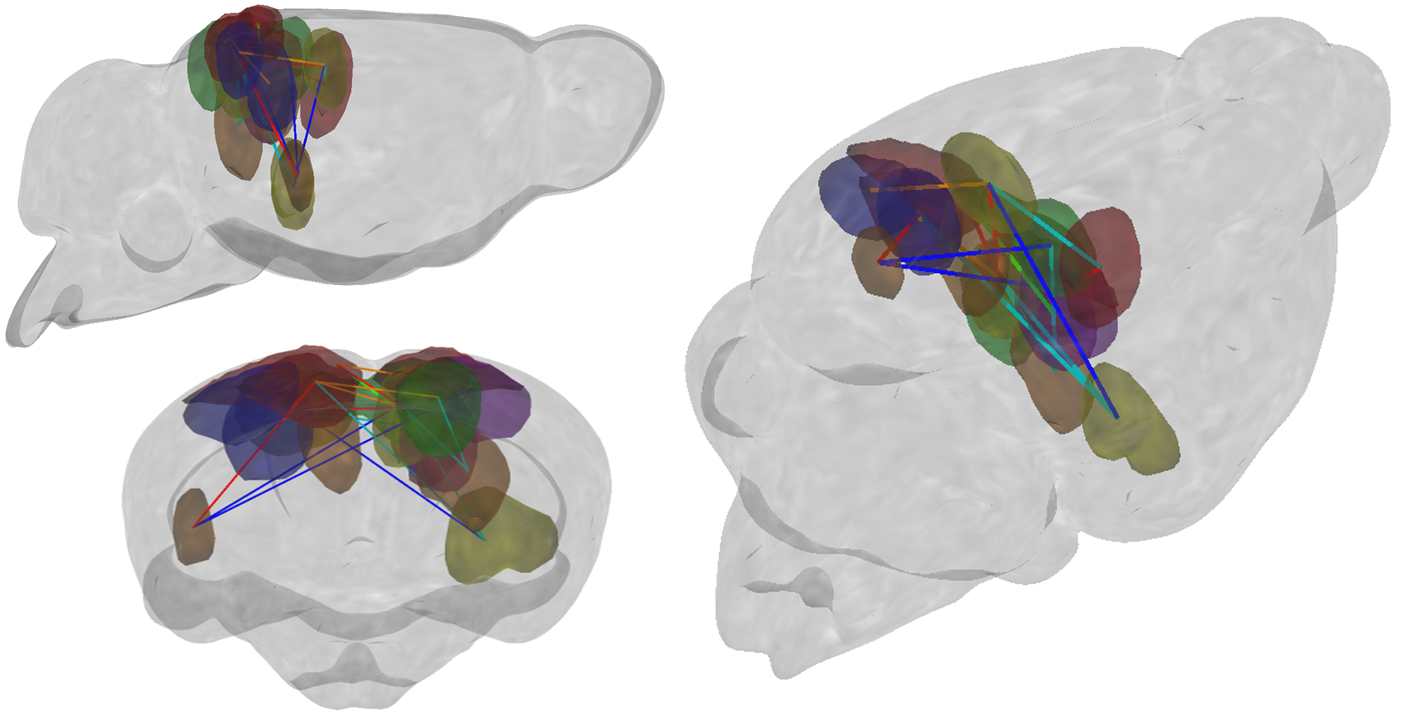
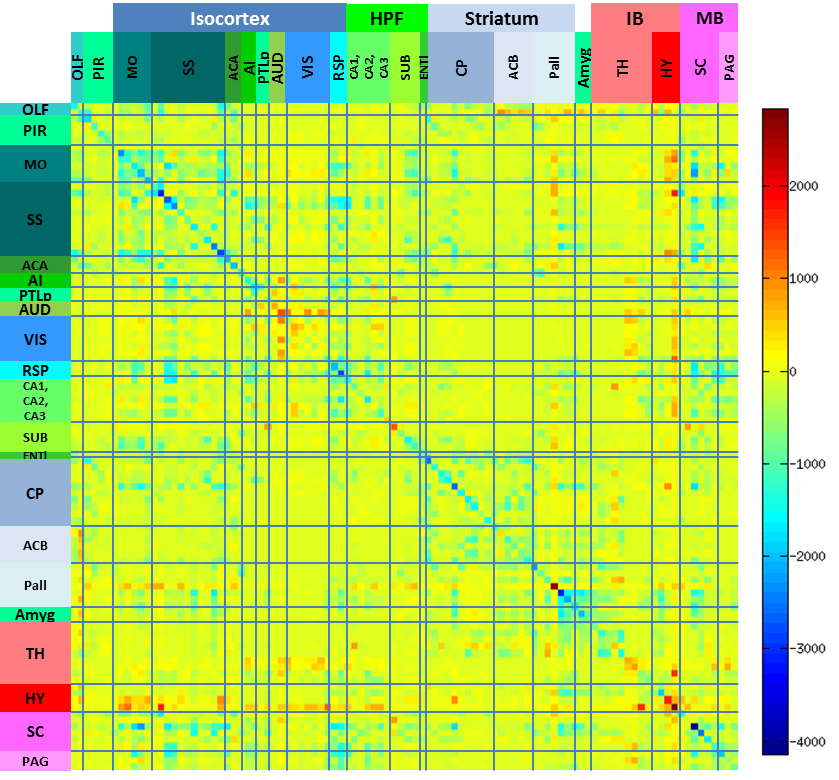
Results and Discussion: The inter-component timecourse relationship of 92 IC was evaluated using a partial correlation (PC) algorithm. In Egger et al., we found, that the Dentate Gyrus, Fimbria Fornix and Corpus Callosum showed significantly higher neuroneogenesis after EPO treatment compared to the Ctrl-group. After sorting our ICs from rostral to caudal into typical, often described clusters4, we identified ICs that showed strongly correlated timecourses and matched these ICs with the regions, we found histologically in our previous study1. This way we identified regions overlapping the auditory cortex, visual cortex, retrosplenial cortex and the hippocampal formation (Fig.1). Partial correlation (Ctrl vs. EPO) between inter-group correlations (Mouse 1-6 and Mouse 7-12) of the control group and the EPO treated group revealed significant changes (Fig.2, Fig.3). A similar pattern of changes was found in the matrix of differences (EPO group – Ctrl group) in streamline tracts from our global fiber tracking data (Fig.4). The areas covered by the ICs are partly attributed to the mediation between perceptual and spatial memory functions of the visual cortex and hippocampus. The findings might reflect the improved learning we found in the mice after treatment with EPO.Conclusion
State of the art MRI analysis tools were used to combine, evaluate and compare neuro-functional and neuro-structural changes in mice. Although our understanding of the involved processes is incomplete, our work may provide a foundation/framework for further investigations on how to systematically characterize brain MRI data and relate the findings to physiological processes such as brain development, learning or to assess effects of certain neuro-modulating therapies.Acknowledgements
No acknowledgement found.References
1. K. Egger, P. Janz, M.D. Döbrössy, T. Bienert, M. Reisert, M. Obmann, V. Glauche, C. Haas, L.A. Harsan, H. Urbach, D. von Elverfeldt: “Microstructural effects of a neuro-modulating drug evaluated by diffusion tensor imaging”, NeuroImage, Volume 127, 15 February 2016, Pages 1-10, ISSN 1053-8119, http://dx.doi.org/10.1016/j.neuroimage.2015.10.091.
2. Harsan, Laura-Adela, Paul, Dominik, Schnell, Susanne, Kreher, Bjorn W., Hennig, Jürgen, Staiger, Jochen F., von Elverfeldt, Dominik: „In vivo diffusion tensor magnetic resonance imaging and fiber tracking of the mouse brain.” NMR Biomed. 2010, 23 (7), 884–896. http://dx.doi.org/10.1002/nbm.1496.
3. Marco Reisert, Irina Mader, Constantin Anastasopoulos, Matthias Weigel, Susanne Schnell, Valerij Kiselev: “Global fiber reconstruction becomes practical”, NeuroImage, Volume 54, Issue 2, 15 January 2011, Pages 955-962, ISSN 1053-8119, http://dx.doi.org/10.1016/j.neuroimage.2010.09.016.
4. Anna E. Mechling, Tanzil Arefin, Hsu-Lei Lee, Thomas Bienert, Marco Reisert, Sami Ben Hamida, Emmanuel Darcq, Aliza Ehrlich, Claire Gaveriaux-Ruff, Maxime J. Parent, Pedro Rosa-Neto, Jürgen Hennig, Dominik von Elverfeldt, Brigitte Lina Kieffer, and Laura-Adela Harsan: “Deletion of the mu opioid receptor gene in mice reshapes the reward–aversion connectome”, PNAS 2016 113 (41) 11603-11608; doi:10.1073/pnas.1601640113
5.
Ed S. Lein, Michael J. Hawrylycz, Nancy Ao,
Mikael Ayres, Amy Bensinger, Amy Bernard, et al.: „Genome-wide atlas of gene expression in the adult mouse brain”, Nature,
445 (7124) (2007), pp. 168–176 http://dx.doi.org/10.1038/nature05453
Figures