1667
Corticolimbic Hyperresponse to Emotion and Glutamatergic Function in People with High Schizotypy: A Multimodal fMRI-MRS Study1Institute of Psychiatry, Psychology & Neuroscience, King's College London, London, United Kingdom, 2Centre for Brain Health, University of British Columbia, BC, Canada, 3Social Brain Lab, Netherlands Institute for Neuroscience, an institute of the Netherlands Academy for Arts and Sciences KNAW, Amsterdam, Netherlands, 4Psychology, University of Amsterdam, Amsterdam, Netherlands
Synopsis
Our recent functional magnetic resonance (fMRI) studies reported that elevated neural responses to emotional stimuli are present in the early stages of psychotic disorders and in individuals at clinical high risk for psychosis. Our present study combined fMRI with proton magnetic resonance spectroscopy (1H-MRS) at 3T and shows that corticolimbic hyperresponsivity to emotion is directly related to glutamate concentrations in healthy people with subclinical psychotic-like experiences. These data not only support preclinical animal models of psychosis by demonstrating an important link between corticolimbic neurophysiology and neurotransmission, but also suggest a scientific basis for future development of novel interventions focused on emotional regulation to prevent or delay progression from the vulnerability to the psychotic state
Purpose
Postmortem, neuroimaging and genetic evidence indicates that abnormalities in glutamatergic neurotransmission play a major role in the pathophysiology of schizophrenia1-3. Altered glutamatergic neurotransmission in corticolimbic areas including the anterior cingulate cortex (ACC) has been demonstrated in patients with schizophrenia and individuals at clinical high risk for psychosis4, while separate research has shown abnormal response to emotion in these groups5. However, the relationship between glutamate abnormalities and emotional response in schizophrenia is unknown. Schizotypy, referring to the presence of schizophrenia-like characteristics in healthy individuals, allows the examination of etiological processes underlying schizophrenia-spectrum disorders without medication or chronicity confounds6. We examined brain glutamate levels in subjects with high schizotypy (HS), and whether these are related to functional response to emotional stimuli.Methods
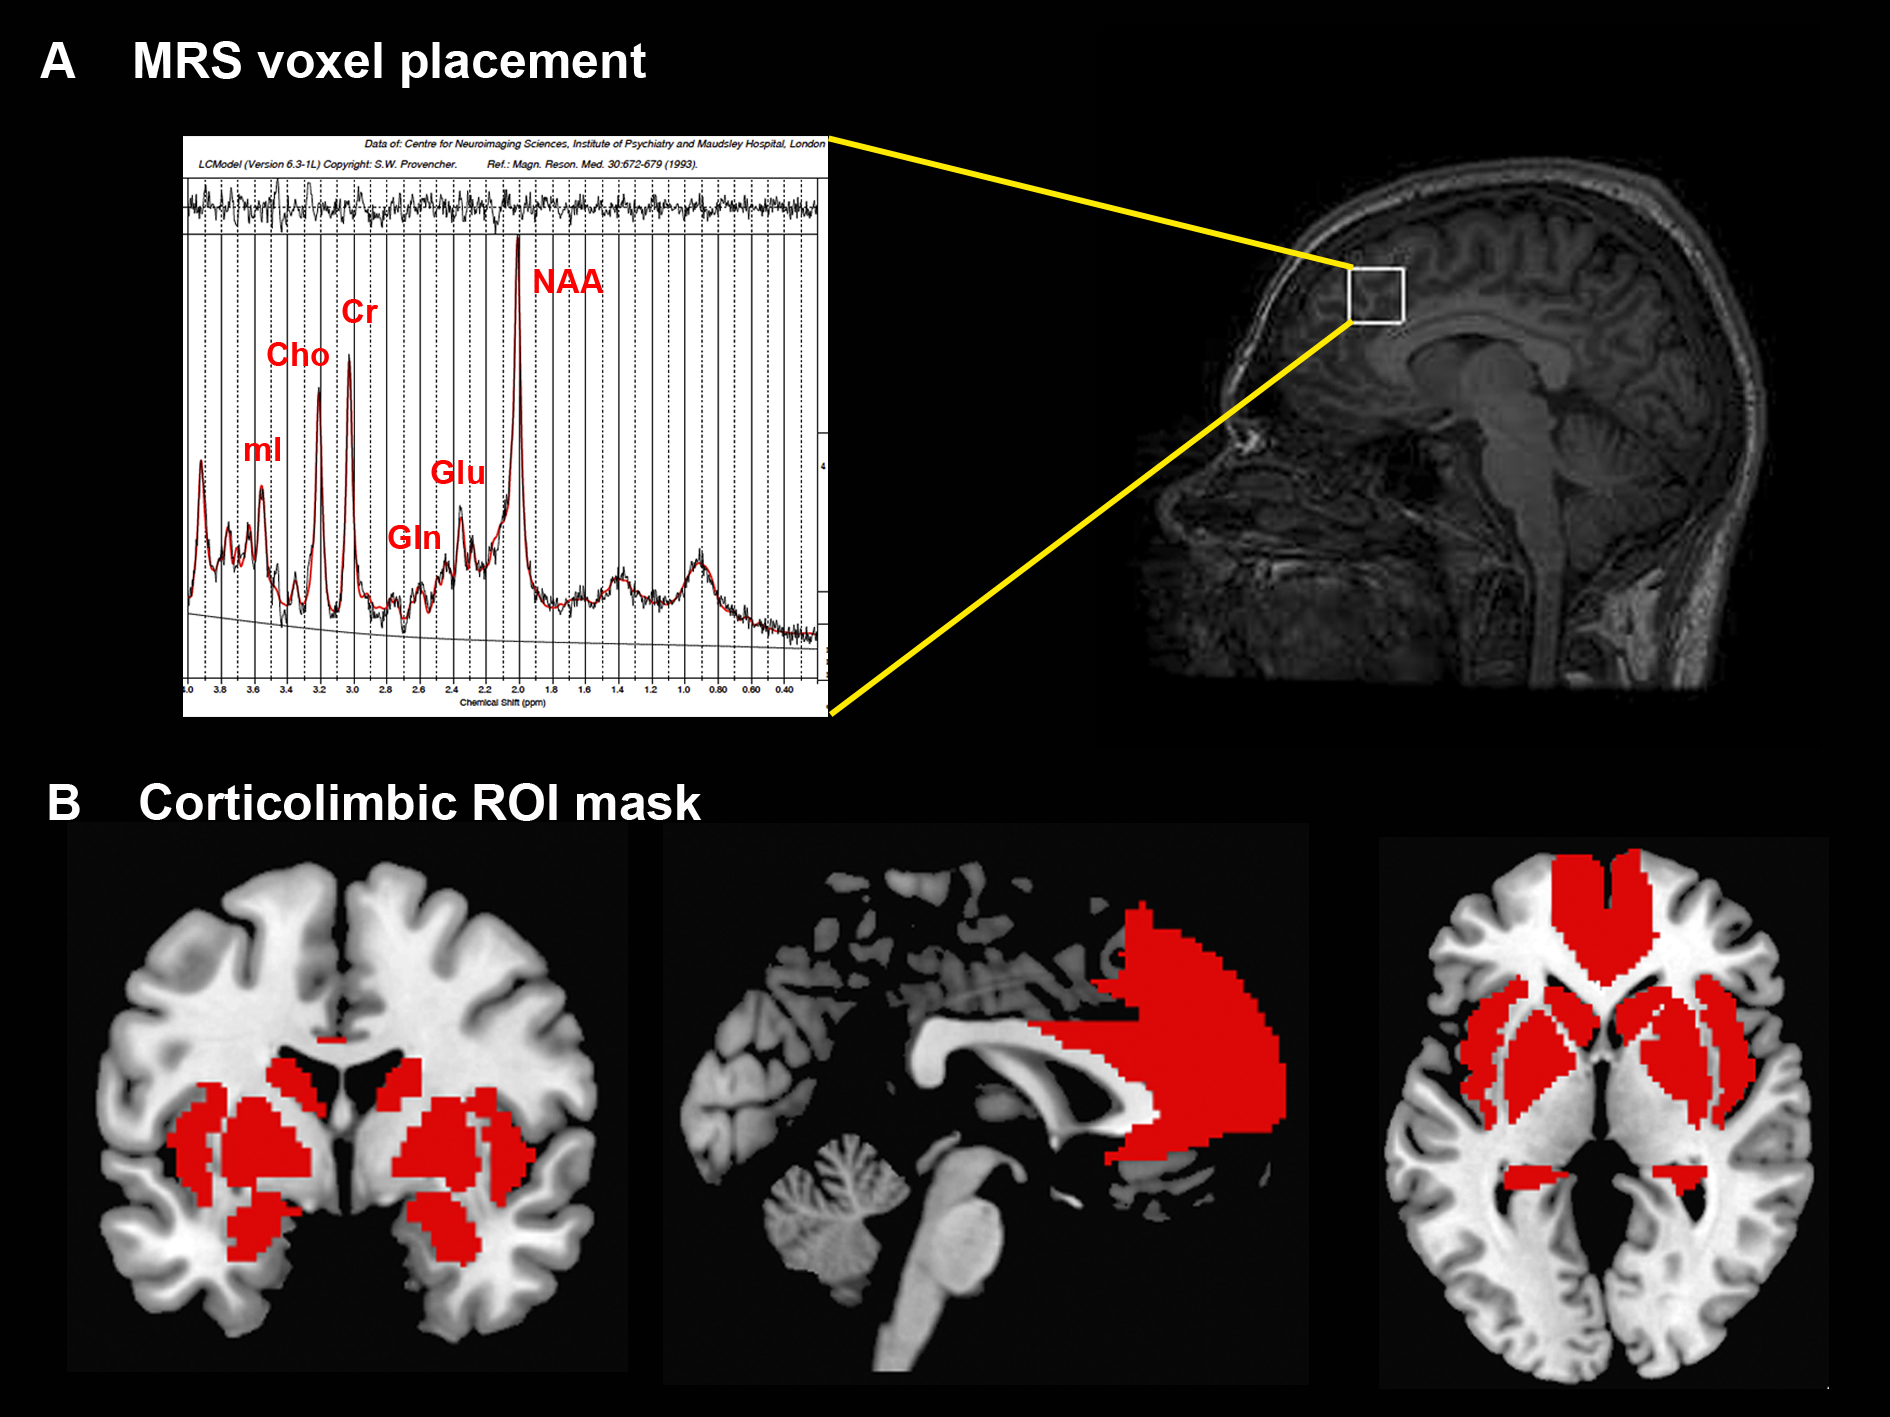
Healthy subjects (n=43; 21 HS and 22 low schizotypy, LS) were selected based on their Oxford and Liverpool Inventory of Feelings and Experiences rating7. Groups were matched on demographic variables. Echo-planar images sensitive to blood oxygenation level–dependent (BOLD) contrast were acquired while subjects viewed emotional and neutral pictures to measure hemodynamic responses on a General Electric Discovery MR750 3T system (Milwaukee, WI) (TR: 2000 ms; TE: 30 ms; flip angle: 75o; 3.3 x 3.3 x 3.0-mm voxels; field of view: 211; 41 axial sections collected with sequential (top down) acquisition and 0.3-mm inter-slice gap). Structural data were acquired by means of a 3D T1-weighted inversion recovery prepared gradient echo sequence (voxel size: 1.05 x 1.05 x 1.2mm, field of view: 270mm, 196 slices, TR: 7.3 ms, TE: 3.0 ms, inversion time: 400 ms). A proton magnetic resonance spectrum (1H-MRS; PRESS, Point RESolved Spectroscopy; TE: 30 ms; TR: 3000 ms; 96 averages) was acquired during the same scanning session to measure glutamate levels in the ACC, prescribed from the midline sagittal localizer, with the center of the 20×20×20mm ROI placed 13mm above the anterior section of the genu of corpus callosum at 90° to the AC-PC line (Figure 1A). Spectra were analyzed using LCModel version 6.3-1 L (http://s-provencher.com/pages/lcmodel.shtml) and the primary 1H-MRS measure was glutamate corrected for voxel cerebrospinal fluid. Between-group differences in ACC glutamate concentrations were examined with an independent samples t-test in SPSS. After standard preprocessing, statistical analyses of fMRI data were conducted using the General Linear Model implemented in SPM12. One contrast image was generated for each participant examining emotional-related activation, by contrasting all emotional trials vs. neutral trials, which was then submitted to an independent samples t-test for second-level analysis. We restricted our analyses to a circuitry involved in emotional perception (medial prefrontal cortex (MPFC) and ACC, insula, hippocampus, amygdala and striatum)8,9 using a region of interest (ROI) approach, with a mask created with Automated Anatomical Labeling as implemented in the WFU_Pickatlas toolbox in SPM (Figure 1B). We used an initial search threshold of p<.005 uncorrected, to then enforce voxel-wise correction for multiple testing at p<.05 family-wise error (FWE). The relationship between the BOLD response to emotional scenes within our network of interest and glutamate levels in the ACC was investigated by entering the individual glutamate values as covariates in an ANOVA design with the fMRI contrast images (emotional>neutral). Glutamate × BOLD response interactions were assessed separately for subjects with LS and subjects with HS, to then interrogate Group × Glutamate x BOLD response interactions in the same design matrix. As above, an initial search threshold was set at p<.005 uncorrected, to then consider significant regions surviving voxel-wise correction at p<.05 FWE.Results
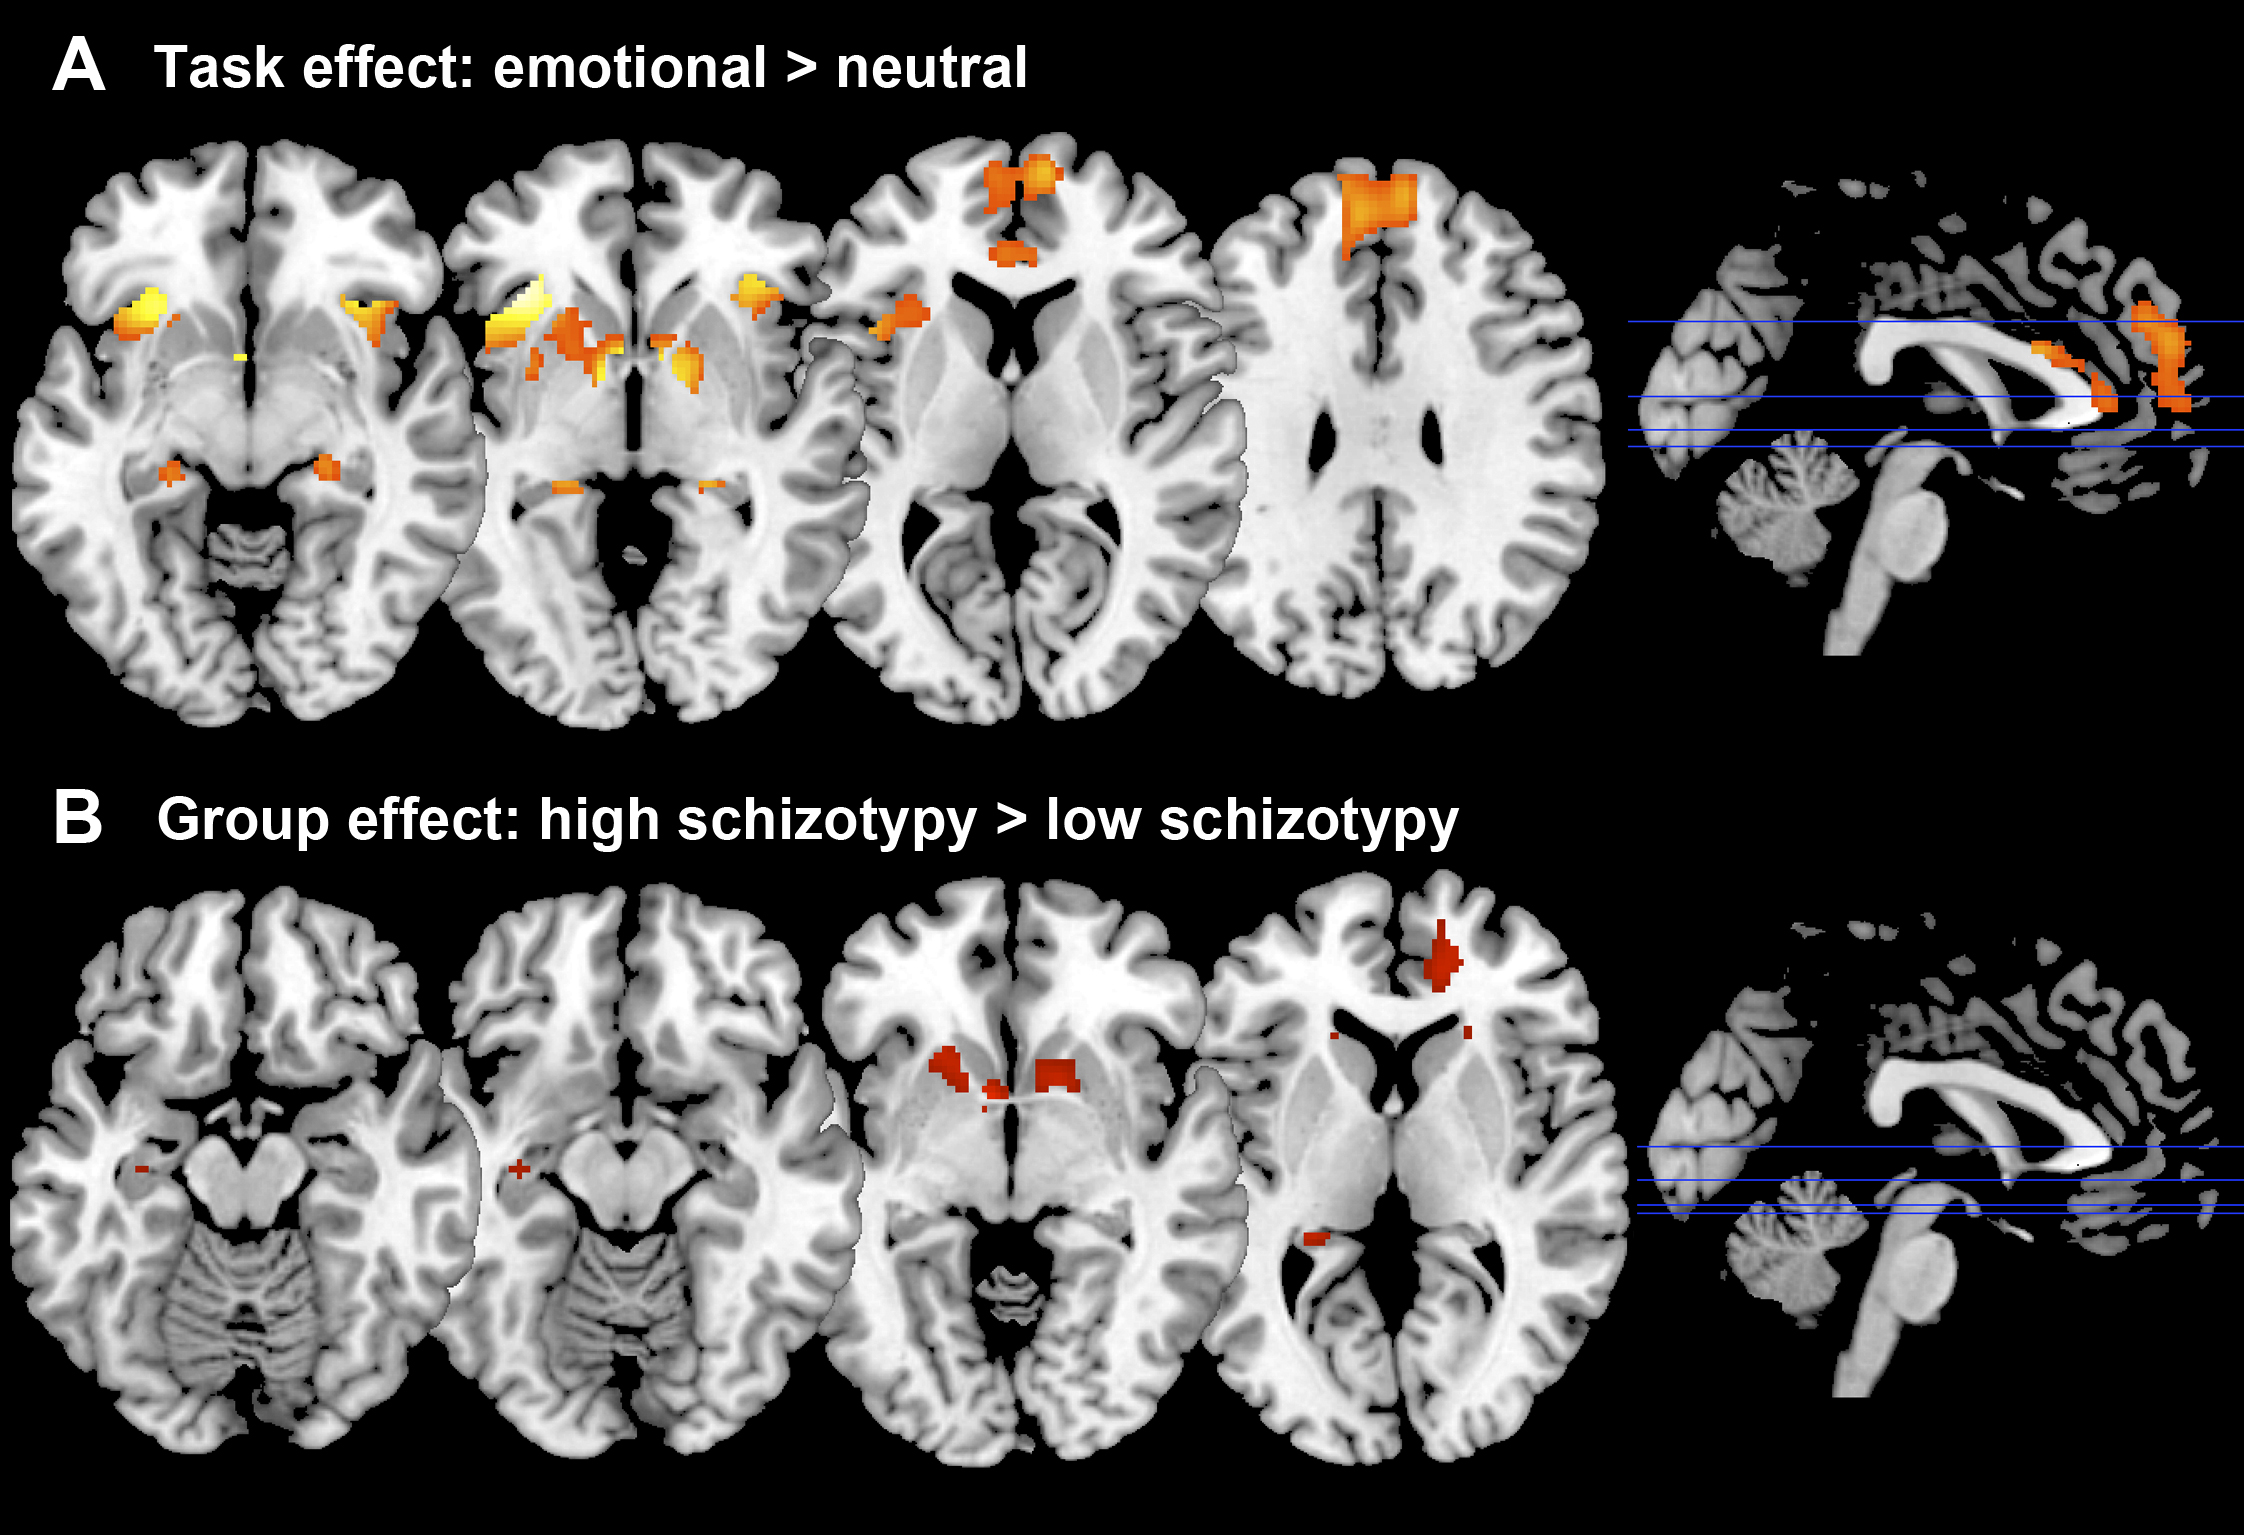
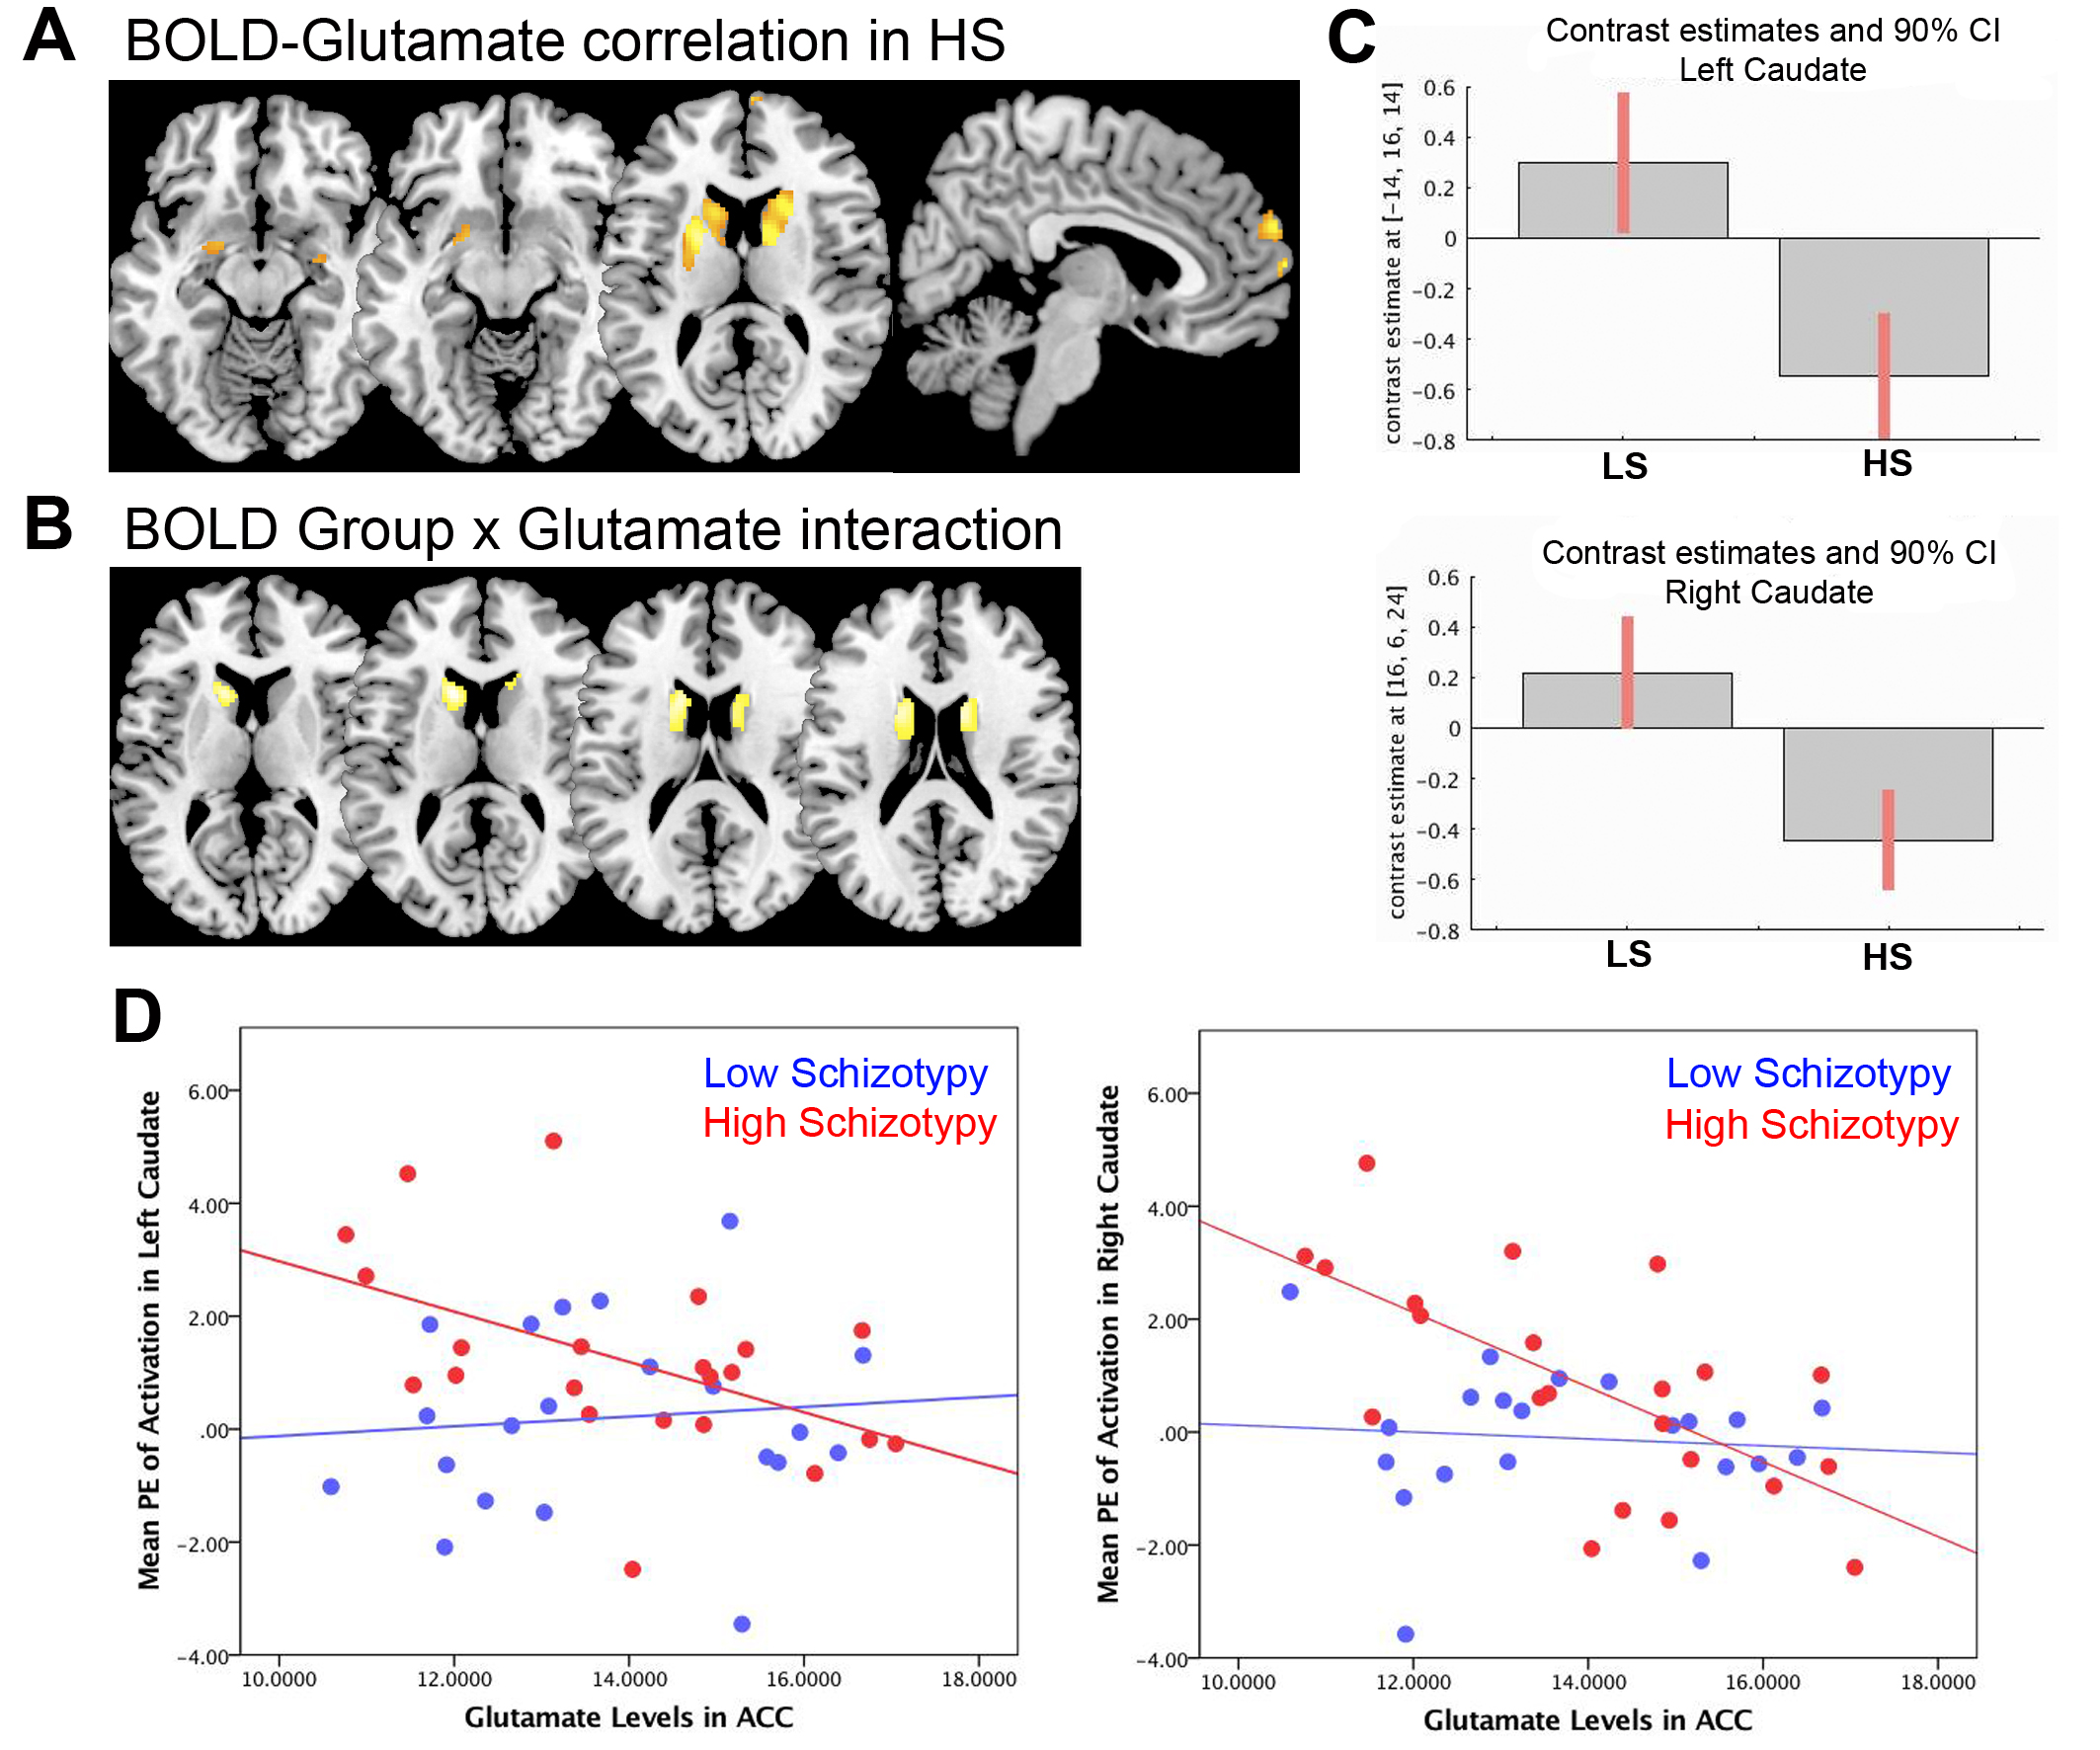
As expected, across groups the contrast Emotional > Neutral induced increased activation in the MPFC, ACC, and bilaterally in the striatum, insula, hippocampus, and amygdala (Figure 2A). Group comparisons revealed hyperresponsivity to emotional pictures in HS subjects compared to LS subjects in the caudate, and at trend level in the ACC, hippocampus, MPFC and putamen (Figure 2B). Spectra obtained were of good quality, with LC Model reporting mean ± SD signal-to-noise ratio of 25.44 ± 4.5 and line width of 4.83 ± 0.8 Hz, and there were no significant group differences in any of the parameters relating to spectral quality or in voxel tissue content. No between-group differences were found in glutamate concentrations, or in any of the other metabolites that could be reliably quantified within the voxel selected (glutamine, Glx –combined glutamate and glutamine-, myo-inositol, choline, creatine, and N-Acetylaspartate). Within the HS group, there was a significant negative correlation between ACC glutamate levels and response to emotional stimuli in a striatal region spanning adjacent parts of the left caudate and putamen, as well as in the right caudate, and at trend level in the MPFC and in the amygdala bilaterally (Figure 3A). Furthermore, there was a significant interaction between ACC glutamate levels, BOLD response to emotion and Group in the caudate bilaterally, which was driven by the negative association in the HS group compared to LS (Figure 3B).Discussion
The main finding of our study is that individuals with HS showed hyperreactivity to emotional pictures in the striatum, and marginally in the hippocampus, ACC, and MPFC. Although there were no significant differences in ACC glutamate concentrations between the two groups, in HS subjects glutamate levels were negatively associated with the degree of activation to emotional pictures in the striatum, as well as marginally in the amygdala and MPFC. These associations were absent in the LS group. Future multimodal studies investigating the pathway linking emotional dysregulation and the neurotransmitter systems GABA and glutamate in different groups along the psychosis continuum have the potential to unveil a mechanistic framework for the development of psychosis.Conclusion
Corticolimbic hyperresponsivity to emotion in people with HS is related to cortical glutamate levels, adding to accumulating evidence that abnormal interactions within brain systems associated with emotional processing are involved in psychosis vulnerability, and supporting the view that there is neurobiological continuity between subclinical psychotic experiences in healthy individuals and psychotic experiences in schizophrenia.Acknowledgements
This work was supported by a Brain & Behavior Research Foundation NARSAD Young Investigator Grant to G.M. (21200, Lieber Investigator). C.K. was supported by ERC grant 312511 from the European Research Council of the European Commission. The authors wish to thank the National Institute for Health Research (NIHR) Biomedical Research Centre at South London and Maudsley NHS Foundation Trust and KCL for their on-going support of our neuroimaging research, and gratefully acknowledge Mr Jeff Dalton and the MRI radiographers for their expert assistance in this work. We also thank Meghan O’Sullivan for her help with subject recruitment and scanning, and our study participants.References
1. Harrison PJ, Weinberger DR. Schizophrenia genes, gene expression, and neuropathology: on the matter of their convergence. Molecular psychiatry. 2005;10(1):40-68; image 45.
2. Pilowsky LS, Bressan RA, Stone JM, et al. First in vivo evidence of an NMDA receptor deficit in medication-free schizophrenic patients. Molecular psychiatry. 2006;11(2):118-119.
3. Konradi C, Heckers S. Molecular aspects of glutamate dysregulation: implications for schizophrenia and its treatment. Pharmacology & therapeutics. 2003;97(2):153-179.
4. Merritt K, Egerton A, Kempton MJ, Taylor MJ, McGuire PK. Nature of Glutamate Alterations in Schizophrenia: A Meta-analysis of Proton Magnetic Resonance Spectroscopy Studies. JAMA psychiatry. 2016;73(7):665-674.
5. Anticevic A, Van Snellenberg JX, Cohen RE, Repovs G, Dowd EC, Barch DM. Amygdala recruitment in schizophrenia in response to aversive emotional material: a meta-analysis of neuroimaging studies. Schizophrenia bulletin. 2012;38(3):608-621.
6. Barrantes-Vidal N, Grant P, Kwapil TR. The role of schizotypy in the study of the etiology of schizophrenia spectrum disorders. Schizophrenia bulletin. 2015;41 Suppl 2:S408-416.
7. Mason O, Linney Y, Claridge G. Short scales for measuring schizotypy. Schizophrenia research. 2005;78(2-3):293-296.
8. Wager T, Barrett LF, Bliss-Moreau E, et al. The neuroimaging of emotion. In: Lewis M, Haviland-Jones JM, Barrett LF, eds. The Handbook of Emotions. 3rd ed. New York, NY: Guilford; 2008:249-271.
9. Barrett LF, Mesquita B, Ochsner KN, Gross JJ. The experience of emotion. Annu Rev Psychol. 2007;58:373-403.
Figures