1666
Clinical mapping of cerebrovascular reactivity using MRI: a framework for reaching consensus1Sir Peter Mansfield Imaging Centre, School of Medicine, University of Nottingham, Nottingham, United Kingdom, 2Hotchkiss Brain Institute, Department of Radiology, University of Calgary, Canada, 3Institute of Medical Science, University of Toronto, Canada, 4Radiological Sciences Laboratory, Stanford University, United States, 5C.J. Gorter Center for High Field MRI, Radiology, Leiden University Medical Center, Netherlands, 6Centre for Neuroscience Studies, Queen’s University, Canada, 7Section on Funtional Imaging Methods, National Institute for Mental Health, United States, 8Montreal Neurological Institute, McGill University, Canada, 9Institute of Biomedical Engineering, University of Oxford, United Kingdom, 10PERFORM Centre, Concordia University, Canada, 11FMRIB Centre, Nuffield Department of Clinical Neurosciences, University of Oxford, United Kingdom
Synopsis
There is increasing clinical interest in mapping cerebrovascular reactivity (CVR), the response of cerebral blood vessels to a carbon dioxide stimulus. However, the application of CVR mapping varies greatly across sites due to a lack of methodological standardisation. We established an international network of over 100 researchers and administered a survey to establish current practice. Guided by QIBA and UPICT protocols, we developed a framework for reaching consensus, and identified areas where agreement already exists. Immediate achievable targets and long-term aims for the CVR community are defined, with the ultimate goal of establishing CVR as a robust clinical imaging marker.
Purpose
Cerebrovascular reactivity (CVR) mapping using a carbon dioxide stimulus assesses the ability of cerebral vessels to satisfy the demand for an increase in cerebral blood flow (CBF). In recent years the number of clinical CVR exams has greatly increased1. However, so far the application of CVR mapping across the world has been quite variable2, due to a lack of standardisation3. In this work we do not seek to prescribe a standard method, but aim to identify a process by which convergence and interoperability may be attained, in turn enabling more widespread adoption of CVR in the clinic.Methods
To build consensus across the field, we first established communication across research sites currently measuring CVR using MRI. The Imaging Cerebral Physiology Network was formed in 2014 and now consists of 100 members working in 10 countries. An open-ended questionnaire was circulated to characterise current practice, pool experiences in ethics and safety, and identify areas where the network could build consensus in methodology.Taking inspiration from the Quantitative Imaging Biomarkers Alliance (QIBA)4 and Uniform Protocol for Imaging in Clinical Trials (UPICT)5 frameworks, we used the responses to frame a discussion of how consensus in CVR mapping may be reached within the following areas:
$$$\bullet$$$ The clinical motivation for CVR
$$$\bullet$$$ Carbon dioxide administration
$$$\bullet$$$ MR imaging procedure
$$$\bullet$$$ CVR quantification
$$$\bullet$$$ Quality control and reproducibility
$$$\bullet$$$ Risk management
Results and Discussion
Responses were received from researchers at 10 institutions in 5 countries.
Clinical Motivation:
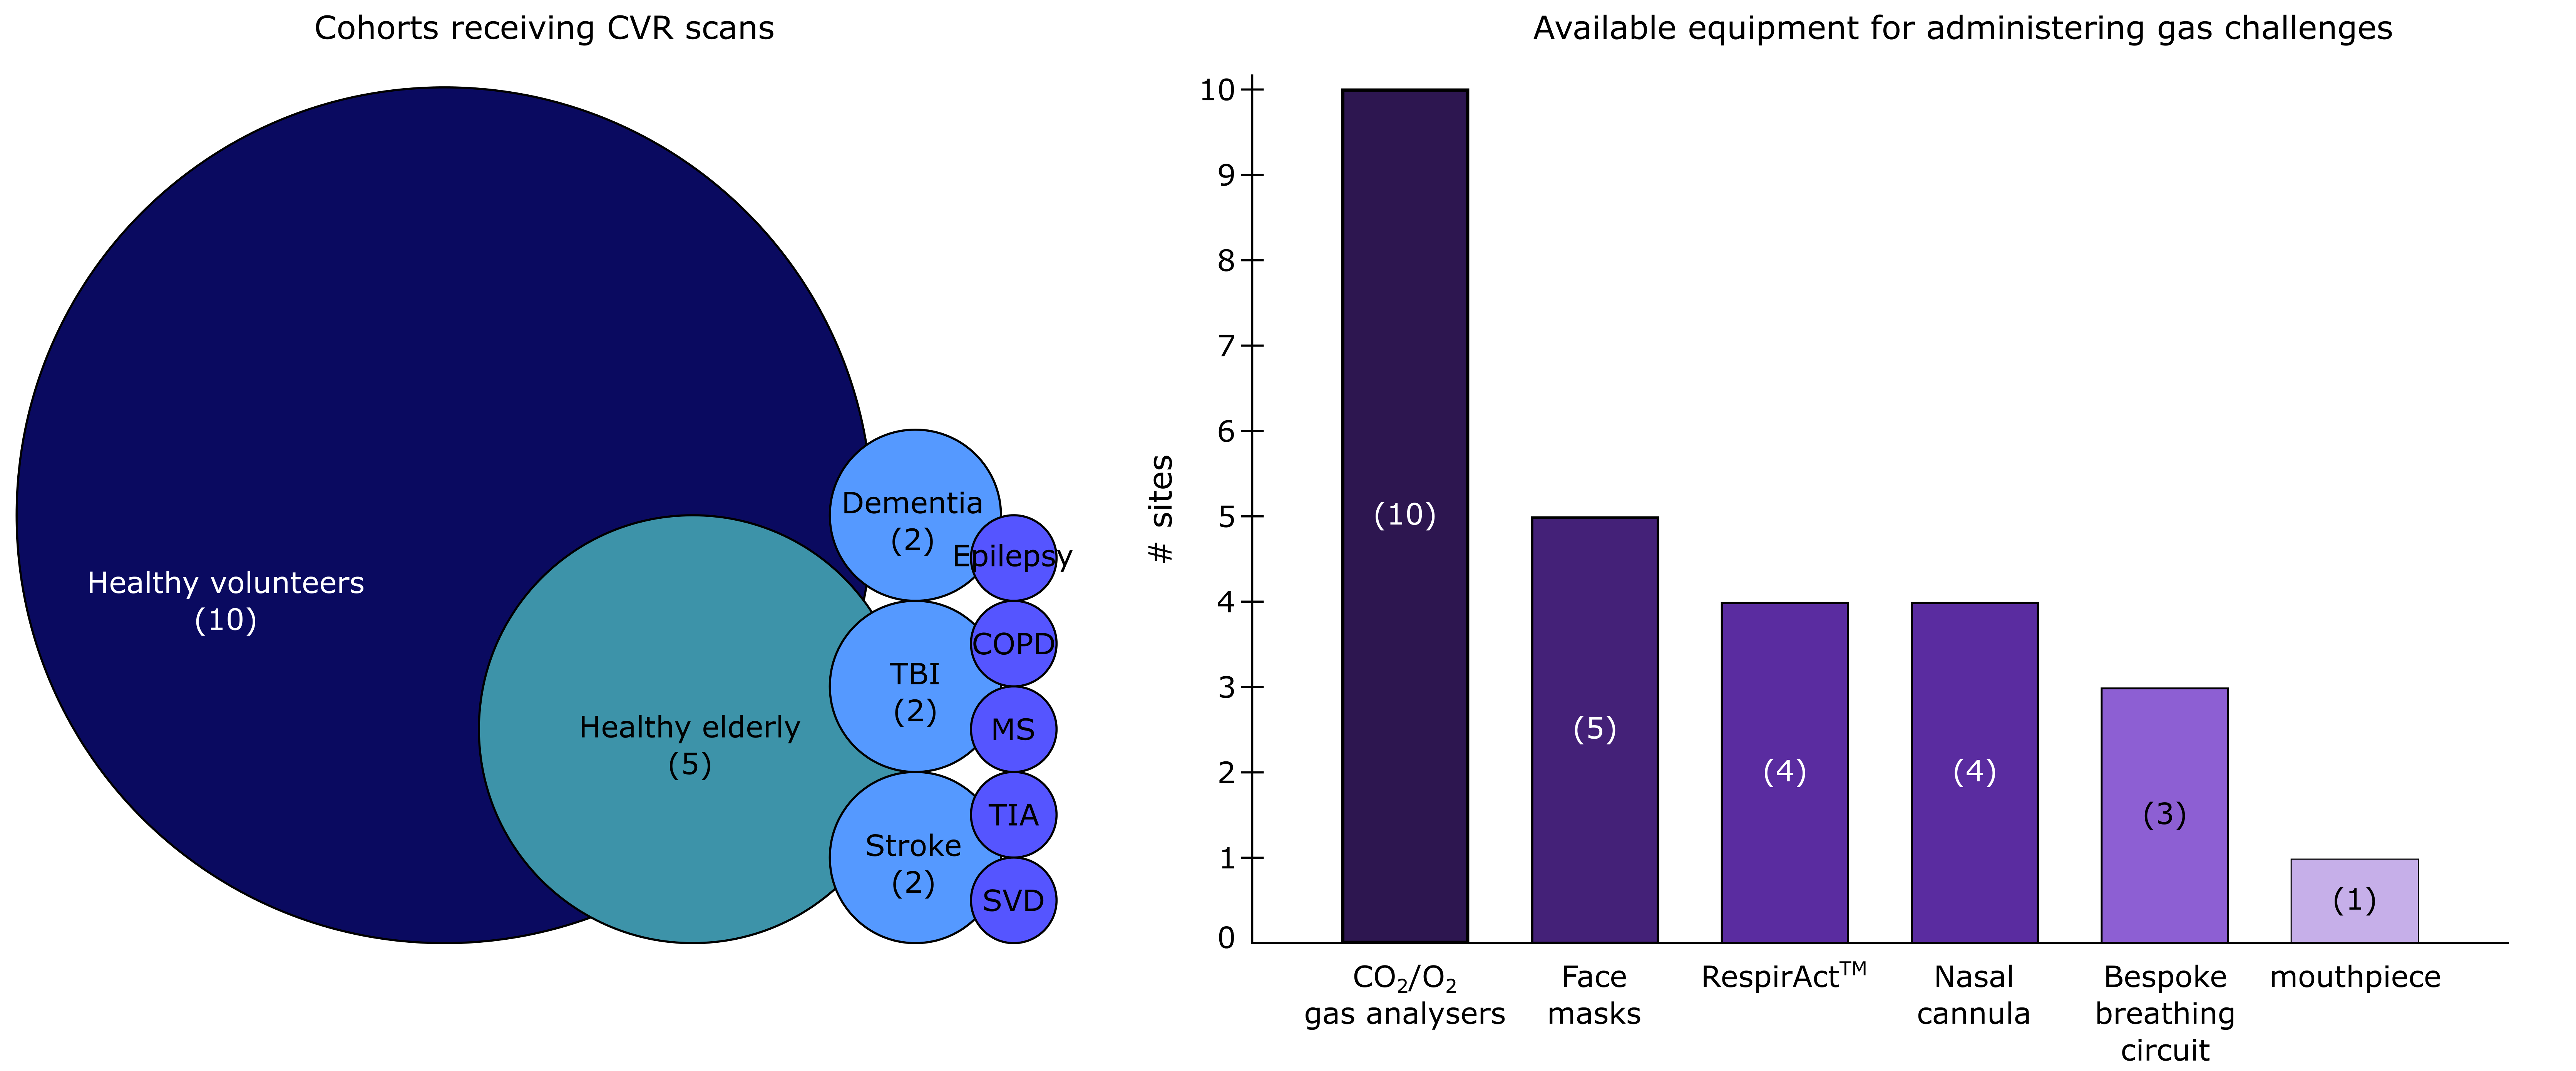
A QIBA profile requires a specific clinical application and expected technical performance. CVR methods are currently used in a wide range of patient cohorts (Fig. 1), however as yet there is no consensus on a clinical application to prioritise. To identify specific clinical targets, we propose a need for robust, pre-determined clinical outcome measures with hypothesized links to CVR, and informed power calculations to correctly estimate the necessary cohort sizes.
Carbon Dioxide Administration:
Different gas delivery equipment was in use across sites (Fig. 1) indicating that a single methodology for gas administration is not an immediate candidate for consensus. All sites employed block design hypercapnia paradigms (sinusoidal/ramp stimuli were also reported), however there was significant variation in the degree of hypercapnia administered: end-tidal CO2 (PETCO2) targets ranged from 40-58 mmHg or +4 to +15 mmHg above baseline levels. Further testing of the optimal stimulus magnitude and timing is required, and accepted ranges for these values should be agreed. Unbiased assessment of the reliability, sensitivity, specificity and accuracy of different gas delivery methods is needed to determine whether one or more methods should be recommended.
MR Imaging Procedure:
CVR scans were acquired at 1.5 T (1 site), 3 T (9 sites), and 7 T (4 sites); in the short term, efforts may concentrate on convergence of 3 T methods. Debate is required around acquisition methods (i.e. ASL quantitative perfusion versus BOLD) and the appropriate sequence parameters for different clinical populations to converge towards a commonly applicable standard.
CVR quantification:
All sites monitored expired gas content (i.e. PETCO2) during scanning. This has already been noted to be important for comparison between subjects, timepoints and sites3, although CVR reporting in units of %metric/mmHg is not used consistently in the literature3. Such a standard is readily available and should be universally adopted. Numerous data analysis methods exist for quantifying CVR6-9, and objective criteria for comparing and optimising these methods are necessary.
Quality Control and Reproducibility:
Whilst not explicitly covered by the initial questionnaire, each aspect of the CVR method would benefit from careful quality control. Existing imaging and respiratory data acquired using similar 3T block-design protocols should be used to identify data quality thresholds (e.g., BOLD/ASL signal-to-noise-ratio, PETCO2 stability) for future acquisitions. Sharing of such data should be facilitated to help establish normative values in healthy participants10-11 and assess inter-site variability.
Risk Management:
The specific concerns raised by the local ethical review committees varied greatly, and included safety of gas changes administered to participant; safety of gas delivery method (e.g. risk of asphyxia); stopping criteria for CVR scans; and participant discomfort. Only one site routinely administered a debriefing questionnaire following the scan. Definitions of adverse effects could be standardised across sites with the potential for a common post-scan discomfort questionnaire to be adopted.
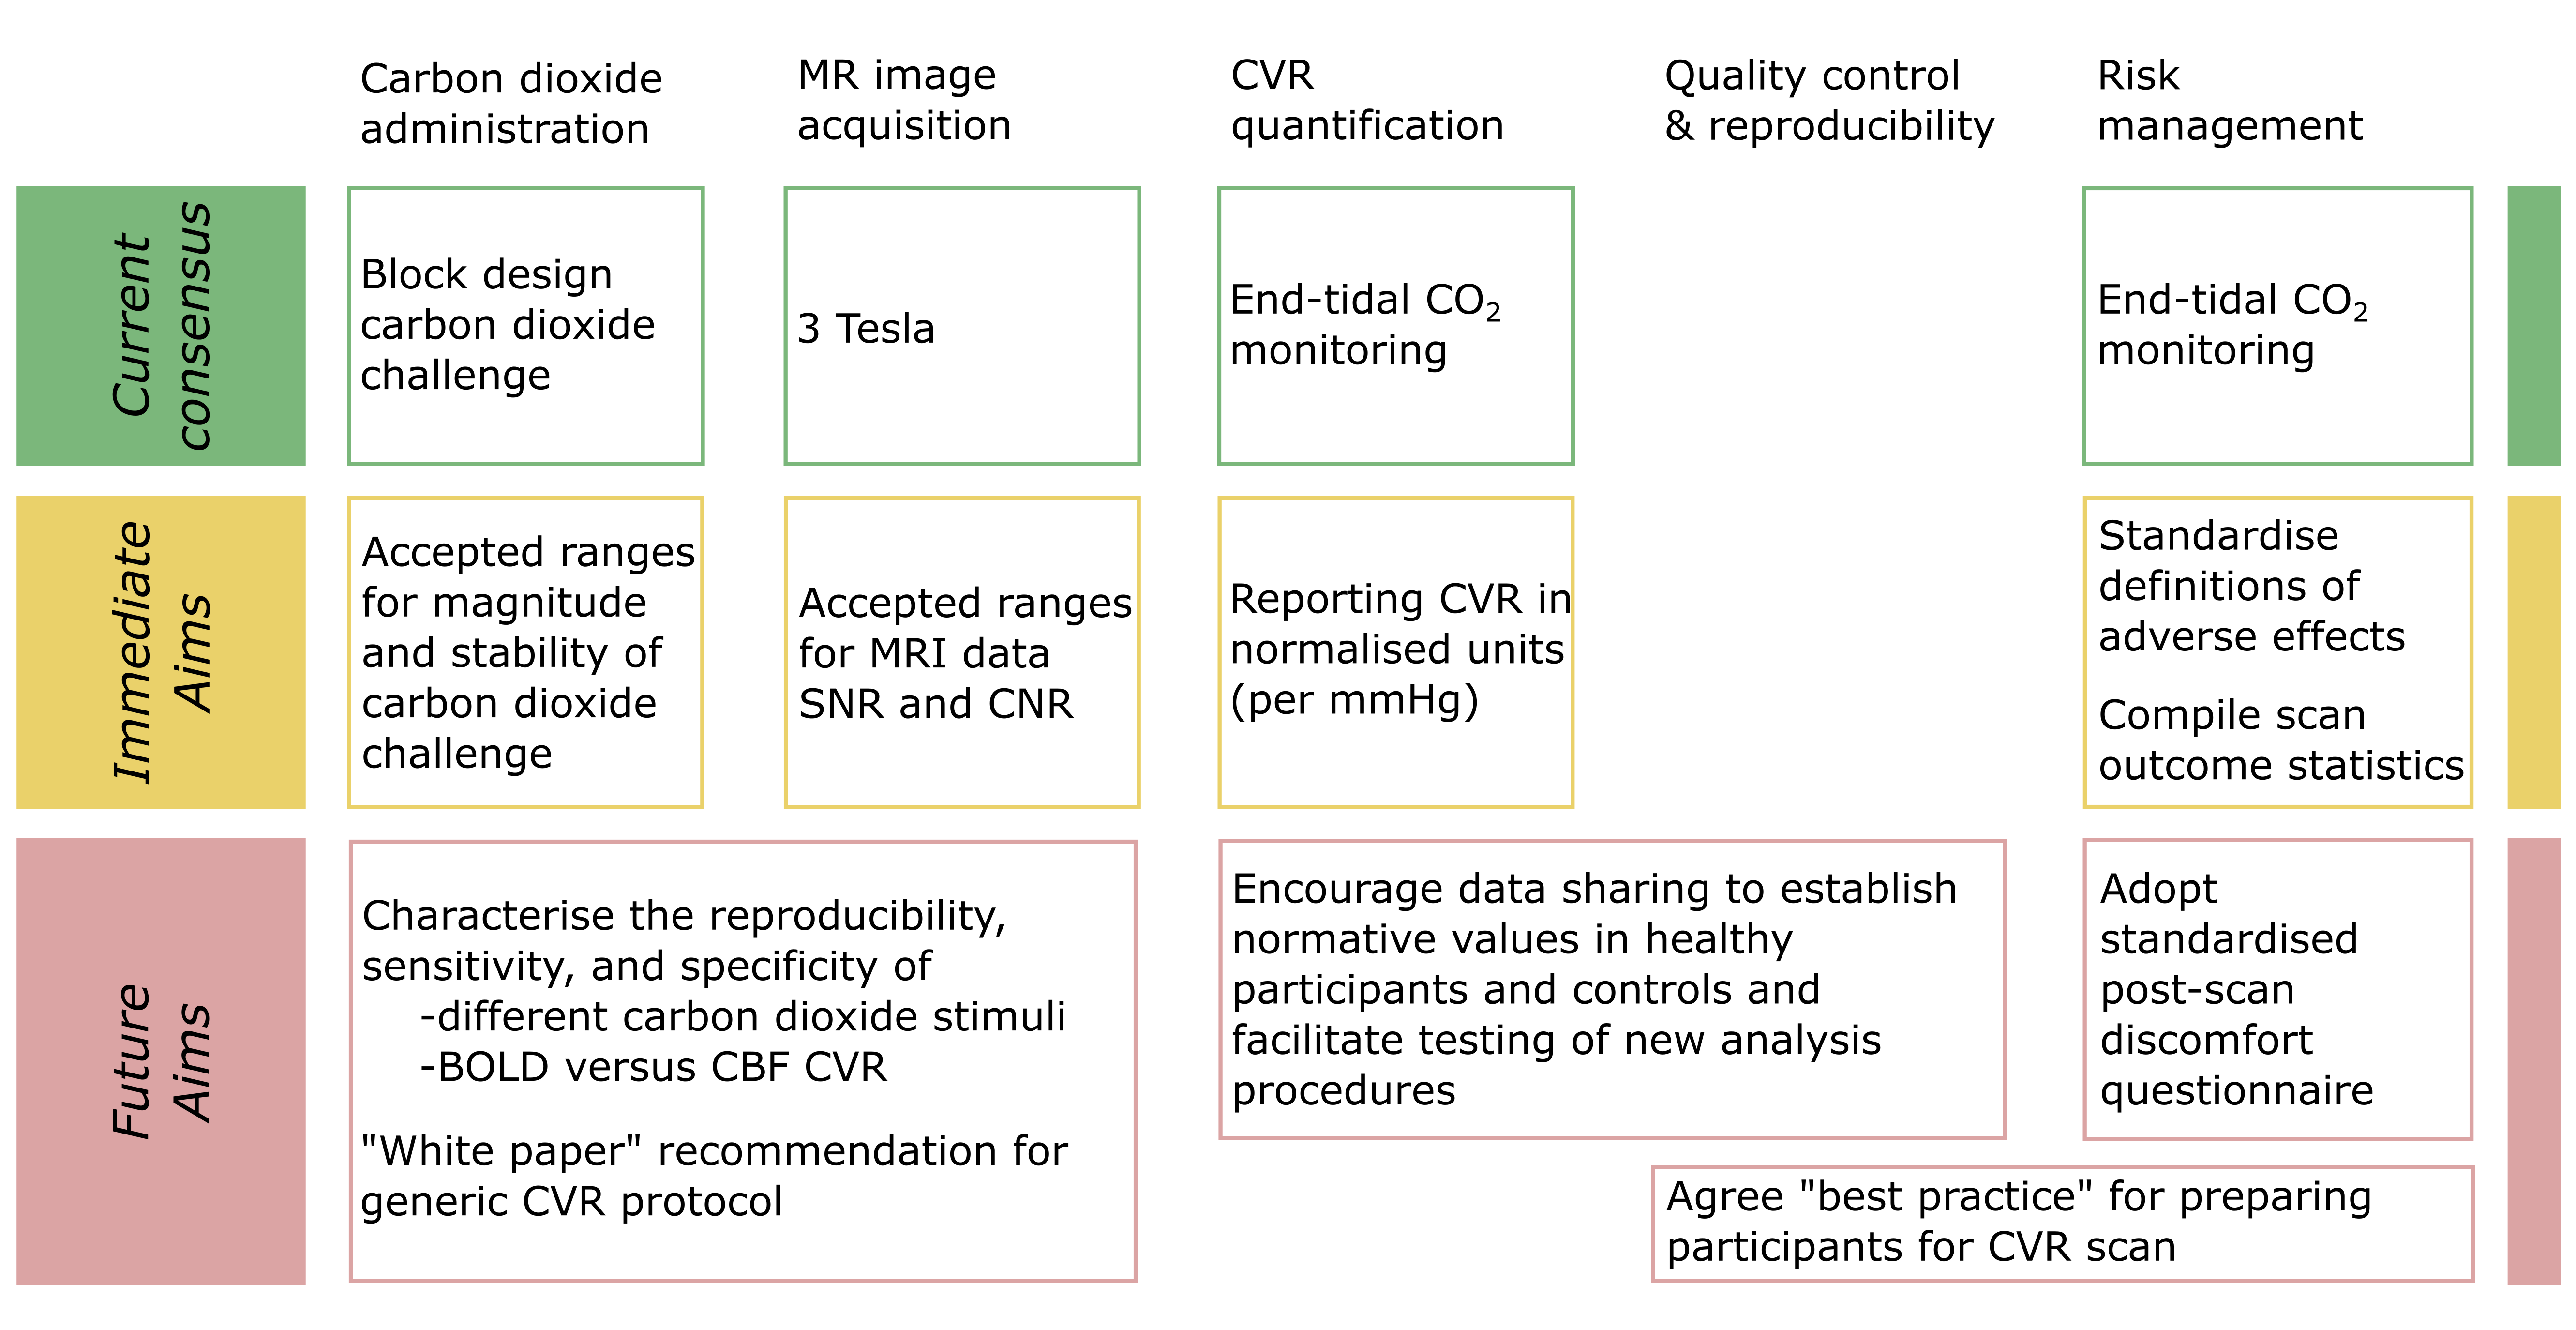
Conclusions
Building upon the responses of the existing CVR community, we have outlined where consensus has already been reached and identified areas where agreement may be achieved in the future (Fig. 2). This framework is a starting point for a larger discussion amongst the community to accelerate the wider clinical adoption of CVR mapping.Acknowledgements
We acknowledge the membership of the Imaging Cerebral Physiology network (http://www.icp-network.org/) for their useful discussions on the topic of CVR and carbon dioxide administration, as well as direct contributions to this abstract.References
1. Spano VR, Mandell DM, Poublanc J, Sam K, Battisti-Charbonney A, Pucci O, Han JS, Crawley AP, Fisher JA, Mikulis DJ. CO2 Blood Oxygen Level-de pendent MR Mapping of Cerebrovascular Reserve in a Clinical Population: Safety, Tolerability, and Technical Feasibility. Radiology 2012;266:592–598. doi: 10.1148/radiol.12112795.
2. Blair GW, Doubal FN, Thrippleton MJ, Marshall I, Wardlaw JM. Magnetic resonance imaging for assessment of cerebrovascular reactivity in cerebral small vessel disease. A systematic review. J. Cereb. Blood Flow Metab. 2016:1–9. doi: 10.1177/0271678X16631756.
3. Moreton FC, Dani KA, Goutcher C, O'Hare K, Muir KW. Respiratory challenge MRI: Practical aspects. Neuroimage Clinical 2016;11:667–677. doi: 10.1016/j.nicl.2016.05.003.
4. Quantitative Imaging Biomarkers Alliance (QIBA). Retrieved from http://qibawiki.rsna.org/index.php/QIBA_Overview
5. Uniform Protocol for Imaging in Clinical Trials (UPICT). Retrieved from http://qibawiki.rsna.org/index.php/UPICT
6. Bhogal AA, Siero JCW, Fisher JA, Froeling M, Luijten P, Philippens M, Hoogduin H. Investigating the non-linearity of the BOLD cerebrovascular reactivity response to targeted hypo/hypercapnia at 7T. Human Brain Mapping Journal 2014;98:296–305. doi: 10.1016/j.neuroimage.2014.05.006.
7. Duffin J, Sobczyk O, Crawley AP, Poublanc J, Mikulis DJ, Fisher JA. The dynamics of cerebrovascular reactivity shown with transfer function analysis. Neuroimage 2015;114:207–216. doi: 10.1016/j.neuroimage.2015.04.029.
8. van der Zande FHR, Hofman PAM, Backes WH. Mapping hypercapnia-induced cerebrovascular reactivity using BOLD MRI. Neuroradiology 2005;47:114–120. doi: 10.1007/s00234-004-1274-3.
9. Yezhuvath US, Lewis-Amezcua K, Varghese R, Xiao G, Lu H. On the assessment of cerebrovascular reactivity using hypercapnia BOLD MRI. NMR Biomed. 2009;22:779–786. doi: 10.1002/nbm.1392.
10. Sobczyk O, Battisti-Charbonney A, Poublanc J, Crawley AP, Sam K, Fierstra J, Mandell DM, Mikulis DJ, Duffin J, Fisher JA. Assessing cerebrovascular reactivity abnormality by comparison to a reference atlas. J. Cereb. Blood Flow Metab. 2015;35:213–220. doi: 10.1038/jcbfm.2014.184.
11. Kassner A, Winter JD, Poublanc J, Mikulis DJ, Crawley AP. Blood-oxygen level dependent MRI measures of cerebrovascular reactivity using a controlled respiratory challenge: Reproducibility and gender differences. J. Magn. Reson. Imaging 2010;31:298–304. doi: 10.1002/jmri.22044.
Figures