1665
Towards self-calibrated functional connectivity mapping1Radiology, Johns Hopkins University School of Medicine, Baltimore, MD, United States, 2Radiology, University of Texas Southwestern Medical Center, Dallas, TX, United States, 3Siemens Healthcare, Baltimore, MD, United States, 4Neurological Surgery, University of Texas Southwestern Medical Center, Dallas, TX, United States
Synopsis
The BOLD signal in functional connectivity MRI(fcMRI) may be affected by non-neural factors, such as vascular function. In this study, we utilized a multiparametric mapping method to measure functional connectivity(FC) maps and cerebrovascular reactivity(CVR) concomitantly, and examined the relationship between these two indices in both healthy volunteers and patients with cerebrovascular disease. Significant correlations were found between FC and CVR across brain regions, suggesting that cerebrovascular function should be accounted for when using BOLD fcMRI to assess brain functions. Concomitant acquisition of neural and vascular MRI may allow calibration/normalization of FC signal and more accurate estimation of brain functional connectivity.
Purpose
The BOLD signal in functional connectivity MRI(fcMRI) is long speculated to be affected by non-neural factors, such as vascular function(1). However, acquisition of additional measures of vascular physiological parameters requires more scan time and the images may be mis-registered, especially in clinical patients. Therefore, it is highly desirable to simultaneously measure neural and vascular parameters, and use vascular measures to calibrate/normalize the functional connectivity(FC) measures. Previously we have shown that functional connectivity map and cerebrovascular reactivity(CVR), a measure of brain’s vascular function, can be obtained simultaneously in the same scan with a multiparametric mapping method(2). In this study, we sought to establish the relationship between these two indices in both healthy volunteers and patients with cerebrovascular disease, to lay a foundation for calibration of FC with the concomitantly measured CVR.Methods
Subjects: We studied a total of 15 subjects, including 9 Moyamoya(MMD) patients(42.9±10.0yrs, 7 females) and 6 healthy volunteers(36.3±17.6 yrs, 3 females). Informed consent was obtained using IRB-approved protocol.
MRI experiments were performed on 3T. The participants received a 9.3min BOLD MRI scan with a gas challenge, consisting of interleaved blocks of inhaling room-air and 5% CO2(2). 1) for MMD patients, TR/TE=1510/21ms, resolution=3.2x3.2x3.2mm3, whole-brain coverage using 36 slices with 1mm gap; 2) for the healthy volunteers, Human Connectome Project(HCP) protocol was used: TR/TE=720/37ms, resolution=2x2x2mm3, whole-brain coverage using 72 slices, Multiband factor=8.
Data analysis: CVR(in %ΔBOLD/mmHg CO2) was obtained from voxel-wise regression between end-tidal CO2 time course and BOLD time courses. The residual time courses after removal of the gas effects underwent functional connectivity analysis. Importantly, since both CVR and FC are obtained from the same data, no co-registration is needed. For MMD patients, seed-based analysis was performed with the seed ROI placed on posterior cingulate(PCC). Regional CVR and FC(Z score calculated from correlation coefficient(cc)) were obtained from four components of the default-mode-network(DMN), including PCC, medial frontal gyrus, left and right angular gyrus. Their regional correlation was studied. For healthy volunteers in whom higher spatial resolution was used, ICA analysis was performed and voxel-wise correlation was examined between CVR and connectivity Z scores.
Results
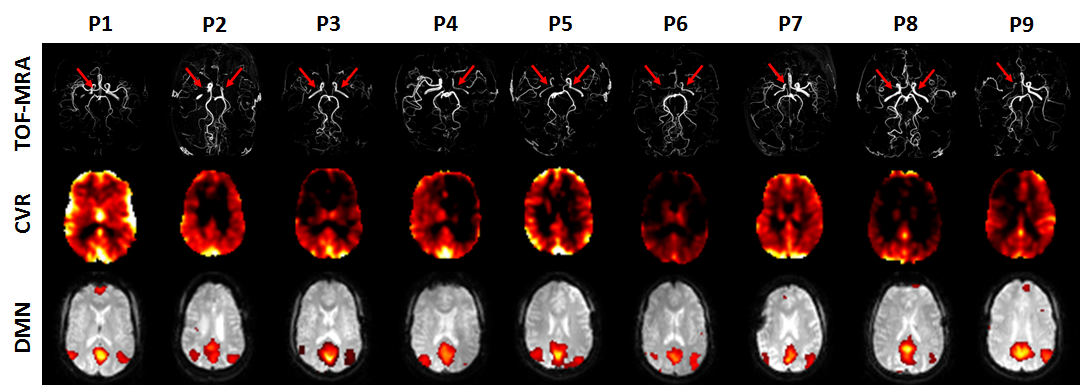
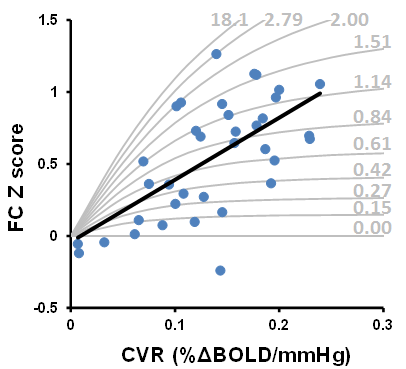
MMD patients: Figure 1 shows CVR and FC maps in all nine patients. Reduced CVR was observed in the disease-affected flow territories, including the territories of anterior cerebral arteries and middle cerebral arteries. In DMN connectivity maps, a few nodes(e.g. medial frontal gyrus, angular gyrus) are missing in some patients and others are small in size, the spatial distribution of which tends to match that of CVR. Regression analysis showed a significant correlation between CVR and FC across all 36 ROIs(4 regions x 9 patients)(p<0.001, Figure 2, gray curves explained later). We also examined the potential CVR-vs-FC relationship on an individual basis. It was generally noted that patients with more severe conditions(as rated on MRA by a board-certified neuroradiologist blind to the CVR and FC data) tend to show a stronger correlation(cc=0.92±0.07, N=4), compared to moderate(cc=0.47±0.56, N=3) and mild(cc=0.18±0.88, N=2) patients. This is probably because severe patients have a larger dynamic range of CVR and FC values.
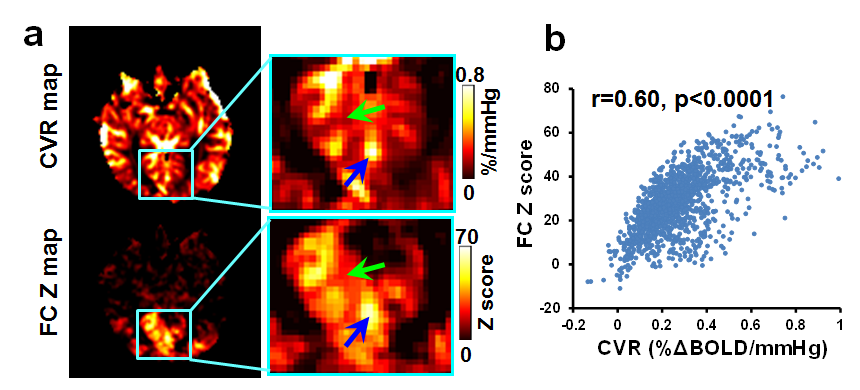
Healthy volunteers: Figure 3a shows representative CVR(top) and visual-FC(bottom) maps. Because a high-resolution imaging protocol(2x2x2 mm3) was used, spatial heterogeneity among sulci and gyri can be better appreciated, which revealed a strong similarity in local patterns between CVR and FC. Voxel-wise spatial correlation in local ROIs was 0.51±0.15(Figure 3). Voxels that have higher CVR also showed higher FC.
Calibration using CVR and FC data: One can use numerical simulations to generate a series of “iso-connectivity” curve in which FC is plotted as a function of CVR, for a given neural connectivity strength. The idea is that, for a given neural connectivity strength, higher CVR would result in higher apparent FC (i.e. higher Z-score and cc value). FC values in different regions and patients can then be compared in the context of CVR. The gray curves in Figure 2 showed several iso-connectivity curves.
Discussion & Conclusion
FC measured with resting-state fMRI is increasingly used in diagnosis and mechanistic studies of brain diseases. Our results suggested that vascular function can influence functional connectivity measures, presumably via neurovascular coupling. Therefore, cautions should be taken when using resting-state functional connectivity to evaluate brain functions, especially in patients whose cerebrovascular functions are compromised(e.g. vascular disease, tumor, TBI, and aging). Even in healthy subjects, vascular function may also play a role in quantitative interpretation of FC results, especially as fcMRI data are increasingly collected at higher spatial resolution. A concomitant acquisition of neural and vascular MRI may allow calibration/normalization of FC signal and more accurate estimation of brain functional connectivity.Acknowledgements
No acknowledgement found.References
1. Liu TT. Neurovascular factors in resting-state functional MRI. Neuroimage 2013; 80: 339-48.
2. Liu P, Welch BG, Li Y, Gu H, King D, Yang Y, Pinho M, Lu H. Multiparametric imaging of brain hemodynamics and function using gas-inhalation MRI. NeuroImage 2016: doi: 10.1016/j.neuroimage.
3. Fox MD, Greicius M. Clinical applications of resting state functional connectivity. Front Syst Neurosci 2010;19.
Figures