1664
Rapid cerebrovascular reactivity mapping: Comparison of a sinusoid protocol with the conventional block protocol1FMRIB Centre, Nuffield Department of Clinical Neurosciences, University of Oxford, Oxford, United Kingdom, 2Department of Physics, University of Oxford, Oxford, United Kingdom, 3Institute of Biomedical Engineering, University of Oxford, Oxford, United Kingdom
Synopsis
Cerebrovascular reactivity (CVR) mapping is a useful technique for stress testing the brain. However, clinical adoption of CVR mapping has so far been hindered by relatively long scan durations of 7-12mins. In this study we show that by using a sinusoidal carbon dioxide stimulus in place of a conventional block protocol, equivalent CVR maps can be produced in a much shorter scan duration of 3-5mins.
Purpose
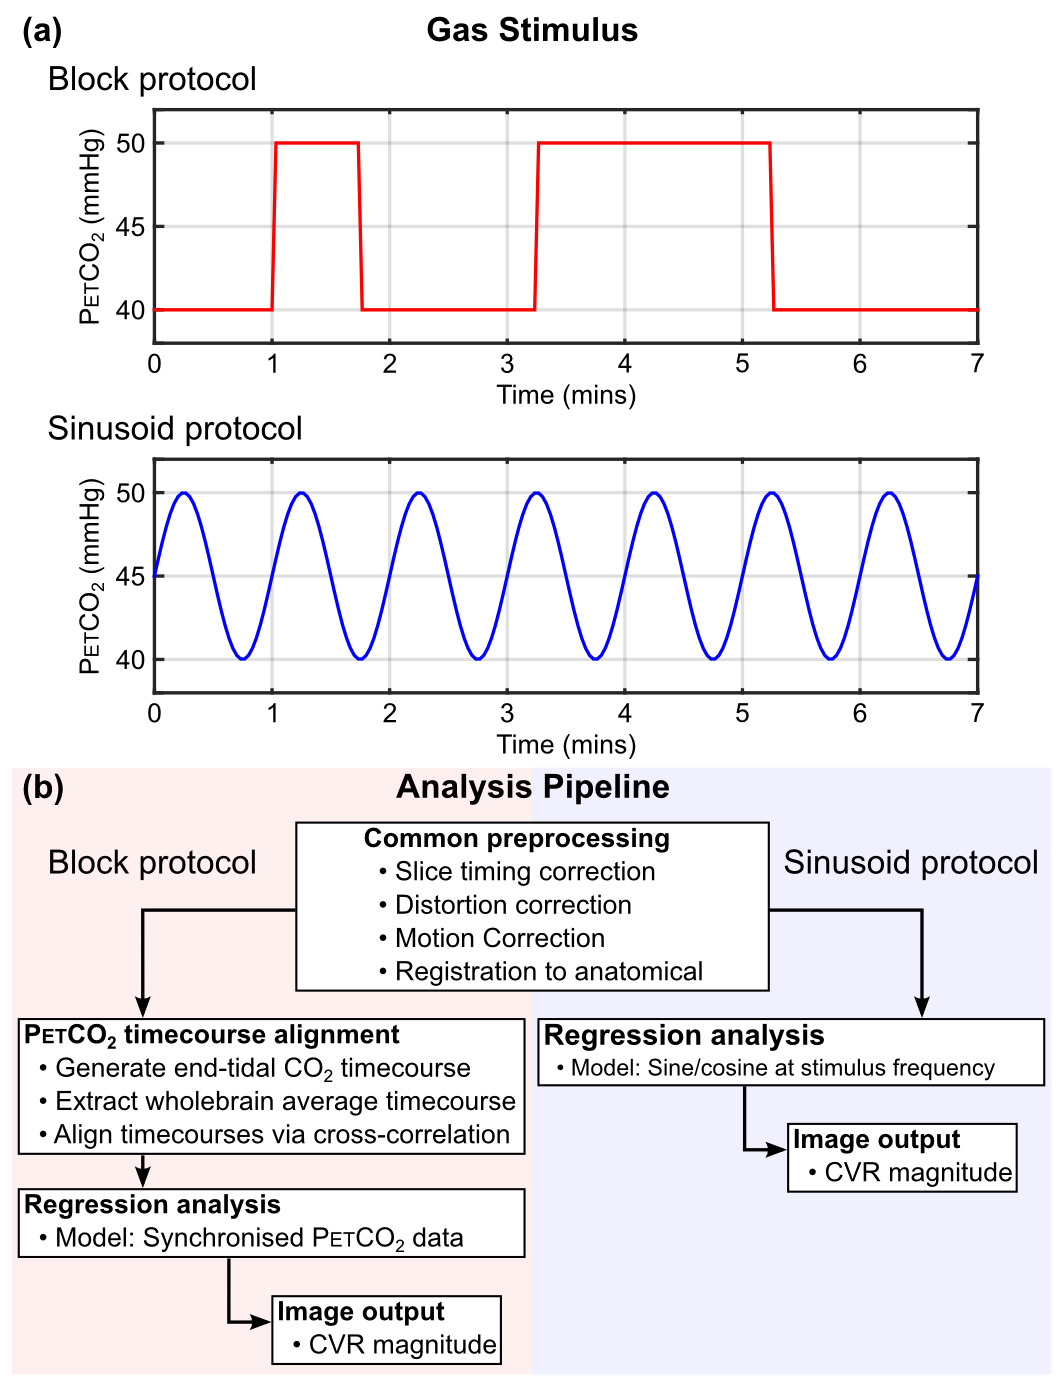
Cerebrovascular reactivity (CVR) mapping is a useful technique for stress testing the brain. In contrast to the majority of MRI techniques that are acquired whilst the brain is at rest, CVR mapping provides information about the capacity of the vasculature to respond to increases in demand. However, clinical adoption of CVR mapping has so far been hindered by relatively long scan durations. In this study we aim to address this limitation by bringing the scan duration down from the typical 7-12mins to a more clinically practical 3-5mins. To achieve this, we propose replacing the conventional block carbon dioxide (CO2) stimulus1 with a sinusoidally modulated protocol2. This stimulus is robust to regional vascular delays, enabling shorter stimulus cycles. In this work we compare the conventional block protocol with a sinusoid protocol of equal duration. Furthermore, we retrospectively reanalyse the sinusoid data with fewer stimulus cycles to assess the effect of a shortened scan duration on CVR maps.Methods
Imaging was performed on a Siemens Prisma 3T scanner with the approval of the local ethics committee. Ten healthy volunteers (age range 19 – 21, 5 female) were recruited and informed written consent obtained. Functional imaging consisted of BOLD-weighted EPI images with the following pulse sequence parameters: TR 2s, TE 30ms, FOV 220mm × 220mm, matrix 64×64, slices 24, slice thickness 5mm, slice gap 0.5mm, GRAPPA 2, flip angle 80°. A total of 7mins of data were acquired for each stimulus protocol. CO2 stimuli (Fig. 1a) were generated by a computer controlled gas blender using a prospective algorithm3 for targeting end-tidal CO2 (PETCO2) (RespirAct Gen 3). The block protocol1 consisted of two periods of elevated CO2 for 45s and 120s preceded by baselines of 60s and 90s, respectively. The sinusoid protocol consisted of seven sinusoidal cycles with a time period of 60s. Both protocols were targeted to increase PETCO2 by 10mmHg above baseline. Analysis was performed using FSL tools4 including standard preprocessing steps and linear regression (Fig. 1b). The block protocol was modelled using the recorded PETCO2 trace temporally aligned to the whole brain BOLD timecourse. The sinusoid protocol was modelled by sine and cosine terms with 60s time periods. For the block protocol CVR was calculated from the GLM parameter estimate for the PETCO2 regressor and for the sinusoid by calculating the sum of squares of the sine/cosine parameter estimates. CVR estimates were normalised by the measured PETCO2 change to give units of %BOLD/mmHg.
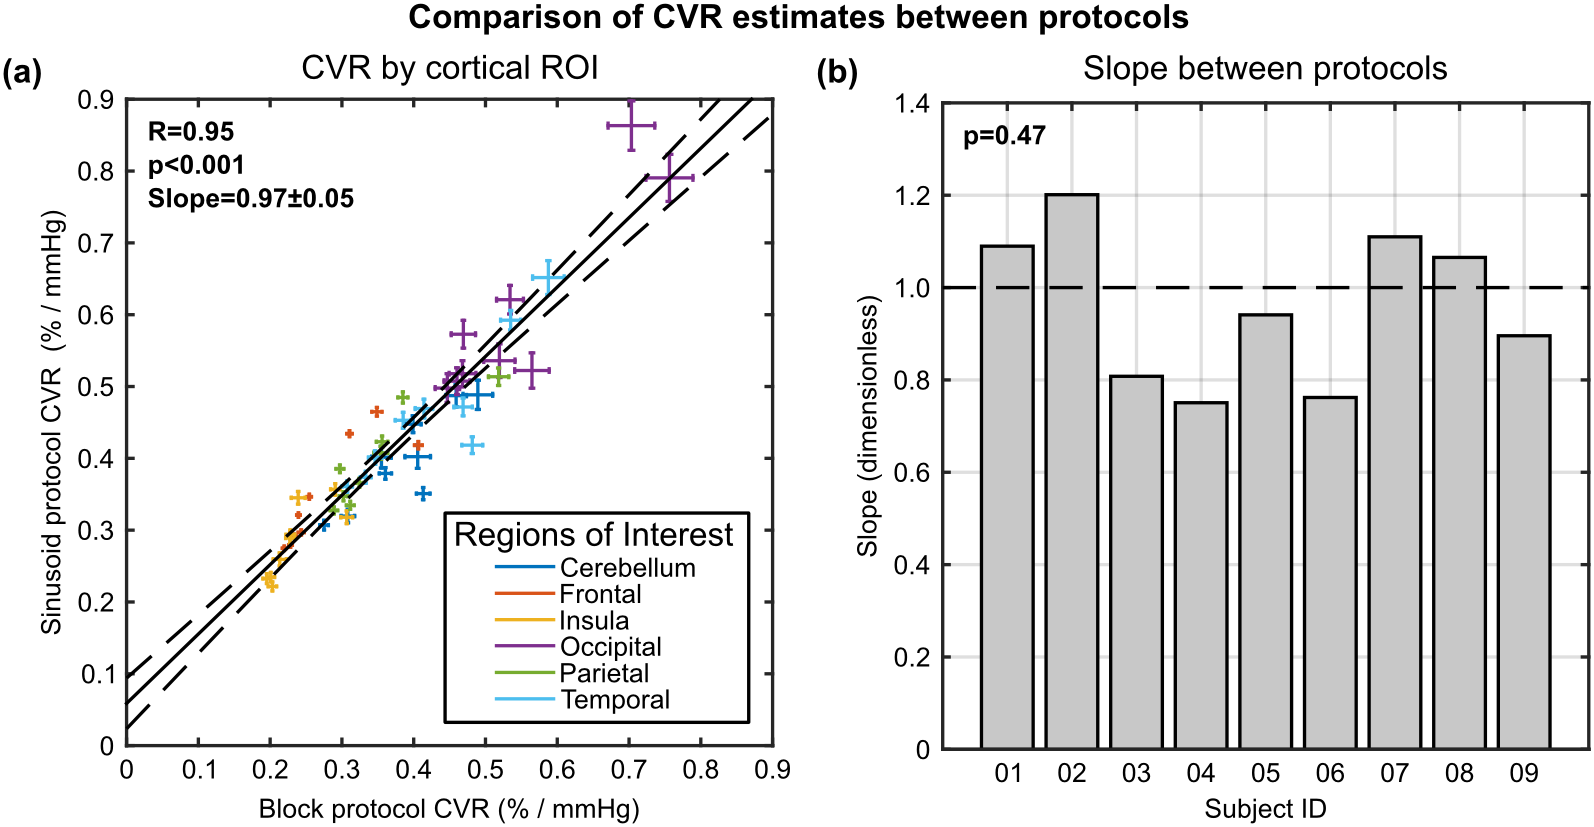
The equivalence of these protocols was investigated by calculating the mean CVR from six cortical lobe ROIs (MNI structural atlas refined using a grey matter mask). The equivalence of the two protocols was assessed by fitting a simple model: linear slope and intercept.
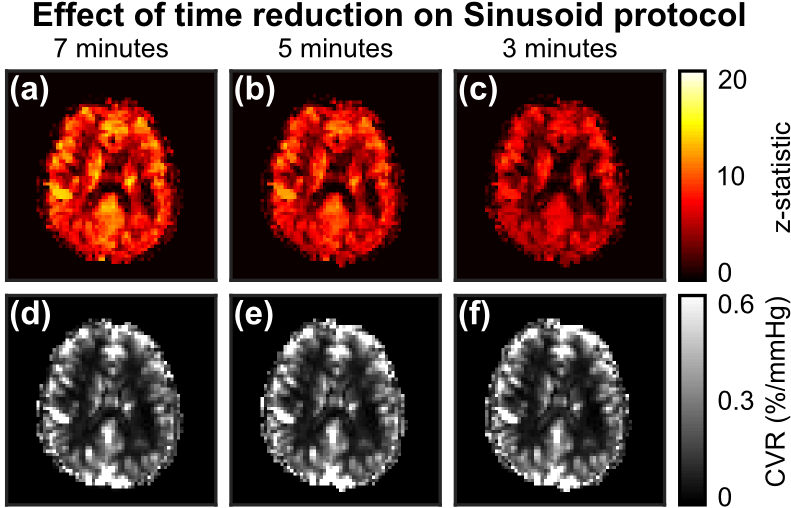
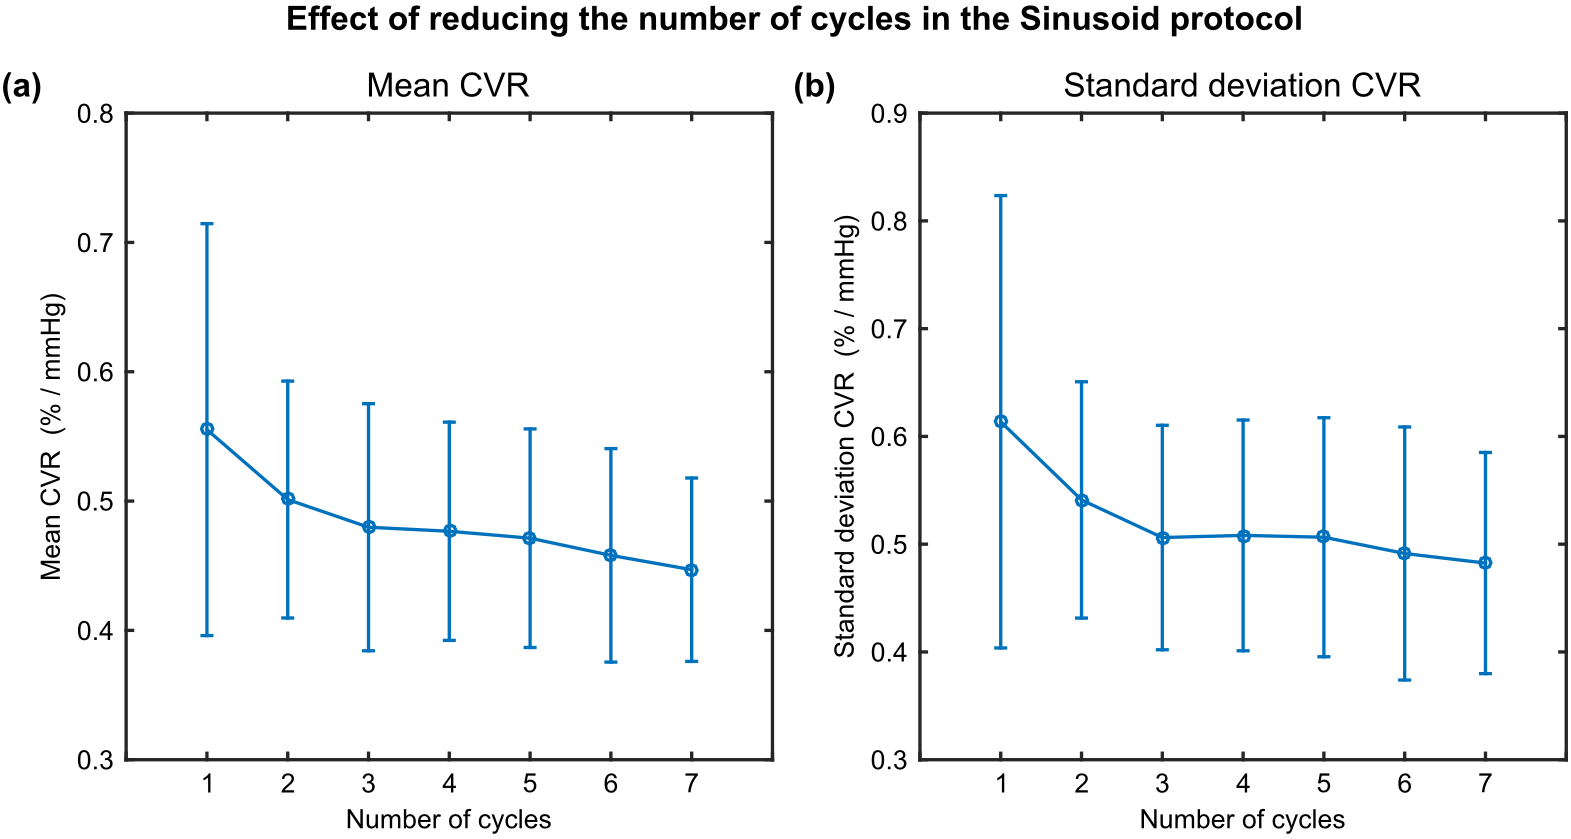
The effect of shortening scan duration was investigated by truncating the sinusoid data set at between 1min and 6mins. A common ROI was defined (statistically significant voxels from the block paradigm refined by a grey matter mask) and used to calculate the mean and standard deviation of the CVR as a function of scan duration. A two-way ANOVA test was used to test whether all group averages were equal. On rejecting the null hypothesis, pairwise comparison was performed to consider which pairs were significantly different.
Results and Discussion
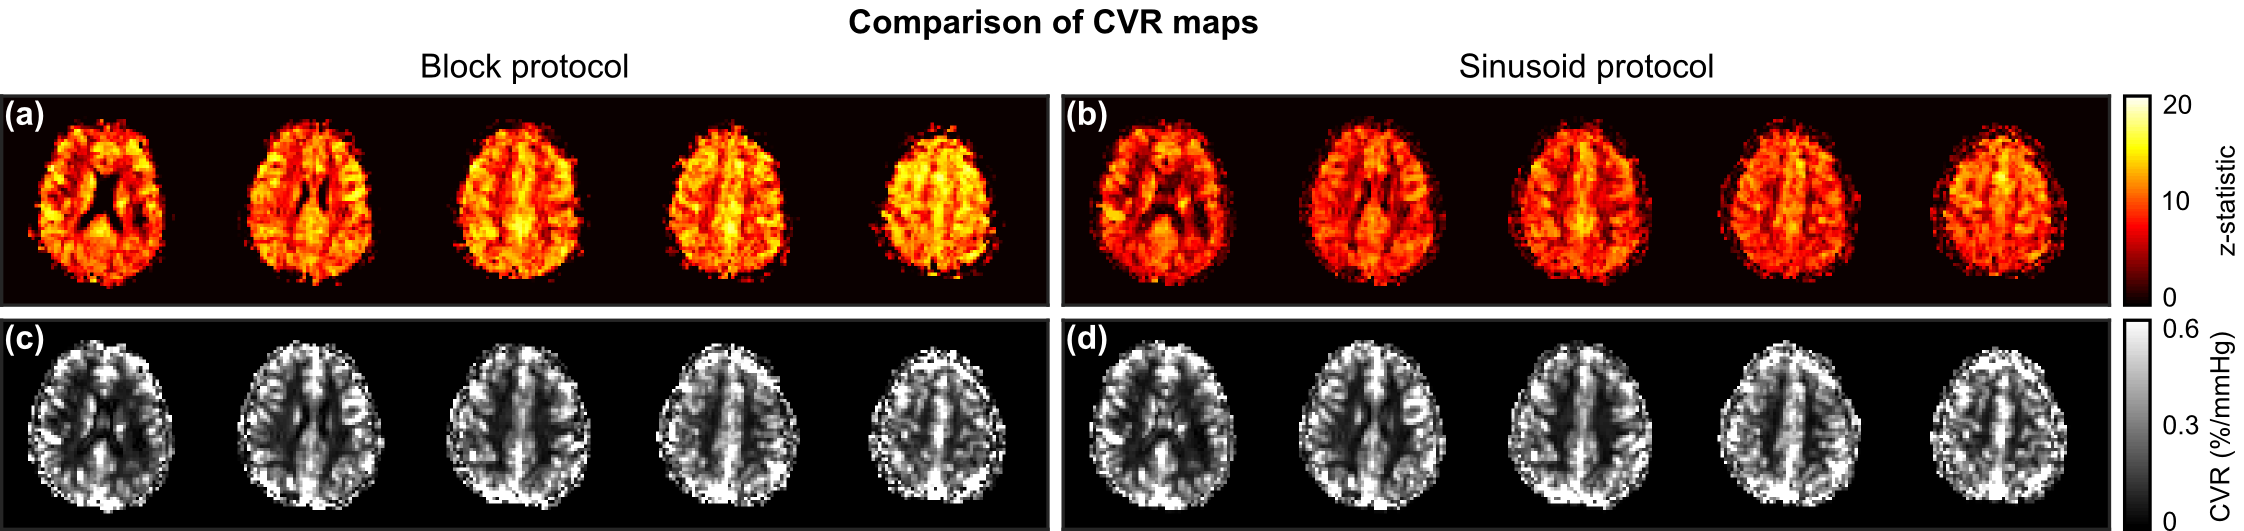
One subject was excluded due to motion. Fig. 2 displays example maps for both protocols. Z-statistic values are reduced for the sinusoid protocol, but CVR maps are qualitatively similar. Fig. 3a plots cortical ROI estimates of CVR from both methods, which are significantly correlated (p<0.001). Fig. 3b shows per subject estimates of the slope, which are found to be insignificantly different to unity (p=0.47). Fig. 4 displays examples of the effect of scan duration. Z-statistics are reduced with scan duration, as expected, although CVR maps appear qualitatively similar. This is further explored across all subjects in Fig. 5. The group average of the mean CVR across the ROI (Fig. 5a) was seen to increase slightly with reduced scan time. Not all group averages were equal (p<0.001), but paired analysis showed that only the 1min duration was significantly different (p<0.001) to the full data set. A similar increase was observed for the group average standard deviation of CVR across the ROI (Fig. 5b). Again group averages were not all equal (p<0.001) and only the 1min duration was significantly different (p<0.001) to the full data set.Conclusions
Equivalent CVR maps to conventional block CO2 stimuli can be generated with much shorter scan duration by using a sinusoidal CO2 stimulus. Scan durations of 3-5 mins are achievable and should enable more widespread clinical application.Acknowledgements
This work was funded by EPSRC grant EP/K025716/1.References
1. Spano VR, Mandell DM, Poublanc J, Sam K, Battisti-Charbonney A, Pucci O, Han JS, Crawley AP, Fisher JA, Mikulis DJ. CO2 Blood Oxygen Level-dependent MR Mapping of Cerebrovascular Reserve in a Clinical Population: Safety, Tolerability, and Technical Feasibility. Radiology 2012;266:592–598. doi: 10.1148/radiol.12112795.
2. Blockley NP, Driver ID, Francis ST, Fisher JA, Gowland PA. An improved method for acquiring cerebrovascular reactivity maps. Magn. Reson. Med. 2010;65:1278–1286. doi: 10.1002/mrm.22719.
3. Slessarev M, Han J, Mardimae A, Prisman E, Preiss D, Volgyesi G, Ansel C, Duffin J, Fisher JA. Prospective targeting and control of end-tidal CO2 and O2 concentrations. The Journal of Physiology 2007;581:1207–1219. doi: 10.1113/jphysiol.2007.129395.
4. Jenkinson M, Beckmann CF, Behrens TEJ, Woolrich MW, Smith SM. FSL. Neuroimage 2012;62:782–790. doi: 10.1016/j.neuroimage.2011.09.015.
Figures