1660
Estimation of cerebral metabolic rate of oxygen from measured hemodynamic response function and cerebral blood flow using arterial spin labeling1Neuroscience, Baylor College of Medicine, Houston, TX, United States
Synopsis
In the brain, brief neural activity creates changes in local blood flow (CBF) and oxygen uptake (CMRO2). Functional magnetic resonance imaging (fMRI) can measure these changes as a blood oxygenation level dependent (BOLD) signal. The BOLD response to brief stimulations is often termed the hemodynamic response function (HRF). We recently proposed the Arterial Impulse model for the HRF based on a combination of underdamped CBF and CMRO2 responses. Here, we used arterial spin-labeling (ASL) to measure both the BOLD HRF and CBF, and then used our model to obtain estimates of the CMRO2 time course.
Purpose
Brief neural activation creates a hemodynamic response function (HRF), a stereotypic manifestation of neurovascular coupling. Functional magnetic resonance imaging (fMRI) can measure this neurovascular coupling as a blood oxygen level dependent (BOLD) signal. Simplified theoretical models have been developed over the past decade to relate the BOLD HRF to the underlying physiological responses of cerebral blood flow (CBF) and cerebral metabolic rate of oxygen (CMRO2). Most studies have been based on models that postulate non-linear venous inflation, (e.g., Balloon model1, and Davis’ model2), but, recent experiments show s negligible venous volume effect for the HRF3. In fact, prompt arterial dilation is observed to compensate oxygen demand. Based on the arterial dynamics in the absence of venous volume effects, we developed the Arterial Impulse Model (AIM), which accurately predicts both tissue oxygen changes, and the BOLD HRF4. Here, we used arterial spin labeling (ASL) to simultaneously measure both HRF and CBF responses in human cortical tissue with high spatiotemporal resolution, and then used the AIM to estimate the CMRO2 response for a given HRF.Methods
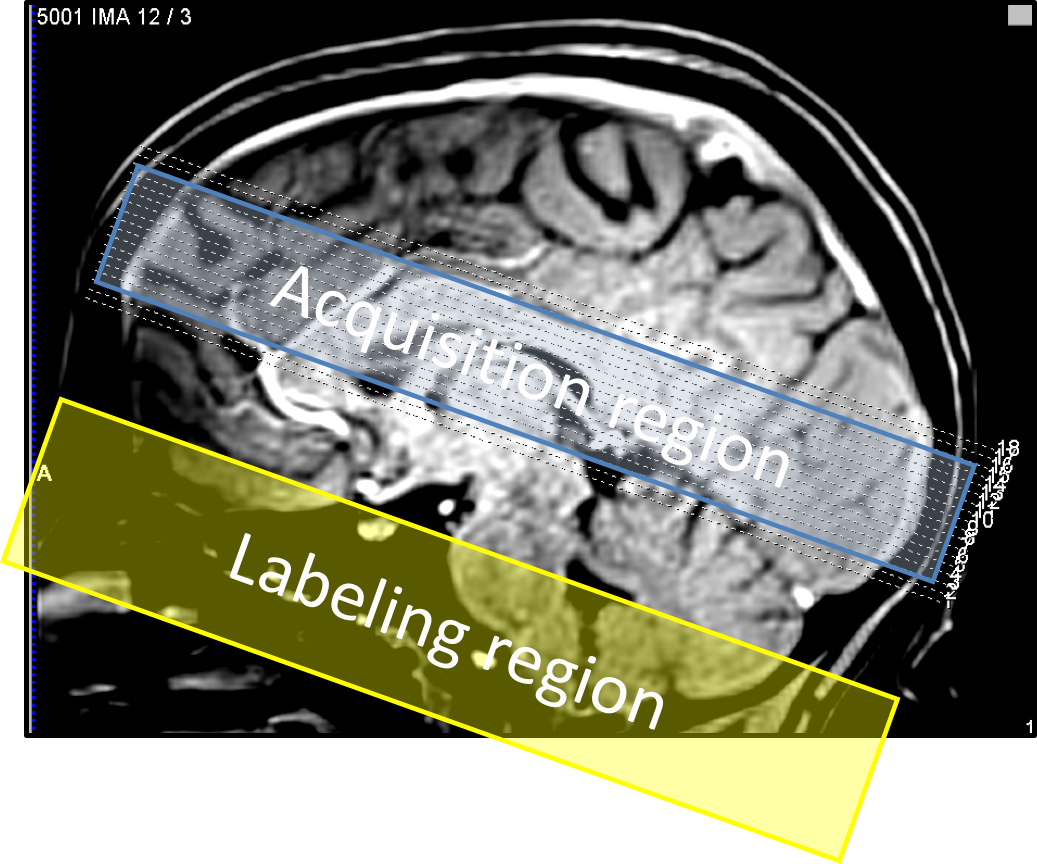
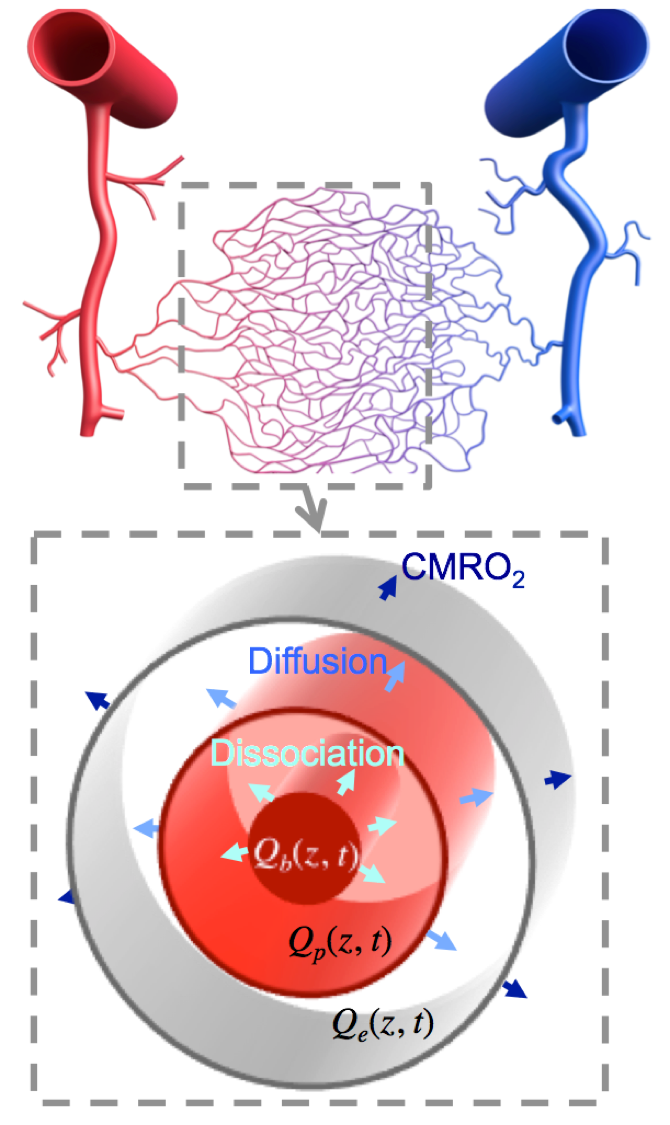
Subjects (N=4) viewed briefly presented (667 ms) circular regions of flickering colored dots presented together with band-pass filtered white noise. Three of these stimuli were displayed sequentially at randomly selected locations upon the screen: left, center, or right. The color, sound tone, and location were linked: yellow (middle tone) on left; green (high tone) in center; and red (low tone) on right. Subjects were instructed to push one of three button corresponding to the location of the circle presenting. A 28-s inter-stimulus interval followed to allow the HRF to evolve and subside. Acquisition used a pulsed ASL sequence (PICORE/QUIPPSII design). Choice of relatively short labeling delays (TI1/TI2 = 600/1250 ms), GRAPPA = 2 acceleration, and TE = 32 ms enabled TR = 2.5 s on 18 quasi-axial slices (Fig. 1) provided 5-s interleaved flow/BOLD sampling with excellent SNR. A 1-cm/s flow-spoiling gradient reduced large vessel contributions. To obtain 1.25-s temporal sampling, we used 4:1 stimulus jittering. Each session produced 80 HRF and CBF measurements that were transformed into high-resolution (0.7 mm) MP-RAGE image volumes obtained in separate sessions for each subject. The AIM treats the vascular tree as a single “cylindrical unit” consisting three radial compartments: erythrocyte, plasma, and extravascular (Fig. 2). We used the measured BOLD HRF and CBF as inputs in our model to estimate the CMRO2 time course assuming a gamma-function temporal form. Although our stimulus and task evoked responses broadly across cortex, we performed our measurements in early visual cortical regions-of-interest (ROIs) V1—3, which were obtained in each subject in separate sessions using retinotopic mapping methods5.Results
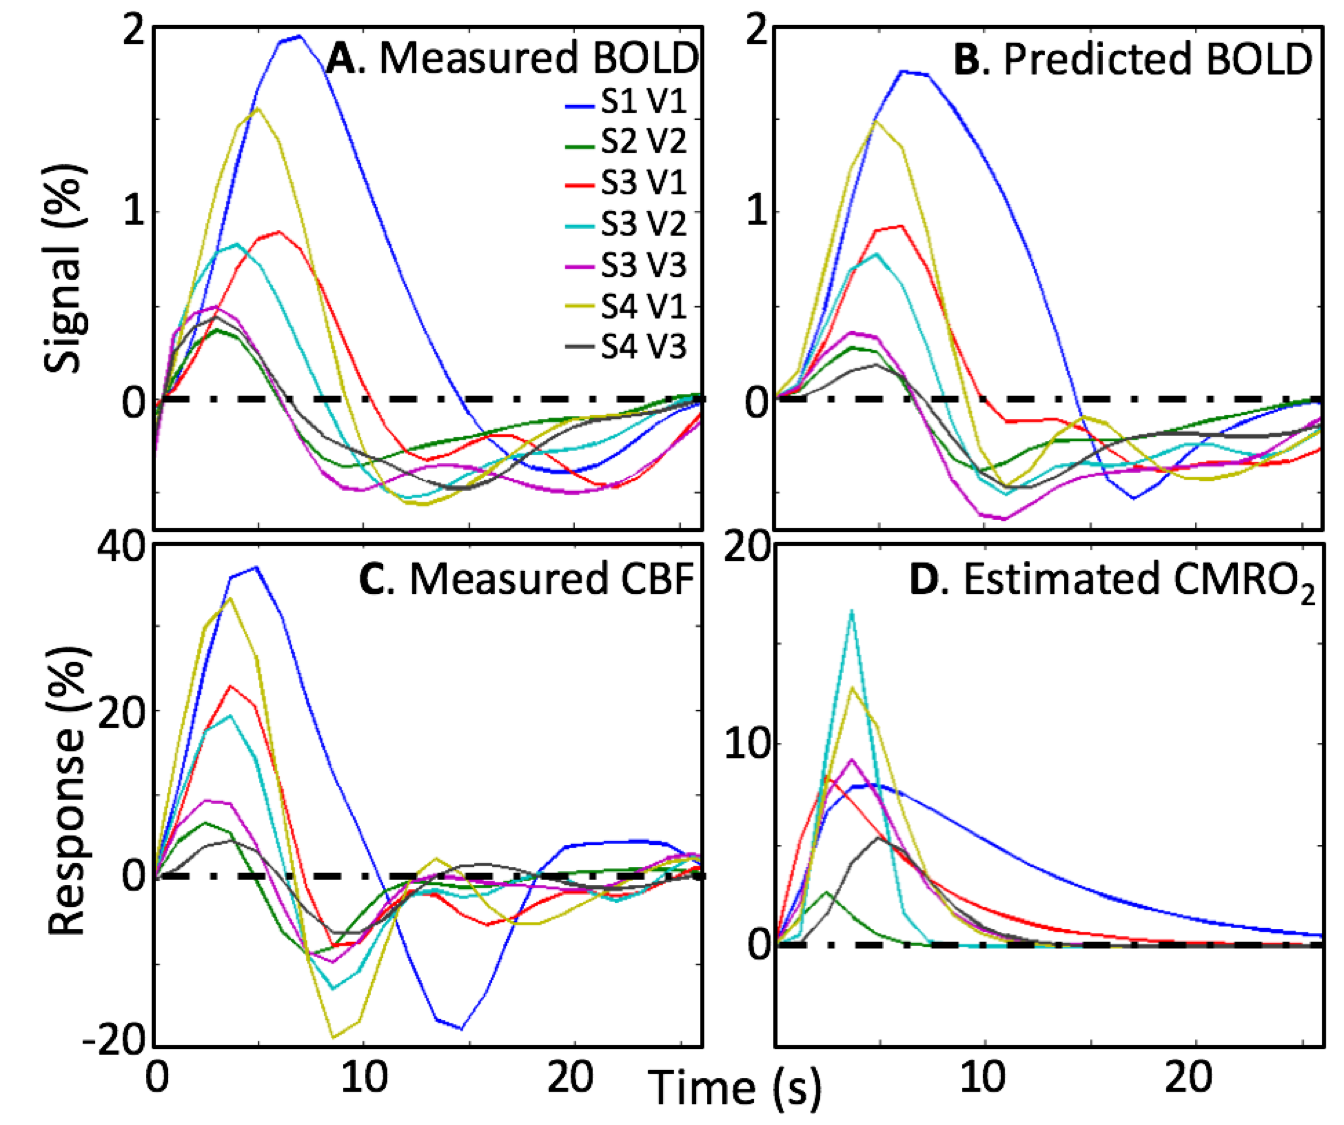
All subjects performed the task well, with mean accuracy of 82%. Our stimulus sequence did not accurately obtain the baseline flow level. So, in one session, we recorded a baseline flow averaged over a V1—3 ROI as 61-ml/100 g/min using the same ASL parameters, and used that value to normalize the measurements. Because the baseline was uncertain, we allowed a scale factor on the flow measurements as a fourth parameter. Simultaneous low-noise measurements of the BOLD HRF are also obtained (Fig. 3A). The stronger HRFs show a delay between the CBF and BOLD HRF peaks, which our model predicts as the consequence of flow propagation. The measured HRFs are very well fit (R2 > 0.72) by using the AIM with the measured CBF (Fig. 3B). All subjects show a significant flow undershoot, and some show a more complex oscillatory return to baseline (Fig. 3C). Flow response peaks 2—4 s earlier than the BOLD HRF. Estimated CMRO2 time series (Fig. 3D) show similar time-to-peak across subjects. CMRO2 response rise promptly, but some measurements show a slow return to baseline.Discussion
The flow induced by brief stimulation has a strong undershoot and late time behavior consistent with underdamped oscillation. HRF responses are substantially delayed from the CBF response, consistent with flow propagation into the downstream venous microvasculature that dominates BOLD contrast. The estimated CMRO2 time course suggests that metabolism usually returns to baseline fairly rapidly, but metabolism can sometimes persist long after the activation.Conclusions
We successfully measured both BOLD HRF and CBF with high spatiotemporal resolution. The AIM enabled estimation of the dynamics of CMRO2 corresponding to the measured HRF and CBF without the need for a complex calibration procedure requiring carbon-dioxide inhalation6.Acknowledgements
Work supported by NIH NS R01 NS095933. HL R21 26167539, and NSF BCS 1063774.References
1. Buxton RB, Wong EC, Frank LR. Dynamics of blood flow and oxygenation changes during brain activation: The balloon model. Magnetic Resonance in Medicine 1998;39(6):855-864.
2. Davis TL, Kwong KK, Weisskoff RM, Rosen BR. Calibrated functional MRI: mapping the dynamics of oxidative metabolism. Proceedings of the National Academy of Sciences 1998;95(4):1834-1839.
3. Fernandez-Klett F, Offenhauser N, Dirnagl U, Priller J, Lindauer U. Pericytes in capillaries are contractile in vivo, but arterioles mediate functional hyperemia in the mouse brain. Proceedings of the National Academy of Sciences of the United States of America 2010;107(51):22290-22295.
4. Kim JH, Ress D. Arterial impulse model for the BOLD response to brief neural activation. NeuroImage 2016;124:394-408.
5. Greene CA, Dumoulin SO, Harvey BM, Ress D. Measurement of population receptive fields in human early visual cortex using back-projection tomography. Journal of vision 2014;14(1):17-17.
6. Buxton RB, Griffeth VE, Simon AB, Moradi F. Variability of the coupling of blood flow and oxygen metabolism responses in the brain: a problem for interpreting BOLD studies but potentially a new window on the underlying neural activity. Frontiers in Neuroscience 2014;8.
Figures