1659
Measurement of cerebral venous blood oxygen saturation via T2* fitting with velocity encoded phase imaging1CUBRIC, Cardiff University, Cardiff, United Kingdom
Synopsis
Measurements of cerebral venous O2 saturation with MRI would enable use to estimate brain O2 consumption, a marker of brain activity. Here we propose a new method with this aim, that exploits a Fourier velocity encoding scheme combined with multi-echo acquisitions for estimating 𝑇2* and then, through calibration curves, O2 saturation. Synthetic data are analysed and pilot data from resting state and visual stimulus acquisitions (two subjects) are reported. The new method is shown to supply plausible estimates of baseline levels and changes in O2 saturation in the sagittal sinus following stimulation.
Introduction
Energy release in the human brain is largely oxidative. Therefore, accurate estimates of venous O2 saturation (SvO2) are important for quantifying O2 consumption, a biomarker of the (patho)physiological state of the brain 1. Several MRI approaches have been proposed in the past with this aim, some of which (2,3) exploit velocity selective RF pulses and multi-echo acquisitions for estimating blood 𝑇2 and then SvO2 from calibration curves. Based on a similar principle, we propose a new method for quantifying SvO2 exploiting a novel approach for isolating the signal from blood vessels. A series of pulsed field gradients (PFGs) is used to encode the blood flow velocity information in the phase of the MR signal, allowing the calculation of velocity spectra. From the decay of these spectra, over multiple echoes, values of 𝑇2* (and therefore O2 saturation) can be estimated over a tissue velocity range of interest, in our case selected to represent larger veins (SvO2).Aim
We explore the feasibility of a newly proposed method for estimating SvO2 by designing a simulation model and then estimating SvO2 from pilot data acquisitions.Methods
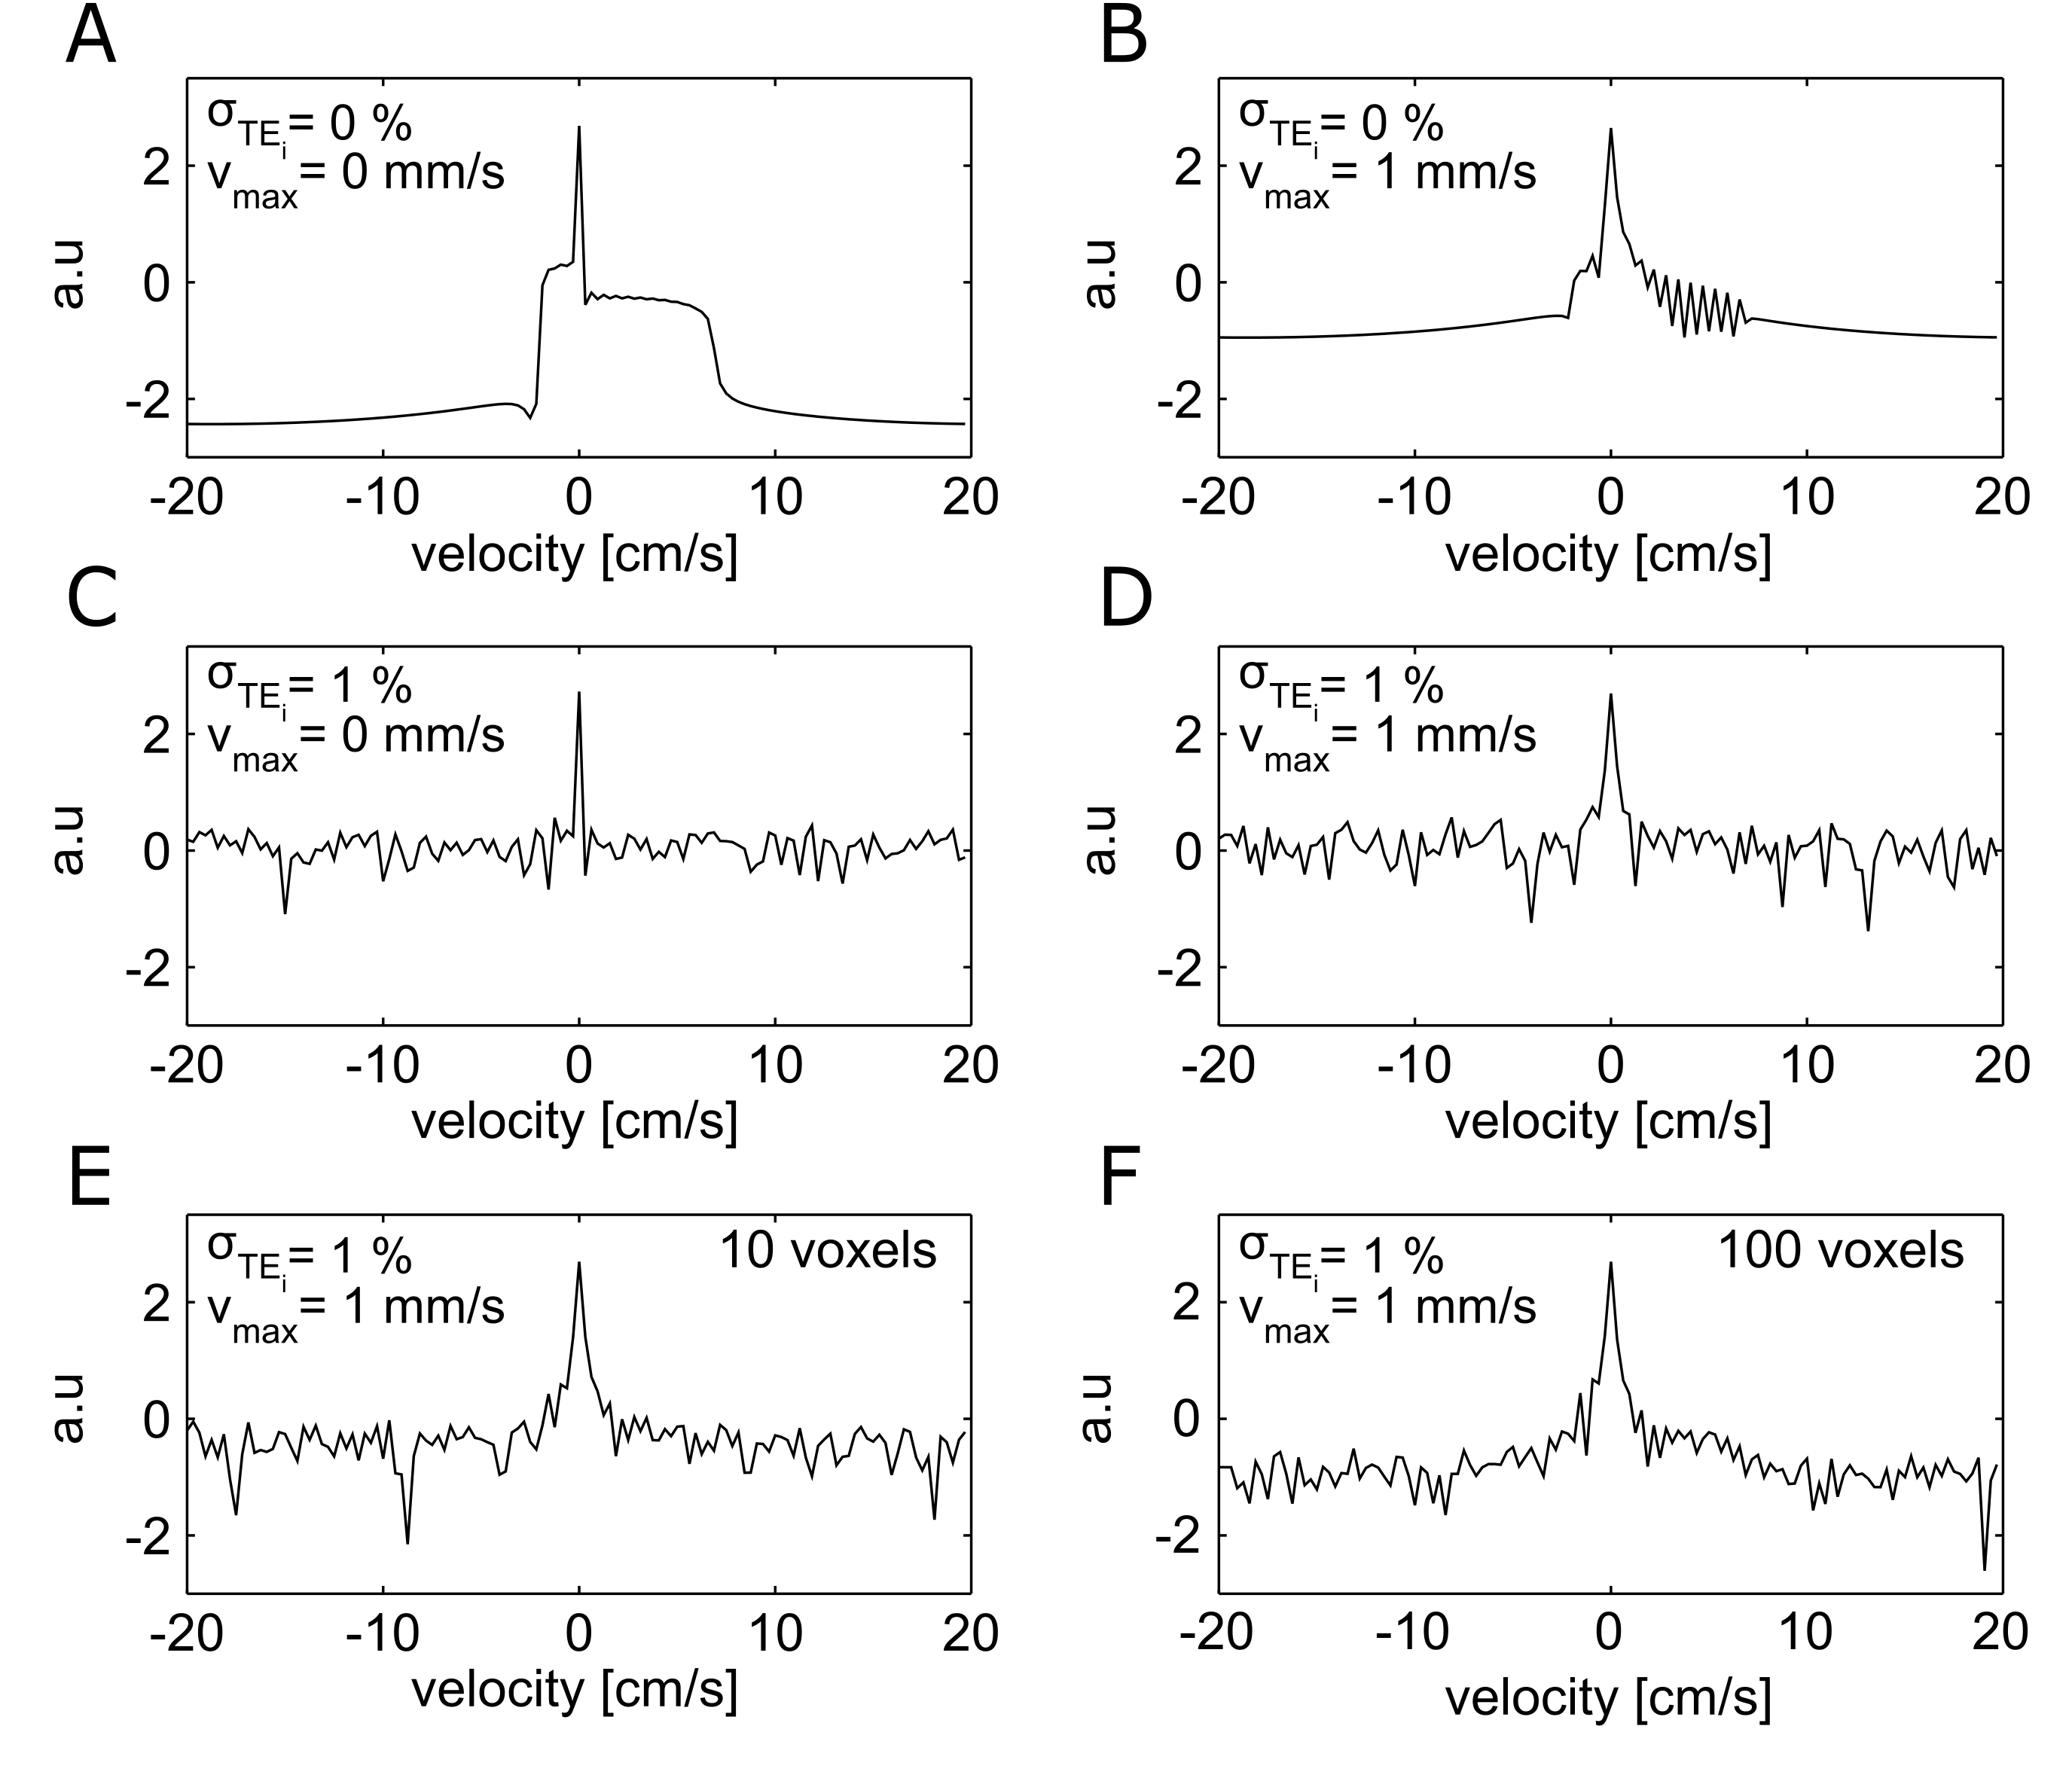
Simulation: Synthetic signals were generated based on the time evolution of a gradient echo (GRE) signal, modelled as the sum of three voxel compartments (arteries, veins and static tissue) weighted by their relative volume. The contribution of moving blood was then accounted for sampling the q-space in 128 bins via PFGs of linearly varying magnitude G (δ = 9 ms, D = 13.4 ms, range -31.2 to 30.7 mT/m, resolution = 0.487 mT/m), corresponding to a velocity spectrum from -20 to 19.7 cm/s (resol. = 0.31 cm/s). Multi GRE sampling was modelled at TE = 11, 20, 29, 38, 47 and 56 ms. Finally the noise was added as thermal (both dependent and independent from TE, as per 4) and due to hypothesized motion (e.g. brain pulsations) of the nominally static tissue compartment, regulated by parameter σTEi and parameter vmax respectively (see schematic in Fig. 1).
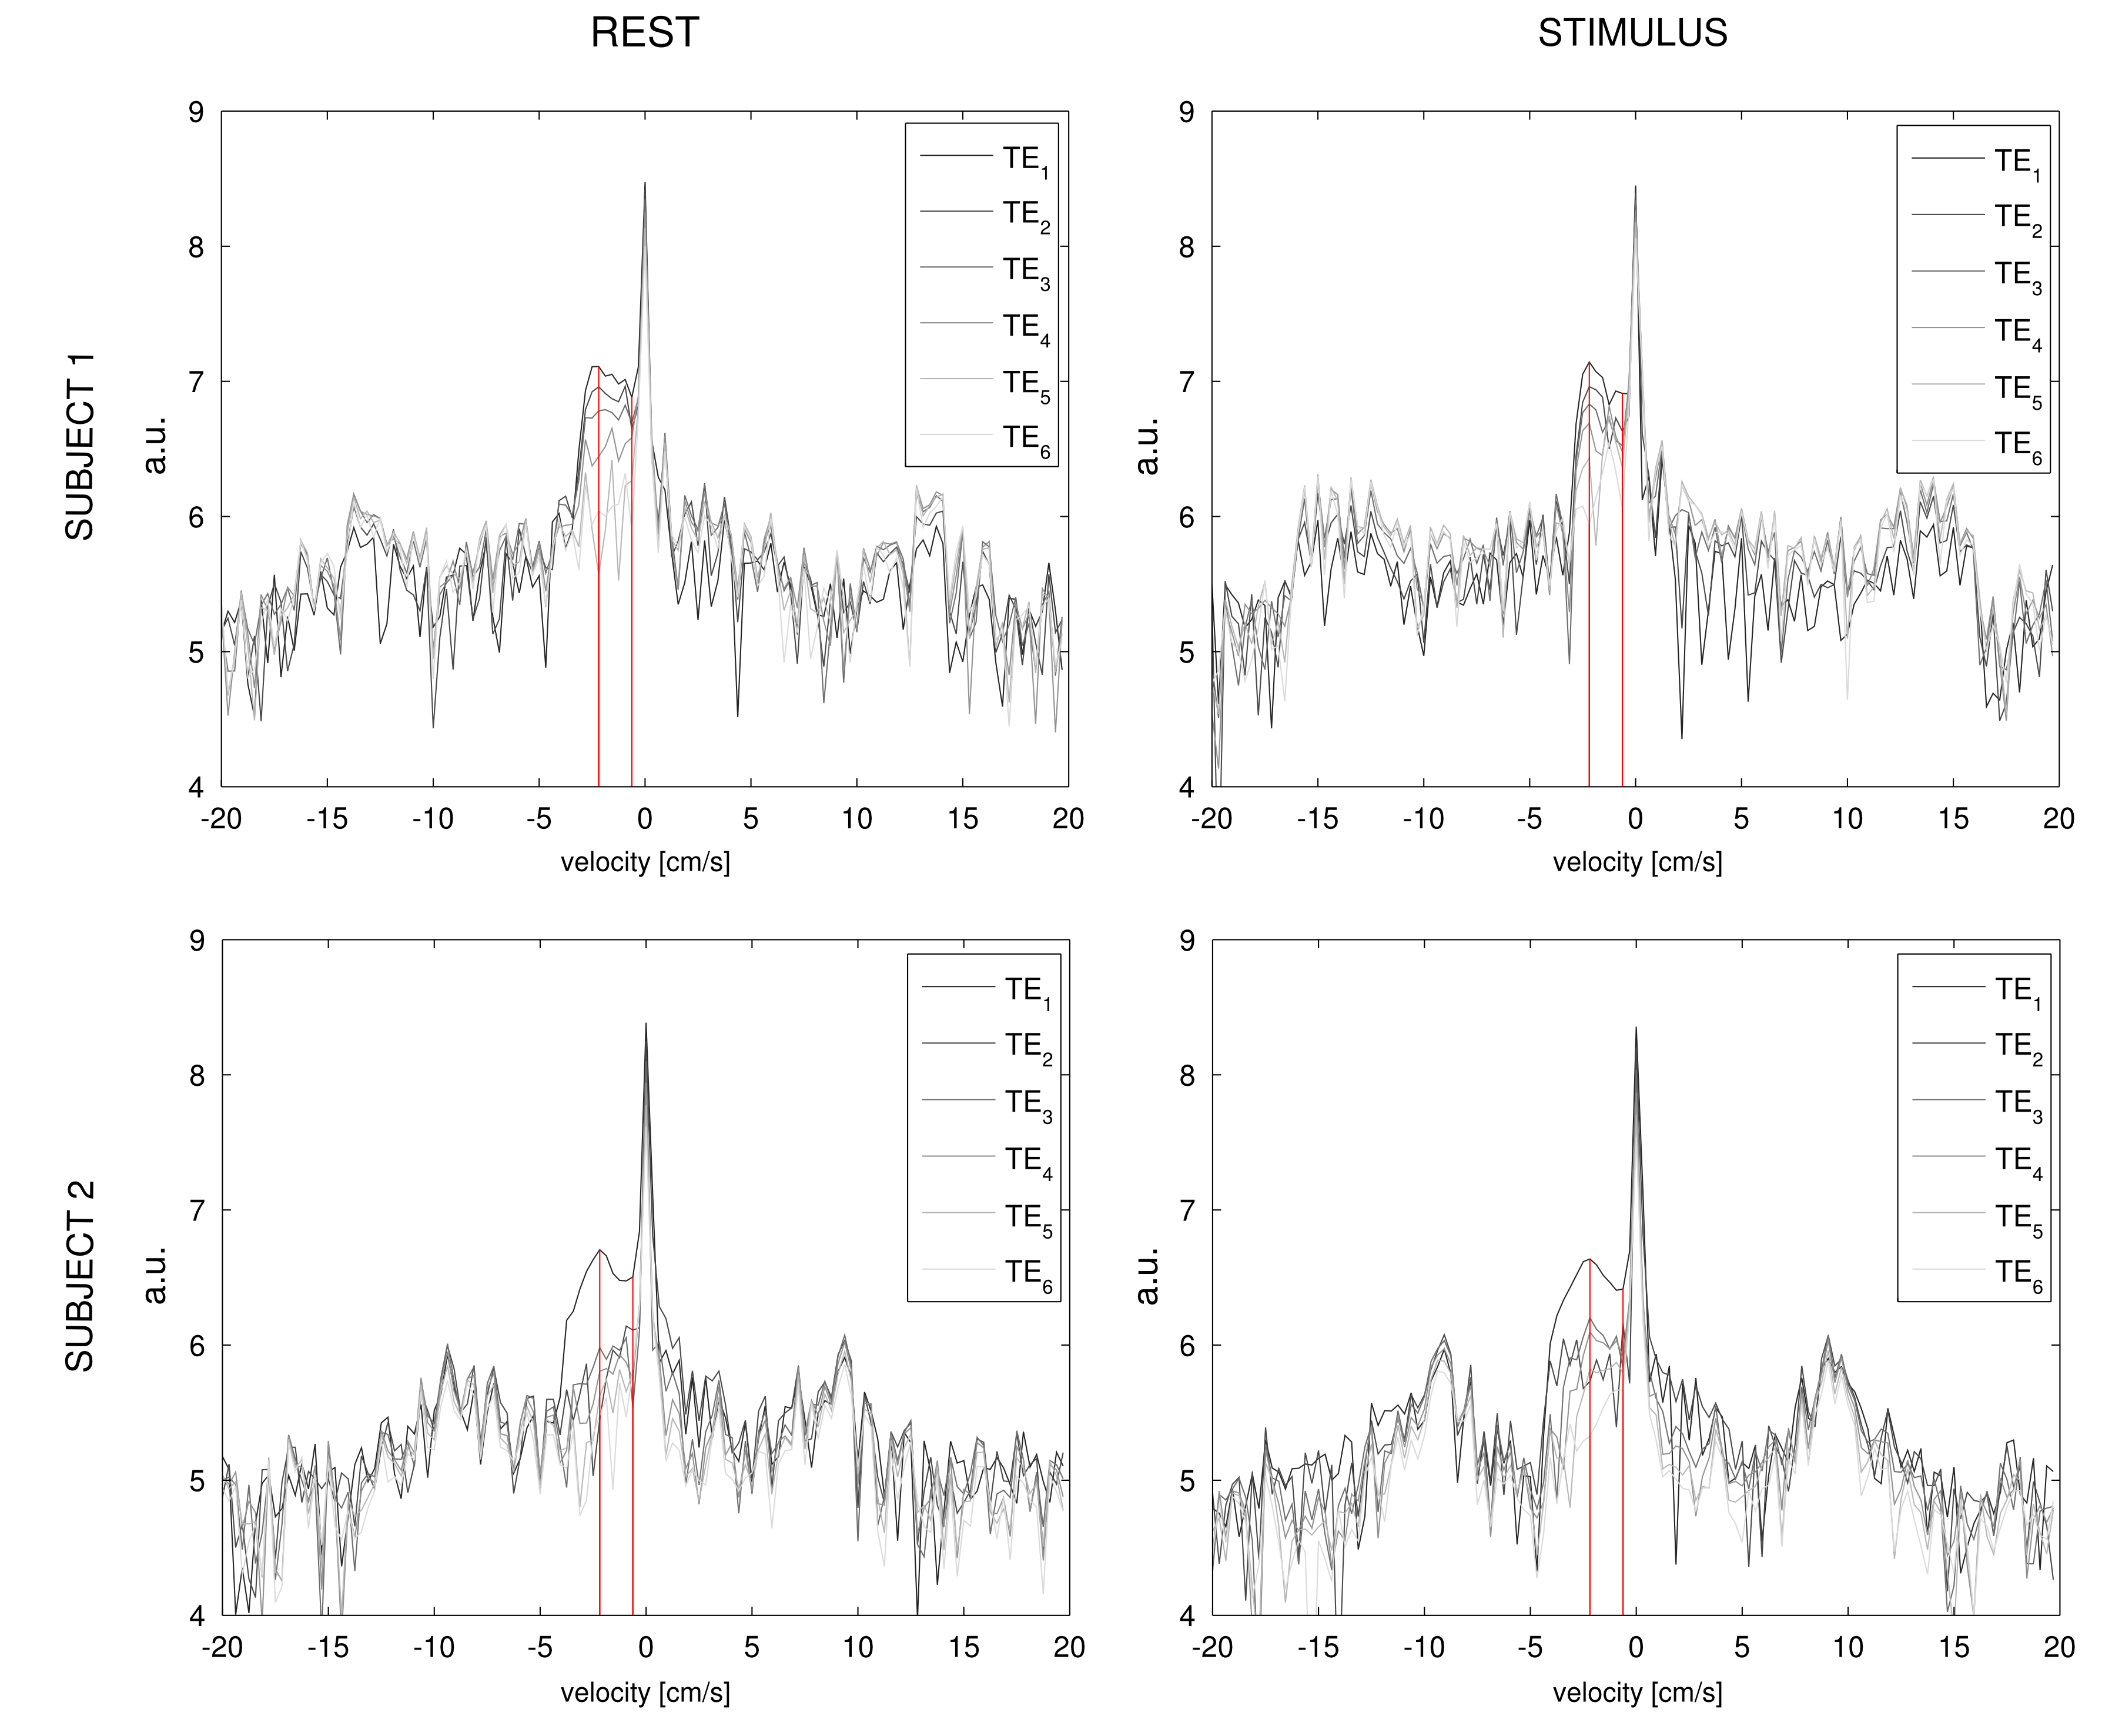
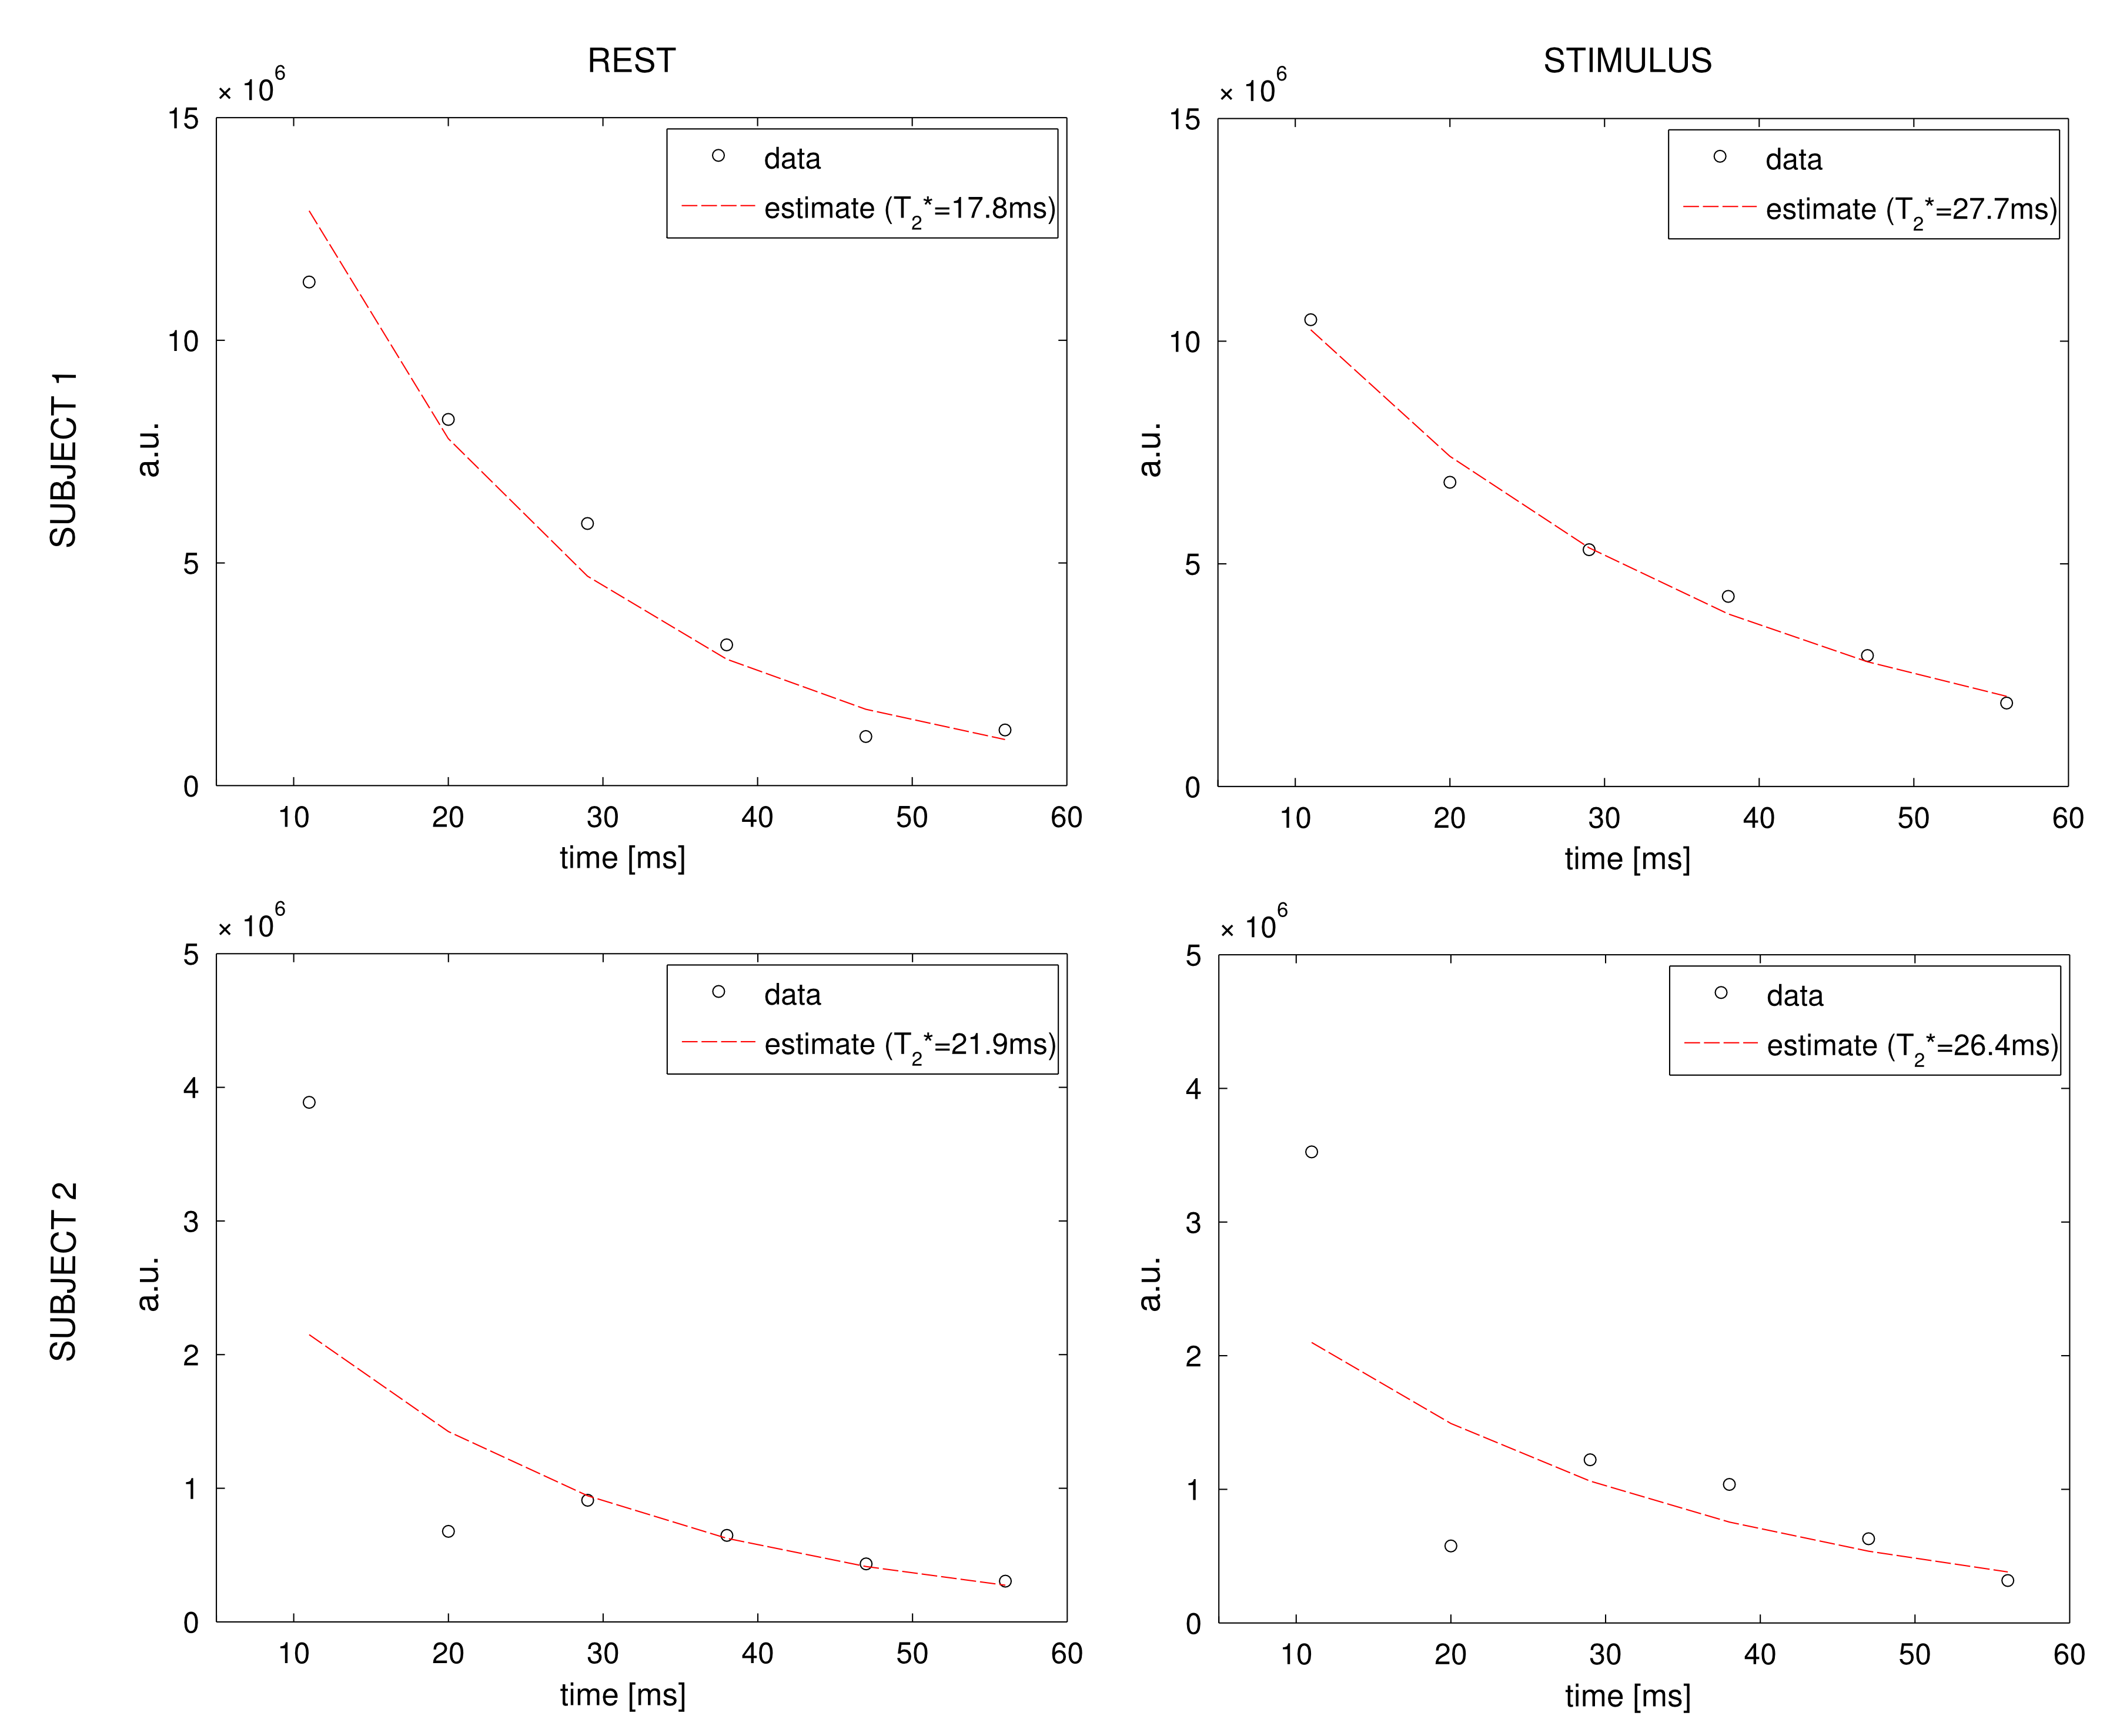
Acquisition: Pilot data were acquired for two subjects with a 3T GE HDx MRI (GE Healthcare, Milwaukee WI) with a body transmit coil and 8-channel head receive coil. A GRE readout and spiral k-space acquisition (5 repetitions, TR = 3s, FlipAngle = 90°, FOV = 22.4 cm, Matrix = 64 x 64, 3.5x3.5x6.9 mm) was used to acquire 10 slices with an inter-slice gap of 1 mm. The parameters used for velocity encoding and multi-GRE sampling were the same described for the simulation. Two consecutive acquisitions were made: one at rest (eyes open, blackscreen) and one with a visual stimulus (movie), for a total of 22 minutes. For simplicity we only applied PFGs along the z axis and focused on signal from the superior sagittal sinus (sSS), so that the venous compartment was modelled to have negative velocity. Pre-processing of phase images included unwrapping, spatial filtering besides motion correction (See Fig. 1). The 𝑇2*-SvO2 calibration was based on values from 5 with assumed value of 0.44 for haematocrit.
Results
Simulation: Simulated velocity spectra at TE=11ms for different levels of noise, averaging and typical grey matter distributions of blood volume (2% arterial, 3% venous) are shown in Fig. 2. In the noiseless condition the central peak and the lobes, respectively related to the static tissue and blood compartments respectively, are clearly distinguishable. For such specifics and typical levels of noise (σTEi = 1% 4, vmax= 1mm/s 6) the signal is instead not distinguishable in the spectra, even following moderate averaging (Fig. 2,F). Acquisition: sSS velocity spectra at different TEs are reported for both subjects in each condition, showing pronounced lobes for negative velocities, peaking at about -3/-4 cm/s in a consistent fashion across conditions (Fig.3). In both subjects 𝑇2* is found to increase with the stimulus: from 19.4 ms to 25.4 ms and 21.9 ms to 26.4 ms, corresponding to an increase from 0.6 to 0.71 (+18%) and from 0.65 to 0.72 (+11%) in SvO2 respectively (Fig.4), consistent with functional hyperaemia.Conclusion
The study supplies a proof of principle and first evaluation of the potential of the newly proposed technique. A mathematical model has been designed, implementing the method and characterizing the noise for an insight on its limitations. In particular, the method is currently only applicable to areas with high blood volume as SNR is too low in parenchyma for meaningful measurements. Based on this, SvO2 estimates from the sSS of two participants are reported, preliminarily showing the feasibility of the method and effectiveness in detecting changes due to neural activation at a bulk level.Acknowledgements
AM acknowledges the generous support of the Cardiff University President's Scholarships.References
[1] Lin, A.-L., Fox, P.T., Hardies, J., Duong, T.Q., Gao, J.-H., 2010. Nonlinear coupling between cerebral blood flow, oxygen consumption, and ATP production in human visual cortex. Proc. Natl. Acad. Sci. U.S.A. 107, 8446–51.
[2] Bolar, D.S., Rosen, B.R., 2011. QUantitative Imaging of eXtraction of oxygen and TIssue consumption (QUIXOTIC) using venular-targeted velocity-selective spin labeling. Magn. Reson. Med. 66, 1550–62.
[3] Guo, J., Wong, E.C., 2012. Venous oxygenation mapping using velocity-selective excitation and arterial nulling. Magn. Reson. Med. 68, 1458–71.
[4] Krüger, G., Glover, G.H., 2001. Physiological Noise in Oxygenation-Sensitive Magnetic 637, 631–637.
[5] Zhao, J.M., Clingman, C.S., Närväinen, M.J., Kauppinen, R. a, van Zijl, P.C.M., 2007. Oxygenation and hematocrit dependence of transverse relaxation rates of blood at 3T. Magn. Reson. Med. 58, 592–7.
[6] Nunes, R.G., Jezzard, P., Clare, S., 2005. Investigations on the efficiency of cardiac-gated methods for the acquisition of diffusion-weighted images. J. Magn. Reson. 177, 102–10.
Figures