1658
Improving qBOLD based measures of brain oxygenation using hyperoxia BOLD derived measures of blood volume1FMRIB, Nuffield Department of Clinical Neurosciences, University of Oxford, Oxford, United Kingdom
Synopsis
Measurements of deoxygenated blood volume (DBV) via the streamlined-qBOLD technique are larger than typically reported in the literature, resulting in underestimation of oxygen extraction fraction (OEF). In this study we address this limitation by acquiring a separate measurement of DBV using the BOLD response to the administration of oxygen, which has been shown to be specifically sensitive to venous blood volume. By combining measurements of the reversible transverse relaxation rate, R2′, and DBV to measure OEF, we were able to show better agreement with whole brain OEF from the TRUST method than OEF measured with streamlined-qBOLD.
Introduction
Streamlined-qBOLD1 is a recently proposed refinement of the qBOLD technique for non-invasively mapping baseline brain oxygenation. However, measurements of deoxygenated blood volume (DBV) made using this technique were noted to be larger than typically reported in the literature. This resulted in smaller than expected estimates of oxygen extraction fraction (OEF), since this is calculated from the ratio of R2′ and DBV. The multiparametric-qBOLD2 (mp-qBOLD) technique attempts to avoid the difficulties of measuring DBV directly from the qBOLD signal by measuring cerebral blood volume (CBV) using Gadolinium-based Dynamic Susceptibility Contrast (DSC). However, there is a mismatch between CBV from DSC, which is sensitive to all vessel types, and DBV, which is localised to vessels containing deoxygenated blood. Alternatively, it has been shown3 that the BOLD response to the administration of oxygen (hyperoxia BOLD contrast) is specifically sensitive to venous CBV, which closely aligns with DBV. The aim of this study is to produce quantitative maps of baseline brain oxygenation by combining relaxometry based measures of R2′ with a measurement of DBV using hyperoxia contrast. These results are compared with whole brain measurements of OEF made using TRUST4 and parametric maps of baseline brain oxygenation made using Streamlined-qBOLD1.Methods
Four healthy participants (aged 23-34; mean 27; 1 female) were scanned with local ethics committee approval using a 3T Siemens Prisma with a 32-channel receive coil. MRI data were acquired in the following order:
TRUST: FOV 230mm2, 64x64 matrix, TR 3s, TE 7ms, GRAPPA 3, partial fourier 6/8, bandwidth 2604Hz/px. Labelling parameters: gap 25mm, thickness 100mm, TI 1050ms, repetitions 40 (4 tag-control pairs for eTE of 0, 40, 80 and 160ms). Scan duration 1min 53secs. T2 of venous blood was quantified from this data and converted to Yv by following the standard analysis approach4. Assuming arterial blood is fully saturated, an estimate of whole brain OEF is given by 1-Yv.
Streamlined-qBOLD: A FLAIR-GASE acquisition5 was used with the following parameters: FOV 220mm2, 96x96 matrix, nine 5mm slabs (encoded into four 1.25mm slices), 2.5mm gap, TR 3s, TE 80ms, bandwidth 2004Hz/px, TIFLAIR 1210ms. ASE spin echo displacement times (τ): τ=0ms (11 repetitions) and τstart:Δτ:τfinish=15:3:66ms. Scan duration 11mins48secs. R2′ was calculated using a log-linear fit to the mono-exponential regime6 (τ>15ms) of the FLAIR-GASE data. DBV was calculated as the difference between the intercept of this fit and the log of the spin-echo signal (τ=0ms). OEF was then calculated using Equation 1 with known or assumed constants (Δ𝝌0=0.264x10⁻⁶, κ=0.03):
$$OEF=\frac{3.R_2^\prime}{DBV.4.\gamma.\pi.\Delta\chi_0.\kappa.[Hb].B_0}\>\>\>\>\>\>\>\>\>\>\>\>[1]$$
Hyperoxia based mp-qBOLD: FLAIR-GASE was repeated for τ≥15ms to provide an independent measure of R2′. Scan duration 7mins 18secs. BOLD EPI data were acquired with a matched slice prescription: FOV 220mm2, 96x96 matrix, nine 5mm slices, 2.5mm gap, TR 1s, TE 35ms, bandwidth 2004Hz/px. A prospective end-tidal gas targeting system (RespirAct Gen 3) was used to modulate end-tidal oxygen (PETO2) between normoxic and hyperoxic (baseline +300 mmHg) conditions, whilst maintaining isocapnia. Hyperoxia paradigm: three 2mins blocks of normoxia interleaved with two 2mins blocks of hyperoxia. Scan duration 10mins. Hyperoxia BOLD data were analysed with FEAT7 using the recorded PETO2 as a model. DBV was calculated from voxel-wise estimates of percentage BOLD signal change (δS) using Equation 2, where A=27ms, B=0.2, C=245.1mmHg and D=0.1:
$$DBV=\left(\frac{A}{TE}+B\right)\left(\frac{C}{\Delta P_AO_2}+D\right){\delta}S\>\>\>\>\>\>\>\>\>\>\>\>[2]$$
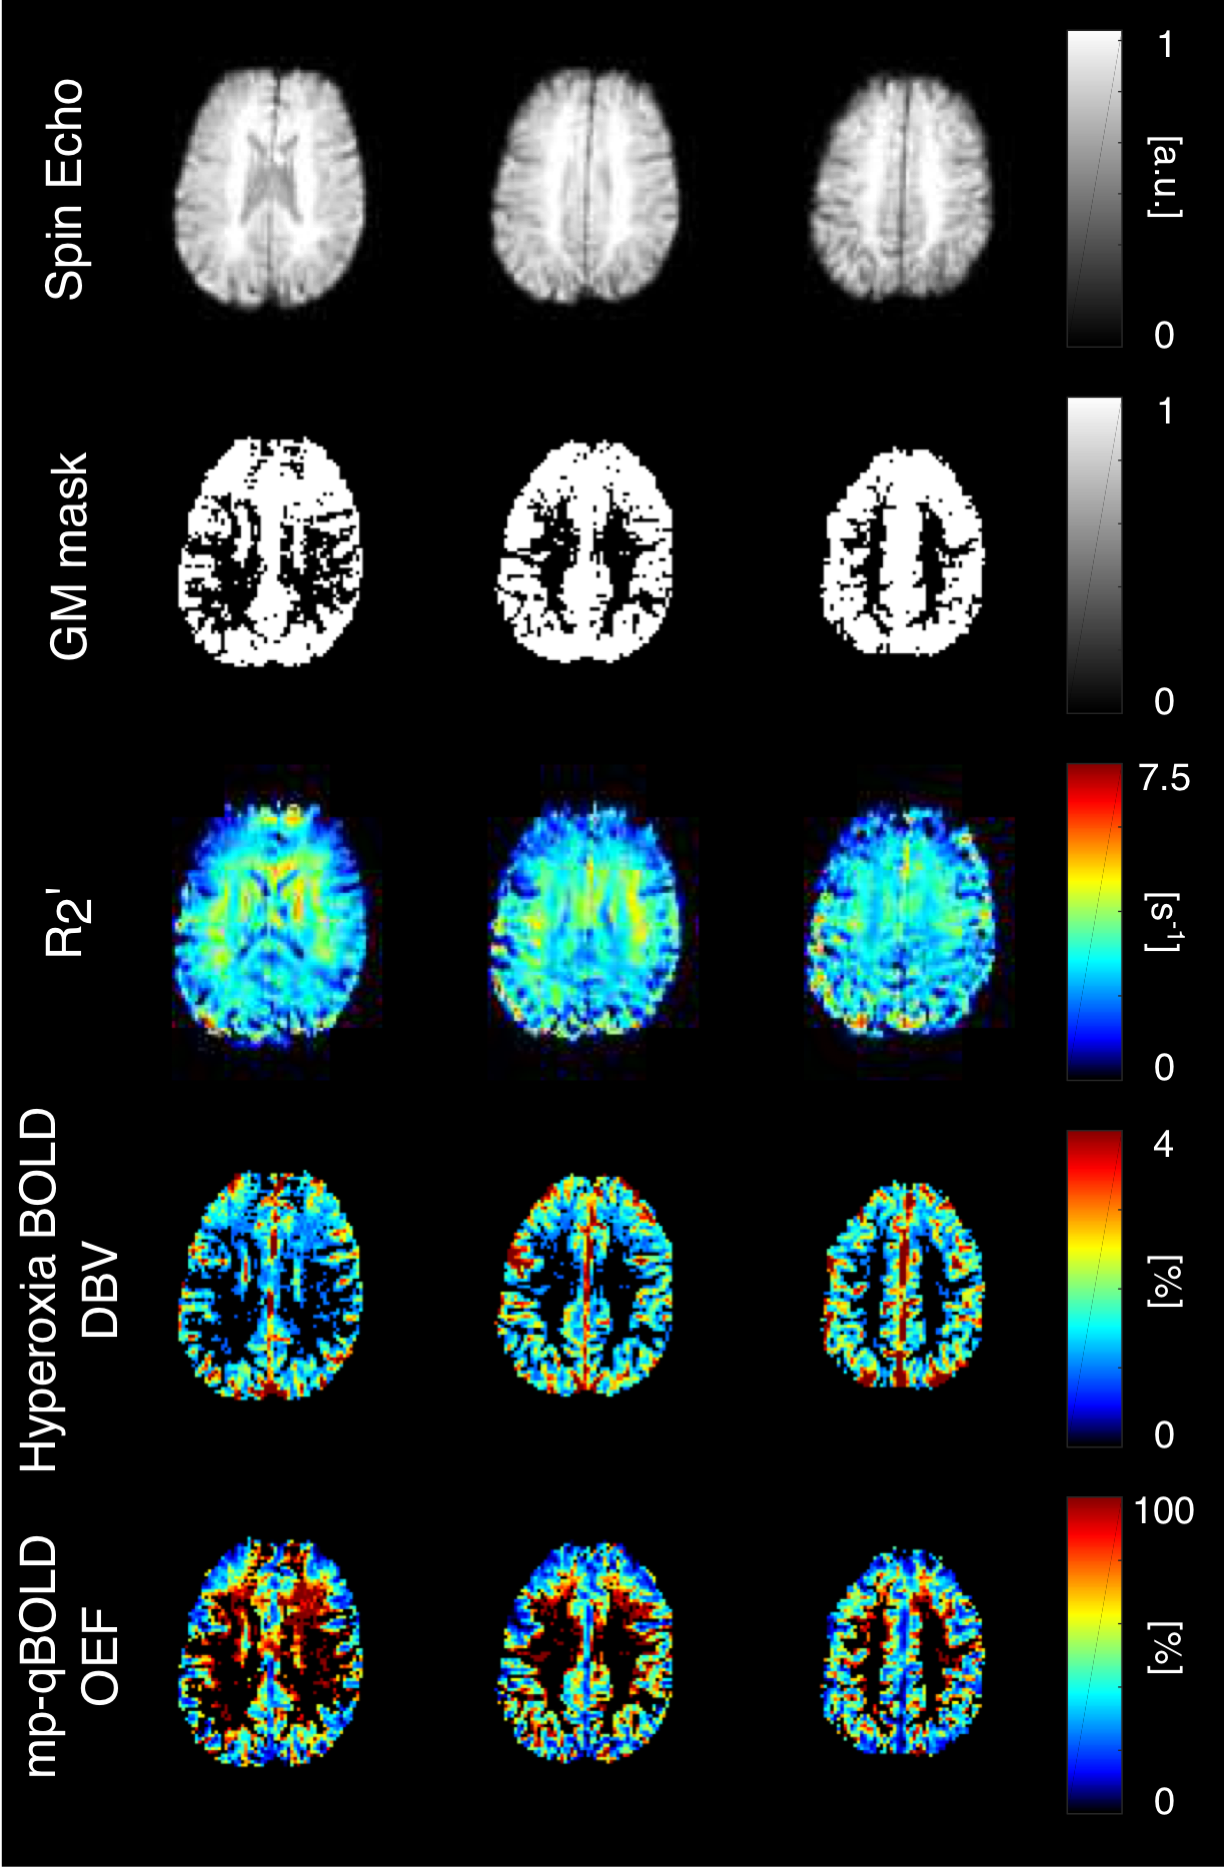
OEF was then calculated by combining DBV and R2′ parametric maps using Equation 1. For further regional analysis, grey matter masks were produced by thresholding the DBV maps from hyperoxia BOLD at 1% and binarising. Measurements were limited to grey matter due to the presence of paramagnetic myelin in white matter invalidating qBOLD model assumptions1.
Results
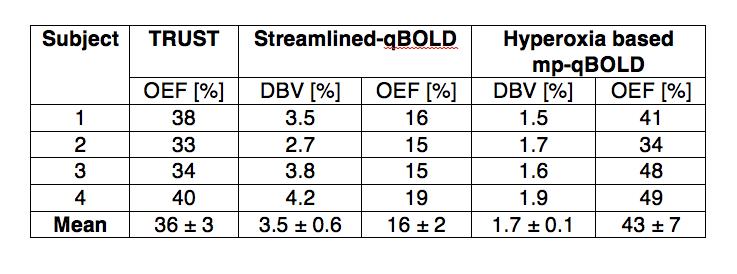
Figure 1 shows spin-echo images, grey matter masks and parameter maps for a selection of slices from one subject. For each subject, regional measurements of DBV and OEF were estimated for grey matter using streamlined-qBOLD and hyperoxia based mp-qBOLD and compared with whole brain TRUST measurements of OEF, Table 1.Discussion
Group average DBV measurements from hyperoxia BOLD are considerably lower than from streamlined-qBOLD. Through Equation 1 this propagates to higher estimates of OEF that are in better agreement with TRUST OEF than those from streamlined-qBOLD. Finally, the total acquisition time for the hyperoxia based mp-qBOLD was 17mins 18secs, but further investigation may permit a reduction in acquisition time.Conclusion
In this pilot study, hyperoxia based mp-qBOLD produces estimates of OEF in grey matter that agree well with established measures of whole brain OEF by improving the measurement of DBV using hyperoxia. This demonstrates the potential of hyperoxia to replace gadolinium-based DSC in the mp-qBOLD technique making it a non-invasive and safer approach to quantifying brain oxygenation.Acknowledgements
This work was funded by EPSRC grant EP/K025716/1.References
1. Stone AJ, Blockley NP. A streamlined approach to mapping the oxygen extraction fraction (OEF) and deoxygenated blood volume (DBV) using the quantitative BOLD technique. Proc. Intl. Soc. Mag. Reson. Med. 23 2015:0219
2. Christen T, Schmiedeskamp H, Straka M, Bammer R, Zaharchuk G. Measuring brain oxygenation in humans using a multiparametric quantitative blood oxygenation level dependent MRI approach. Magn. Reson. Med. 2012;68:905–911. doi: 10.1002/mrm.23283.
3. Blockley NP, Griffeth VEM, Germuska MA, Bulte DP, Buxton RB. An analysis of the use of hyperoxia for measuring venous cerebral blood volume: Comparison of the existing method with a new analysis approach. Neuroimage 2013;72:33–40. doi: 10.1016/j.neuroimage.2013.01.039.
4. Lu H, Ge Y. Quantitative evaluation of oxygenation in venous vessels using T2-Relaxation-Under-Spin-Tagging MRI. Magn. Reson. Med. 2008;60:357–363. doi: 10.1002/mrm.21627.
5. Blockley NP, Stone AJ. Improving the specificity of R2' to the deoxyhaemoglobin content of brain tissue: Prospective correction of macroscopic magnetic field gradients. Neuroimage 2016;135:253–260. doi: 10.1016/j.neuroimage.2016.04.013.
6. Yablonskiy, D. A., & Haacke, E. M. (1994). Theory of NMR Signal Behavior in Magnetically Inhomogeneous Tissues: The Static Dephasing Regime. Magnetic Resonance in Medicine, 1–15.
7. Jenkinson, M., Beckmann, C. F., Behrens, T. E. J., Woolrich, M. W., & Smith, S. M. (2012). FSL. NeuroImage, 62(2), 782–790. http://doi.org/10.1016/j.neuroimage.2011.09.015
Figures