1657
Quantifying the dynamics of cerebral blood flow, oxygen metabolism, and deoxygenated blood volume with a combined normoxia/hyperoxia method1Neurosciences Graduate Program, University of California, San Diego, La Jolla, CA, United States, 2Medical Scientist Training Program, University of California, San Diego, La Jolla, CA, United States, 3Center for Functional MRI, University of California, San Diego, La Jolla, CA, United States, 4Psychiatry, University of California, San Diego, 5Center for Human Development, University of California, San Diego, 6Radiology, University of California, San Diego
Synopsis
To better understand the dynamics of the BOLD response in terms of CBF, CMRO2, and deoxygenated blood volume, we used a combined normoxia/hyperoxia approach to untangle their relative contributions. This method was applied to both the positive activation response and the post-stimulus undershoot, the origins of which are still debated. A simple model of the BOLD response based on flow, metabolism, and volume, modified to include the effects of hyperoxia, was applied. For the origin of the undershoot, these data provide strong evidence for a CBF undershoot, moderate evidence for elevated CMRO2, and no evidence for elevated CBV (Balloon Model).
Purpose
To understand the dynamics of the BOLD response—including the post-stimulus undershoot—in the human brain in terms of the dynamics of blood flow, oxygen metabolism, and deoxygenated blood volume by using a combined normoxia/hyperoxia method to untangle the effects of blood volume and blood oxygenation.Background
Definitive interpretation of the blood-oxygenation level dependent (BOLD) signal in functional magnetic resonance imaging (fMRI) is challenging due to the complexity of the signal. While the BOLD response is primarily due to a change in total deoxyhemoglobin1, that quantity is modulated by changes in cerebral blood flow (CBF), cerebral metabolic rate of oxygen (CMRO2), and deoxygenated cerebral blood volume (CBV, a dHb-weighted average over all vascular volumes, dominated by venous vessels, but also including capillaries and some contribution from arterioles). The BOLD post-stimulus undershoot has been a prime example of this ambiguity: it could arise as a slow recovery of CBV2, a slow recovery of CMRO23,4, or a CBF undershoot5,6. Quantitative measurements of CMRO2 dynamics from dynamic measurements of CBF and BOLD only provide sufficient information to estimate CMRO2 dynamics if CBV follows CBF in a well-established way; if the undershoot is due to a mechanism like the Balloon Model, such dynamic measurements are problematic. While studies using VASO have not found evidence for a slow CBV recovery7, this may be because the technique is sensitive to total rather than deoxygenated blood volume. As an alternative method, studies showing that the effect of hyperoxia on the BOLD signal is sensitive to deoxygenated blood volume suggest that comparing activation responses in normoxia and hyperoxia enables us to separate effects of CMRO2 and CBV, and in particular test for a slow recovery of CBV during the undershoot8,9.Methods
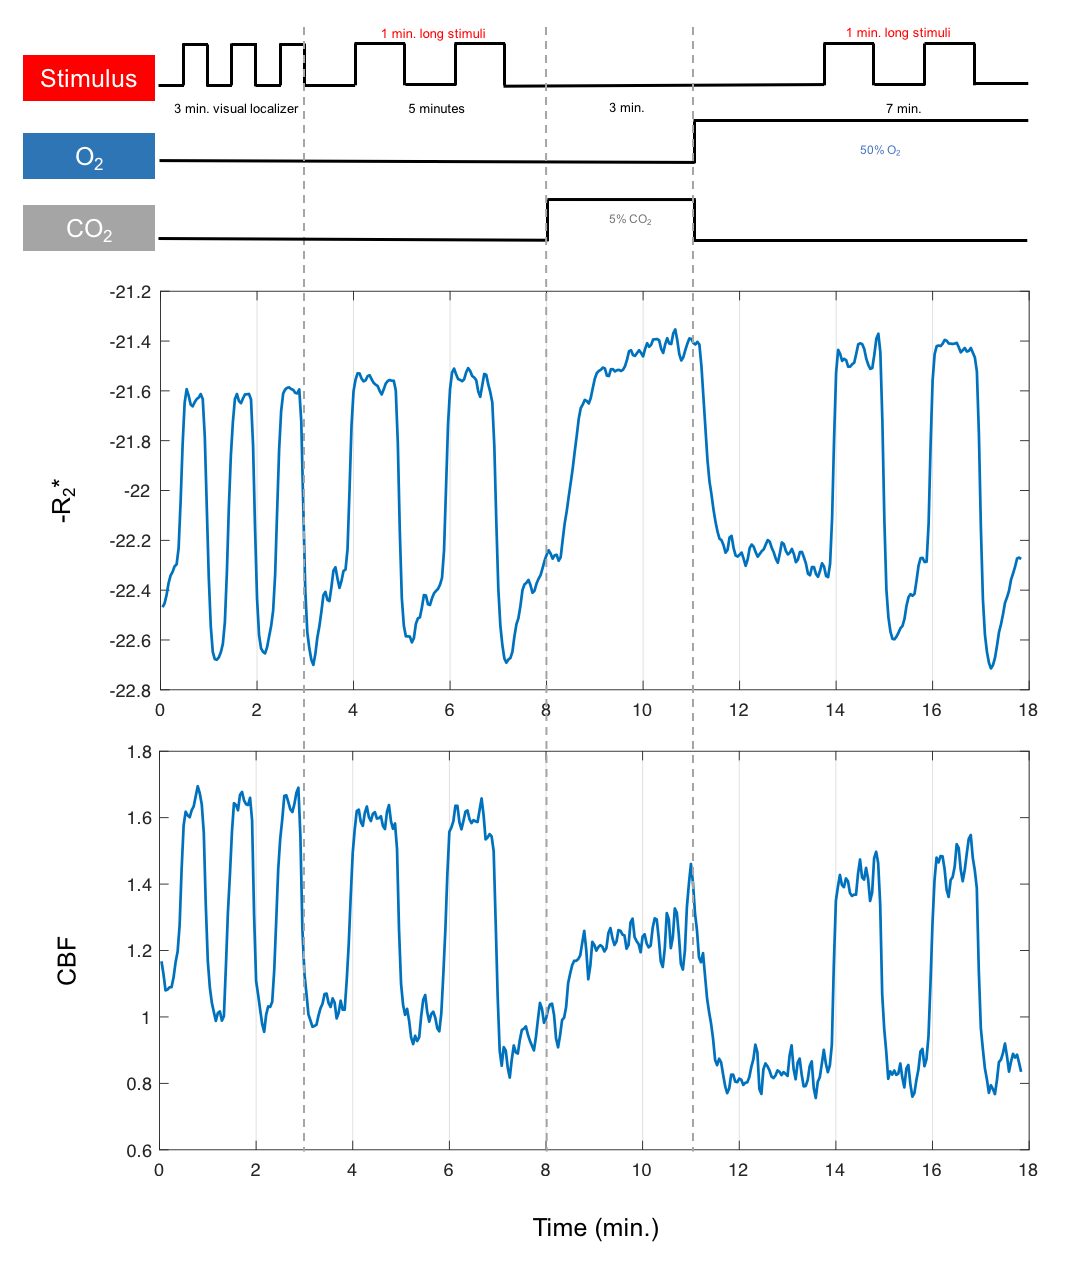
Sixteen subjects (7F/9M) were examined with a dual-echo spiral PICORE QUIPSS II ASL acquisition10 to simultaneously measure CBF and BOLD dynamics. A visual stimulus was administered in two gas conditions: normoxia and hyperoxia (50% O2/50% N2). Calibrated BOLD11 was performed using 5% CO2. An activated ROI in visual cortex was identified with a separate functional localizer experiment in normoxia (Figure 1).Experimental Results
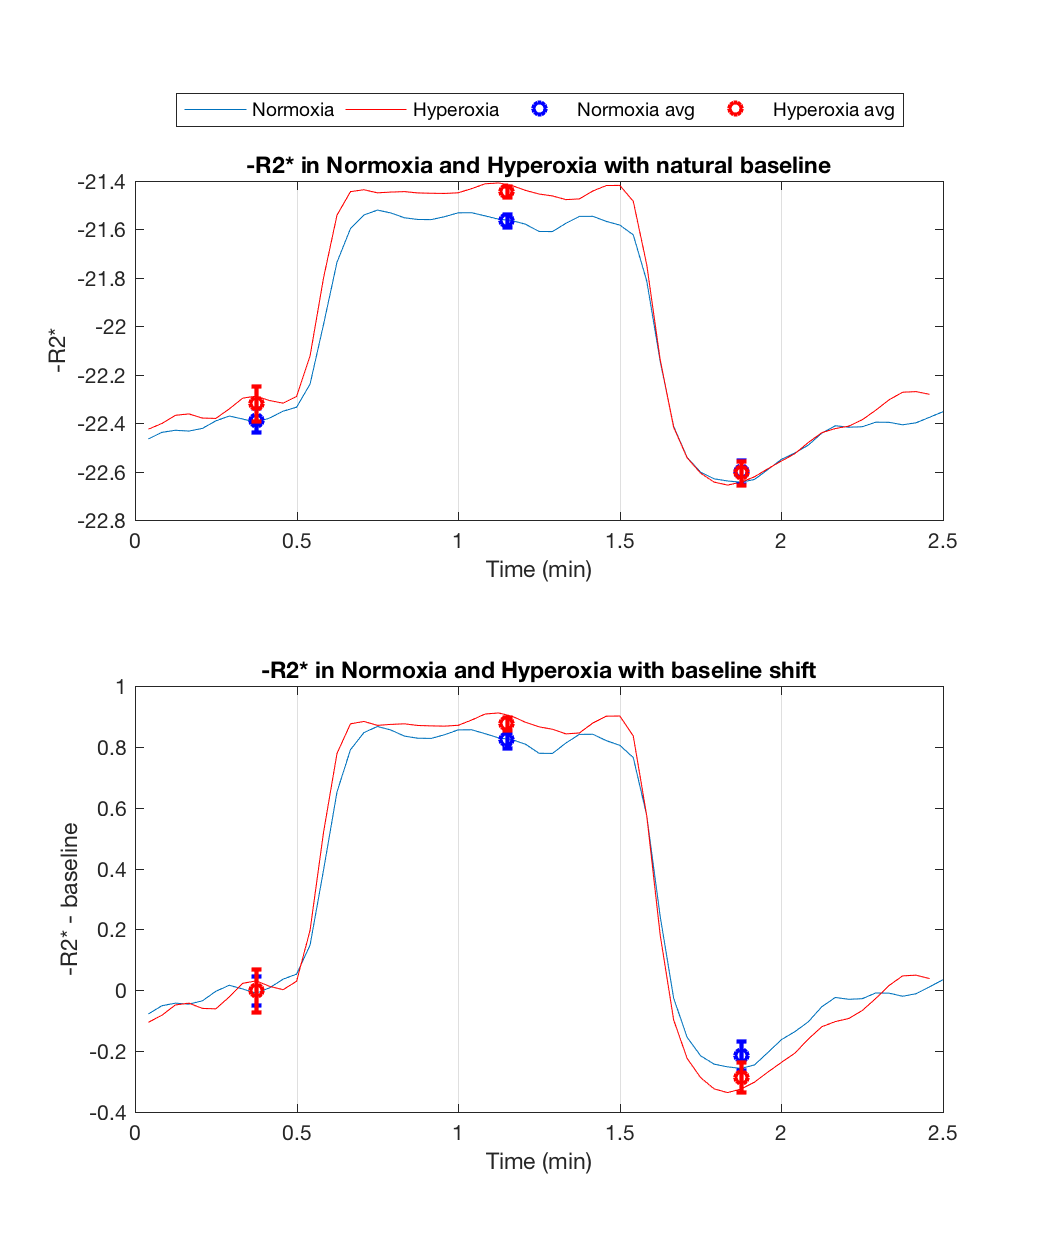
Figure 1 (middle/bottom) shows the average BOLD and CBF dynamics for all subjects. ASL values have been adjusted using a factor of 1.094 to correct for decreased T1 of blood due to hyperoxia12; however, due to concerns about the accuracy of CBF measurements in hyperoxia, we do not use these values in the analysis. The separate stimulus blocks were averaged for normoxia and hyperoxia. As described in previous work8, the BOLD signal change from normoxia to hyperoxia is directly proportional to CBV. Figure 2 (top) shows the R2* responses. However, interpretation challenges stem from hyperoxia producing additional changes in R2* based on CBF and CMRO2 changes, and on physical effects such as field gradients produced by higher O2 concentration. We assumed that these unknown effects add a constant offset to the measured R2* values across the time course, and so subtract the baseline offset to make the baselines the same (Figure 2, bottom). The difference between the hyperoxic and normoxic curves should thus be proportional to the CBV difference from baseline. Note that the difference in the undershoot is consistent with reduced CBV, arguing against the Balloon Model.Modeling Results
To quantitatively estimate changes in CBV and CMRO2, we modified the simple model introduced by Griffeth, et al.1 to include effects of hyperoxia:
$$\delta b=M \left[1-\left(1+\delta v\right)\left(\frac{1+\delta r}{1+\delta f}-w_{O_{2}}\right)\right]$$
$$w_{O_{2}}= \frac{ε\cdot ∆Pa_{O_{2}}}{E_0\cdot Ca_0}$$
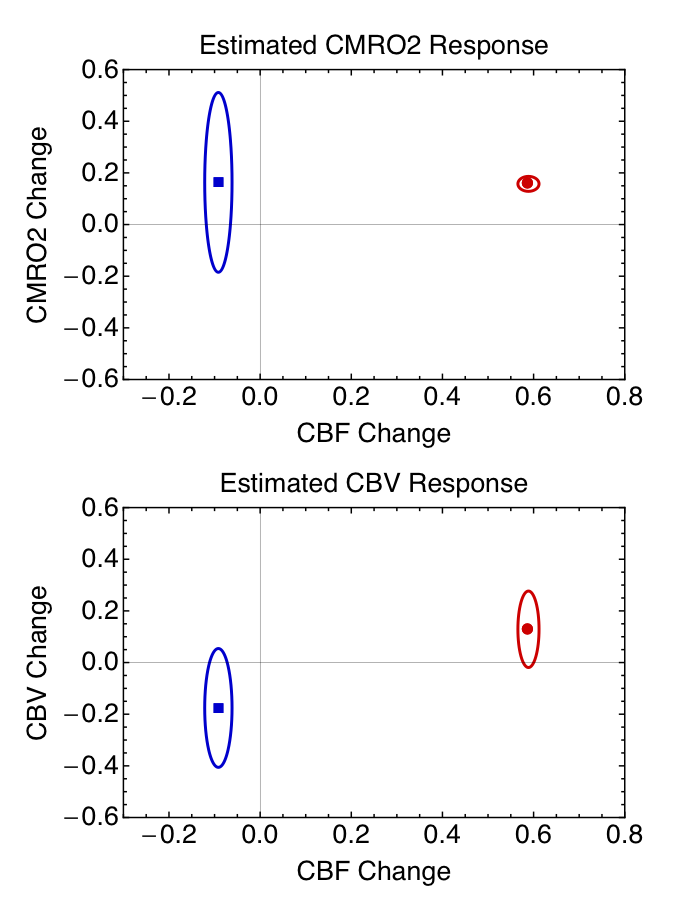
where the parameters are: M, scaling factor; δv, fractional volume change; δr, fractional change in CMRO2; δf, fractional change in CBF; wO2, a factor combining the change in arterial PO2 (∆PaO2, mmHg) in hyperoxia, ε, solubility of O2 (0.00135 mM/mmHg), E0, baseline oxygen extraction fraction, and CaO2 (mM), the concentration of Hb in O2 equivalents. Assuming E0=0.4, the data enabled separate estimates of δv and δr in the positive response to the stimulus and M. The full picture of the positive activation from this analysis was δf=0.59, δr=0.16 and δv=0.13. The normoxia and hyperoxia R2* data in the undershoot then were used with the same value of M to calculate the undershoot δv and δr, with δf=-0.09, δr=0.14 and δv=-0.18. A further analysis of the uncertainties in the undershoot values (Figure 3) showed that the probability that CBV is elevated is 0.06, whereas the probability the CMRO2 is elevated is 0.85.
Conclusions
For the origin of the post-stimulus undershoot, these data provide strong evidence for a CBF undershoot, moderate evidence for elevated CMRO2, and no evidence for elevated CBV (Balloon Model).Acknowledgements
E. Y. Liu would like to acknowledge and thank Kenny Jackson, Abel Martinez, and Jessica Ho for their help in acquiring the multi-gas data. She also thanks David Shin, Aaron Simon, Kun Lu, and Jia Guo for their advice and expertise with various imaging sequences and analyses. She is grateful to the Interfaces Graduate Training Program for awarding her the San Diego Fellowship, and the UCSD Medical Training Program for their support. Lastly, the authors would like to acknowledge NIH grant support through NS036722 and NS085478.References
1. Griffeth VEM, Blockley N, Simon AB, Buxton RB. A New Functional MRI Approach for Investigating Modulations of Brain Oxygen Metabolism. PLoS One. 2013;8(6):e68122. doi:10.1371/journal.pone.0068122.
2. Buxton RB, Wong EC, Frank LR. Dynamics of blood flow and oxygenation changes during brain activation: the balloon model. Magn Reson Med. 1998;39(6):855-864. doi:10.1002/mrm.1910390602.
3. Frahm J, Baudewig J, Kallenberg K, Kastrup A, Merboldt KD, Dechent P. The post-stimulation undershoot in BOLD fMRI of human brain is not caused by elevated cerebral blood volume. Neuroimage. 2008;40(2):473-481. doi:10.1016/j.neuroimage.2007.12.005.
4. van Zijl PCM, Hua J, Lu H. The BOLD post-stimulus undershoot, one of the most debated issues in fMRI. Neuroimage. 2012;62(2):1092-1102. doi:10.1016/j.neuroimage.2012.01.029.
5. Chen JJ, Pike GB. Origins of the BOLD post-stimulus undershoot. Neuroimage. 2009;46(3):559-568. doi:10.1016/j.neuroimage.2009.03.015.
6. Kim JH, Ress D. Arterial impulse model for the BOLD response to brief neural activation. Neuroimage. 2016;124:394-408. doi:10.1016/j.neuroimage.2015.08.068.
7. Lu H, Golay X, Pekar JJ, Van Zijl PCM. Functional magnetic resonance imaging based on changes in vascular space occupancy. Magn Reson Med. 2003;50(2):263-274. doi:10.1002/mrm.10519.
8. Blockley NP, Driver ID, Fisher J a, Francis ST, Gowland P a. Measuring venous blood volume changes during activation using hyperoxia. Neuroimage. 2012;59(4):3266-3274. doi:10.1016/j.neuroimage.2011.11.041.
9. Driver ID, Hall EL, Wharton SJ, Pritchard SE, Francis ST, Gowland PA. Calibrated BOLD using direct measurement of changes in venous oxygenation. Neuroimage. 2012;63(3):1178-1187. doi:10.1016/j.neuroimage.2012.08.045.
10. Wong EC, Buxton RB, Frank LR. Quantitative imaging of perfusion using a single subtraction (QUIPSS and QUIPSS II). Magn Reson Med. 1998;39(5):702-708. doi:10.1002/mrm.1910390506.
11. Davis TL, Kwong KK, Weisskoff RM, Rosen BR. Calibrated functional MRI: mapping the dynamics of oxidative metabolism. Proc Natl Acad Sci U S A. 1998;95(4):1834-1839. doi:10.1073/pnas.95.4.1834.
12. Bulte DP, Kelly M, Germuska M, et al. Quantitative measurement of cerebral physiology using respiratory-calibrated MRI. Neuroimage. 2012;60:582-591. doi:10.1016/j.neuroimage.2011.12.017.
Figures