1656
Global Signal Regression acts as a Temporal Downweighting Process in Resting-State fMRI1UCSD Center for Functional MRI, La Jolla, CA, United States
Synopsis
Global signal regression (GSR) is a controversial preprocessing method in resting-state fMRI. It has been claimed that the process can introduce artifactual anti-correlations in resting-state connectivity maps. However, a consensus regarding its use has been lacking, due in part to the difficulty in understanding its effects. We show that GSR can be well approximated by a temporal downweighting of the voxel time series, where the weighting factor is a function of the global signal magnitude and is uniform across space. This helps address the concerns about GSR and provides a novel framework for understanding its effects on resting-state data.
Purpose
Global signal regression (GSR) is a controversial nuisance removal method in resting-state fMRI.1,2,3 Specifically, it has been claimed that the observed anticorrelations between the default-mode network (DMN) and the task-positive network (TPN) are primarily a mathematical artifact introduced by GSR.1 Others have argued that the DMN and TPN are inherently anticorrelated and that GSR doesn’t alter this intrinsic behavior.2,3 Despite the concerns about GSR, a consensus regarding its use has been lacking, due in part to the difficulty in understanding its effects. Here, we introduce a novel framework for understanding the effects of GSR. We show that GSR can be approximated as a temporal downweighting process, in which data from time points with relatively large global signal (GS) magnitudes are largely attenuated, while data from time points with small GS magnitudes remain largely unaffected. We further show that GSR can be approximated as a temporal censoring process in which data from time points with large GS magnitudes are censored. Motivated by the censoring approach, we partition the fMRI dataset into two temporally orthogonal subsets and show that anticorrelated networks inherently exist in the temporal subset with smaller GS magnitudes.Methods
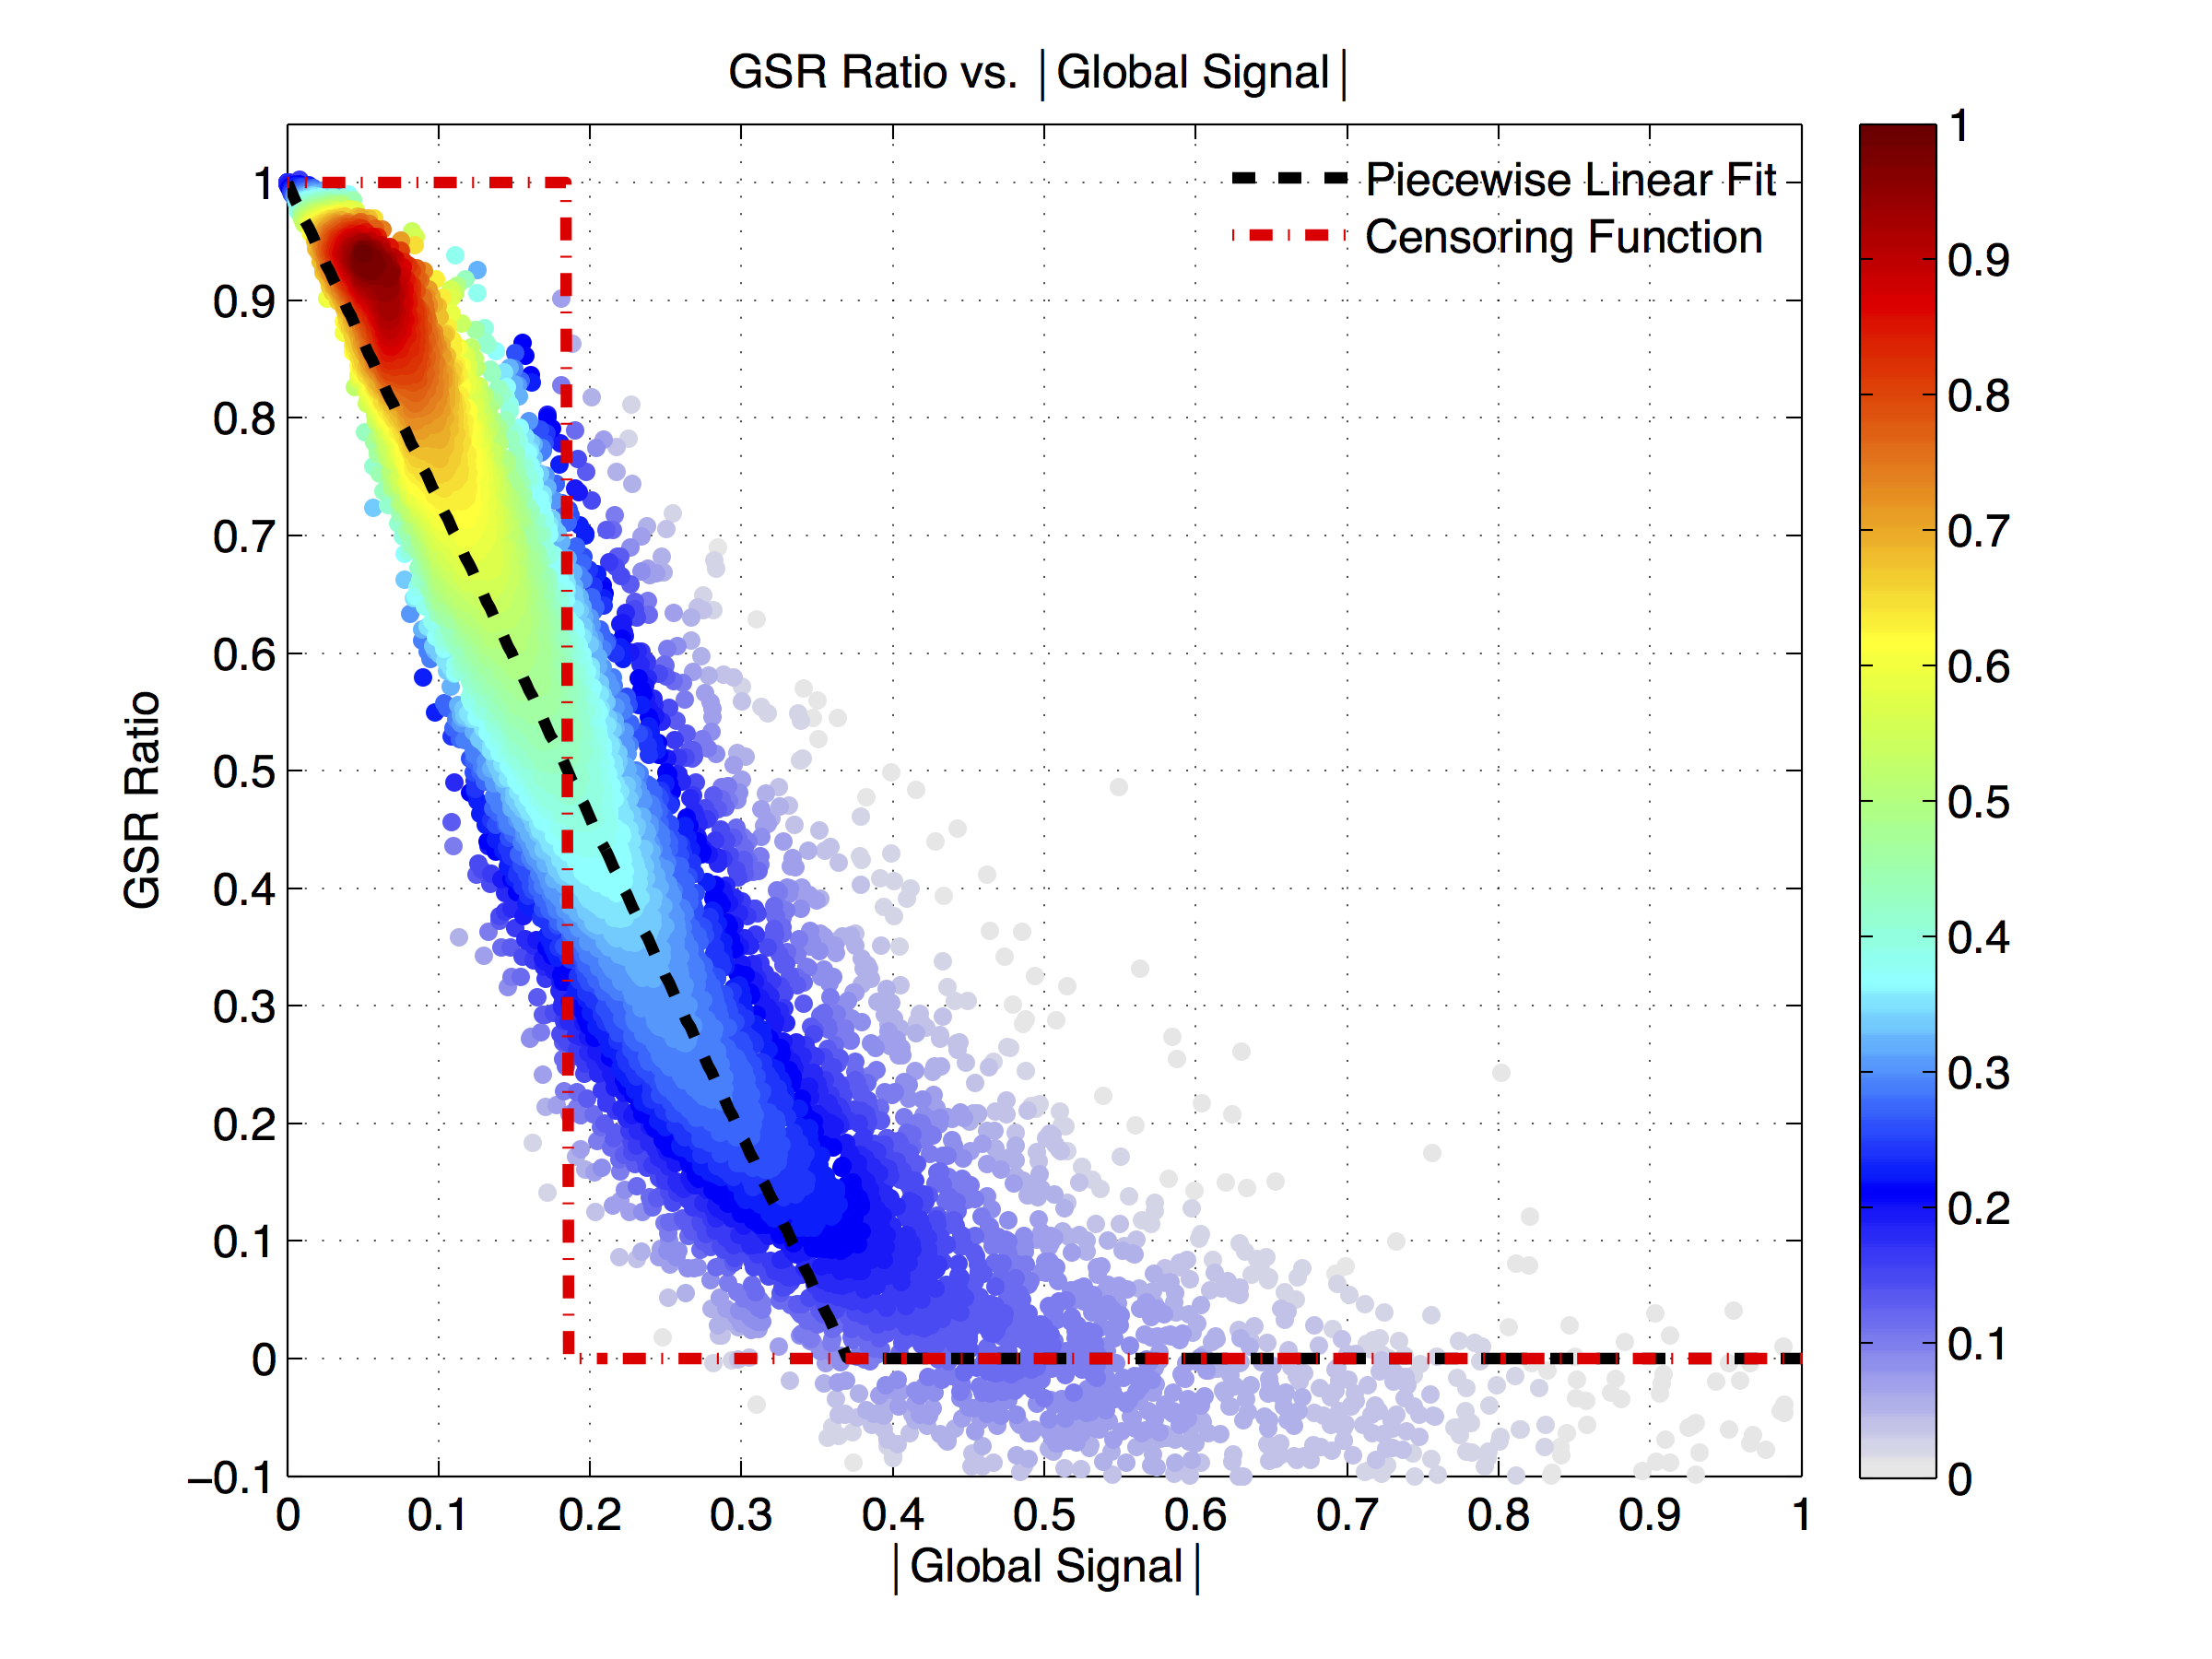
We used the data analyzed in,4 which was acquired from 17 subjects undergoing 4 BOLD-EPI resting-state scans (TR=2.16s, 4x4x4mm, 194 frames/scan). We performed standard pre-processing steps described in5 (except GSR) to produce a set of uncorrected data. We defined the GSR Ratio as the average downweighting imposed by GSR. This was computed for each time point by taking the ratio of the data value before GSR to the value after GSR and then averaging over all voxels. Figure 1 shows that the downweighting increases (i.e. GSR Ratio gets smaller) as GS magnitude increases. Element-wise multiplication of the uncorrected voxel time series by the GSR Ratio yields our first approximation to GSR, and is referred to as GS Ratio Weighting. Next, we calculated a piecewise-linear fit $$$f(GS(t))$$$ (black-dash, $$$R^2=0.94$$$) to approximate the downweighting as a function of GS magnitude. Element-wise multiplication of the uncorrected voxel time series by $$$f(GS(t))$$$ yields another approximation to GSR, referred as GS Weighting. As a limiting case to $$$f(GS(t))$$$, we defined a censoring function $$$C(GS(t))$$$ (red-dash-dot). This provides a temporal censoring approximation to GSR (referred to as GS Censoring), and sets the data equal to zero if the average downweighting due to GSR is large. For example, in Figure 1, time points are censored when $$$|GS|>0.18\%$$$. To assess the performance of the proposed methods we computed posterior-cingulate cortex (PCC) correlation maps after GSR and the various approximations. Furthermore, motivated by the GS censoring idea, we partitioned the fMRI data into two temporal subsets that correspond to low $$$(|GS|<0.18\%)$$$ and high $$$(|GS|>0.18\%)$$$ GS magnitudes and examined the PCC map components contributed by each temporal subset.Results
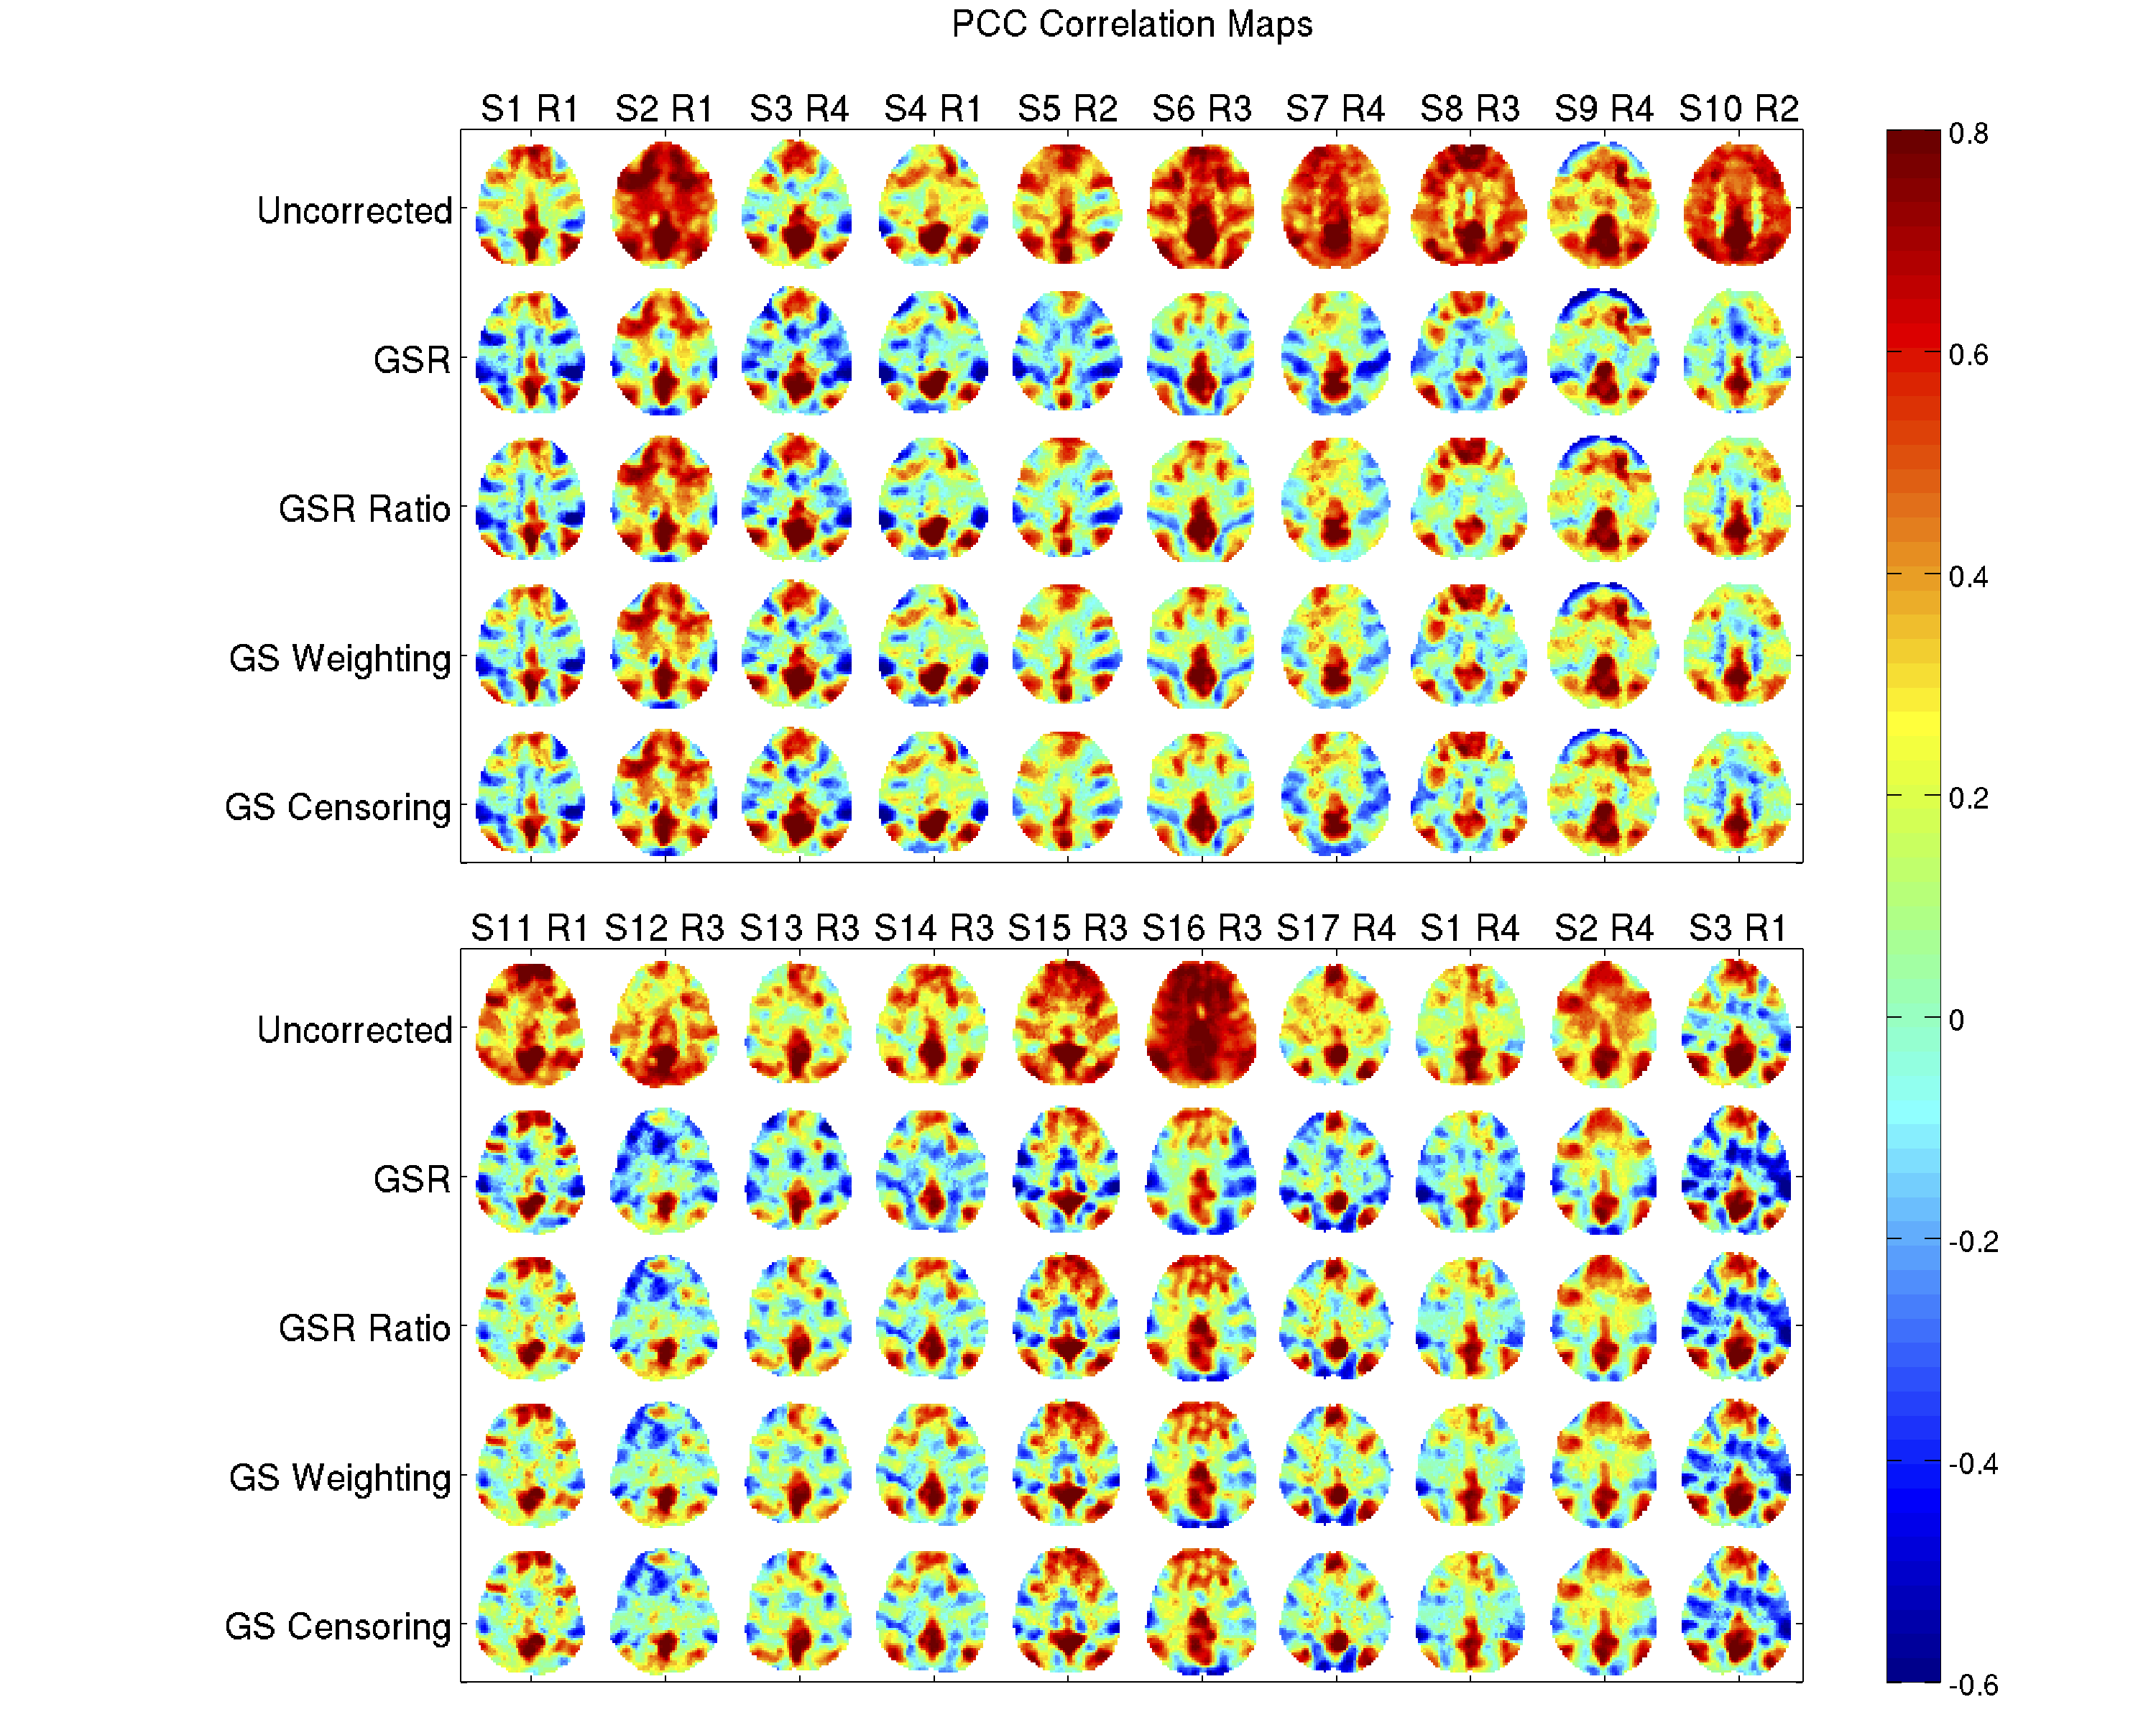
Figure 2 shows the PCC maps for the Uncorrected, GSR, GSR Ratio Weighted, GS Weighted and GS Censored data. We see that the PCC maps obtained with GSR and the proposed approximations are very similar. For a quantitative comparison, we calculated the spatial correlations between the PCC maps after GSR and the proposed approximations for all scans. These correlations had mean values of $$$0.94$$$, $$$0.93$$$ and $$$0.93$$$ when correlating the GSR maps with the GSR Ratio Weighted, GS Weighted and GS Censored maps, respectively, and were significantly greater ($$$p<10^{-6}$$$, paired t-test) than the correlations obtained between uncorrected maps and the maps obtained with the approximations.
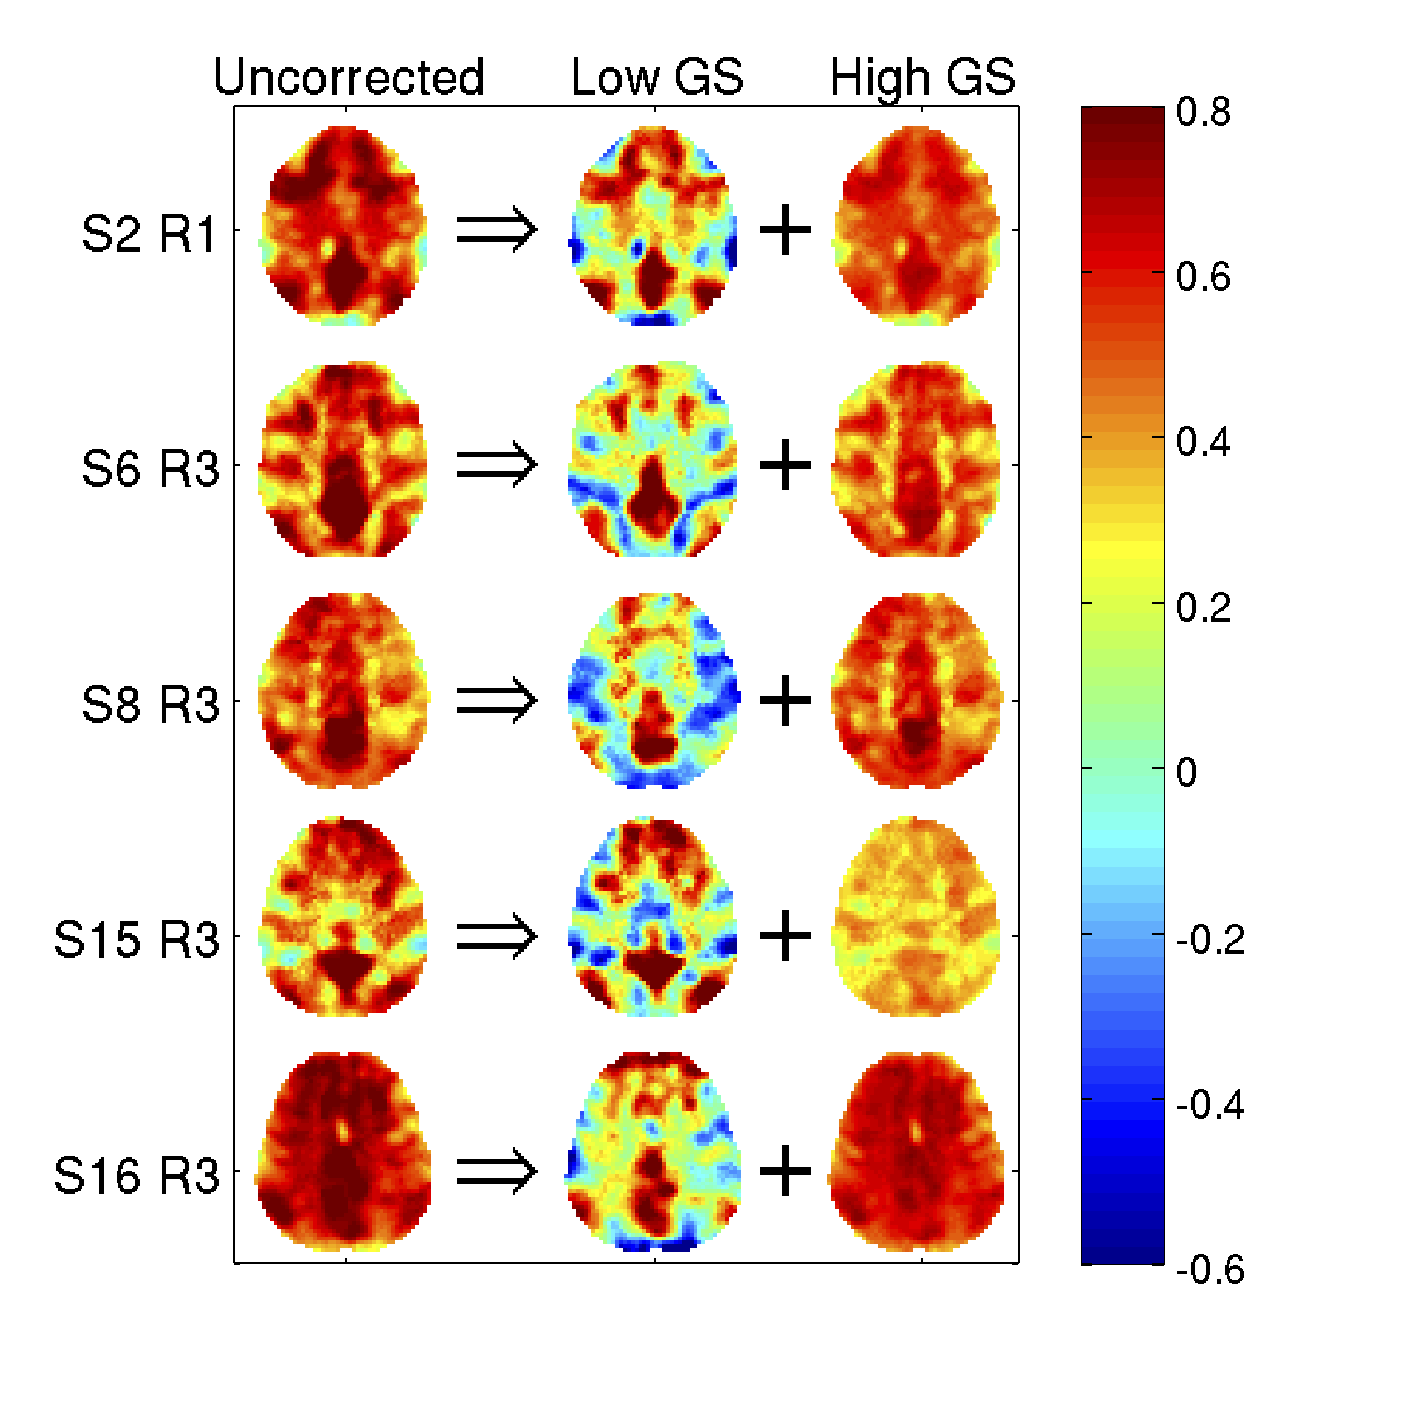
Figure 3 shows the decomposition of uncorrected PCC maps as the sum of the maps from two temporal subsets: a subset with low GS magnitudes (time points retained after GS censoring) and a subset with high GS magnitudes. The anti-correlation between the DMN and TPN is apparent in the maps for the low GS subset. As censoring doesn't alter the data in the low GS subset, this anti-correlation is not simply an artifact of the processing, it inherently exists in the data in the low GS subset.
Discussion
We have shown that the effects of GSR can be well approximated by a temporal downweighting of the voxel time series, where the weighting factor varies with time but is spatially uniform. The weighting factor decreases with GS magnitude so that time points with large magnitudes are greatly attenuated whereas those time points with small magnitudes are largely unaffected. By doing this, we have introduced a simple way of viewing GSR that facilitates a more intuitive understanding of its effects. Finally, our results suggest that the anti-correlations between the DMN and TPN is not simply an artifact of GSR.Acknowledgements
No acknowledgement found.References
1. Murphy, K., Birn, R. M., Handwerker, D. A., Jones, T. B., Bandettini, P. A., Feb. 2009. The impact of global signal regression on resting state correlations: are anti-correlated networks introduced? NeuroImage 44 (3), 893–905.
2. Fox, M. D., Zhang, D., Snyder, A. Z., Raichle, M. E., Jun. 2009. The global signal and observed anticorrelated resting state brain networks. Journal of Neurophysiology 101 (6), 3270–3283.
3. Chai, X. J., Castanon, A. N., Ongur, D., Whitfield-Gabrieli, S., Jan. 2012. Anticorrelations in resting state networks without global signal regression. NeuroImage 59 (2), 1420–1428.
4. Fox, M. D., Snyder, A. Z., Vincent, J. L., Raichle, M. E., 2007. Intrinsic fluctuations within cortical systems account for intertrial variability in human behavior. Neuron 56 (1), 171–184.
5. He, H., & Liu, T. T. (2012). A geometric view of global signal confounds in resting-state functional MRI. Neuroimage, 59(3), 2339-2348.
Figures