1655
On the relation between Global Signal Normalization, Global Signal Subtraction, and Global Signal Regression in Resting-State fMRI1UCSD Center for Functional MRI, La Jolla, CA, United States
Synopsis
In resting-state fMRI, global signal regression (GSR), global signal subtraction (GSS) and global signal normalization (GSN) are widely used nuisance removal methods. So far these techniques have been treated as distinct operations and the relation between them has not been clearly described. In this paper, we mathematically and empirically show that GSS and GSN are nearly identical processes in resting-state fMRI. We further show that in terms of resting-state functional connectivity maps, GSS and hence GSN are similar processes to GSR when considering seed time courses that have a good fit to the global signal time course.
Purpose
In fMRI, the global signal (GS) is often treated as a nuisance term, and a variety of methods have been proposed to remove its effects. The most widely used methods are global signal regression (GSR), global signal normalization (GSN), and global signal subtraction (GSS).1,2,3 These methods have largely been treated as distinct operations and the relation between them has not been clearly described. Here, we show that GSN and GSS are nearly identical processes when applied to resting-state fMRI data. We further show that seed correlation maps for GSN and GSS are similar to GSR when using seed voxels that are similar to GS.Theory
We denote a voxel time series as $$$\mathbf{x}=\tilde{\mathbf{x}}+\mu_{\mathbf{x}}$$$ where $$$\tilde{\mathbf{x}}$$$ is a zero-mean fluctuation term and $$$\mu_{\mathbf{x}}$$$ is a constant mean value. Similarly, the GS is represented as $$$\mathbf{g}=\tilde{\mathbf{g}}+\mu_{\mathbf{g}}$$$, and is computed as the mean time course over all voxels.
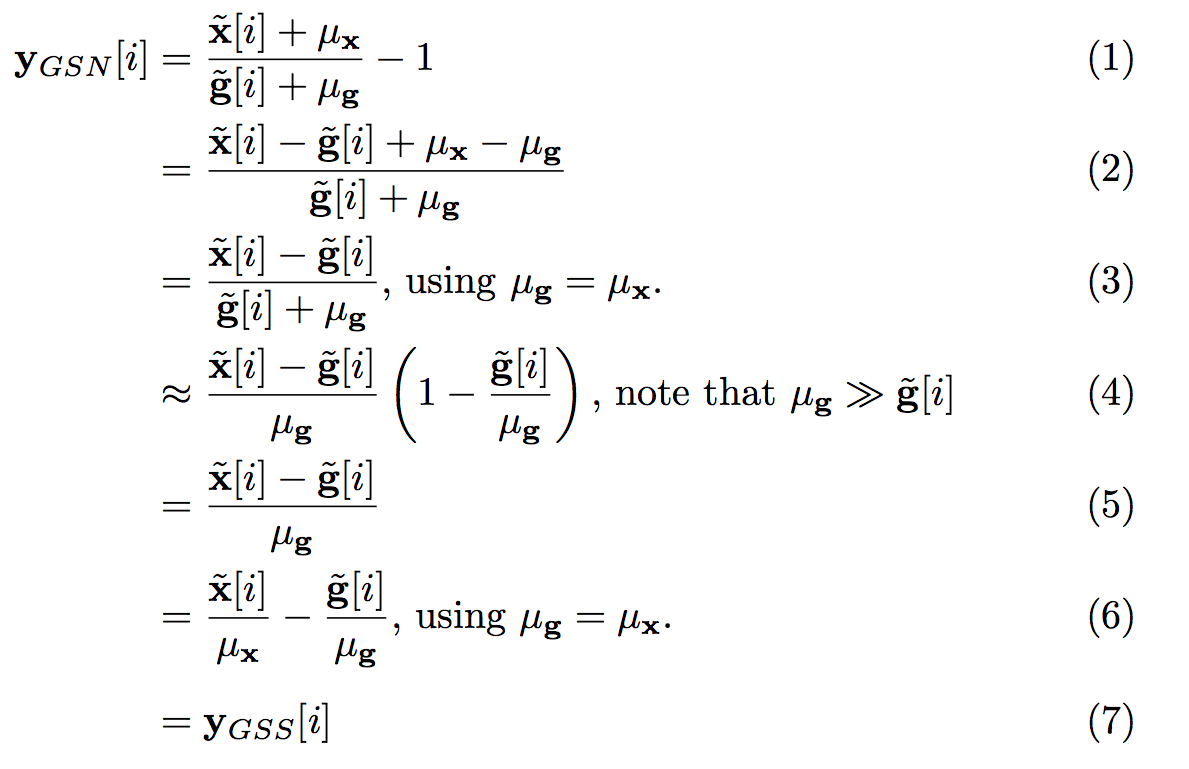
In GSN, the computations are performed prior to removal of the temporal mean from the voxel time series. Data are normalized at each time point by dividing the voxel value by the corresponding GS value and then subtracting 1.0 from the result.2 This approach is defined in line (1) of Figure 1. In lines (3) and (6) we assume that the voxel and global signal means are identical, which can be achieved without loss of generality by scaling the data such that all voxels have the same mean value. In line (4), we assume that the mean component of the GS is much larger than the zero-mean fluctuations, which is the case for most fMRI data. The result (line 6) is simply the difference between the percent normalized signal changes $$$\tilde{\mathbf{x}}[i]/ \mu_{\mathbf{x}}$$$ and $$$\tilde{\mathbf{g}}[i]/ \mu_{\mathbf{g}}$$$.
In GSS, the GS is subtracted from each voxel time series after percent change normalization of the signals. This can be expressed as $$$\mathbf{y}_{GSS}=\tilde{\mathbf{x}}/\mu_{\mathbf{x}}-\tilde{\mathbf{g}}/\mu_{\mathbf{g}}$$$, which is identical to the result derived above, hence $$$\mathbf{y}_{GSN}\approx \mathbf{y}_{GSS}$$$.
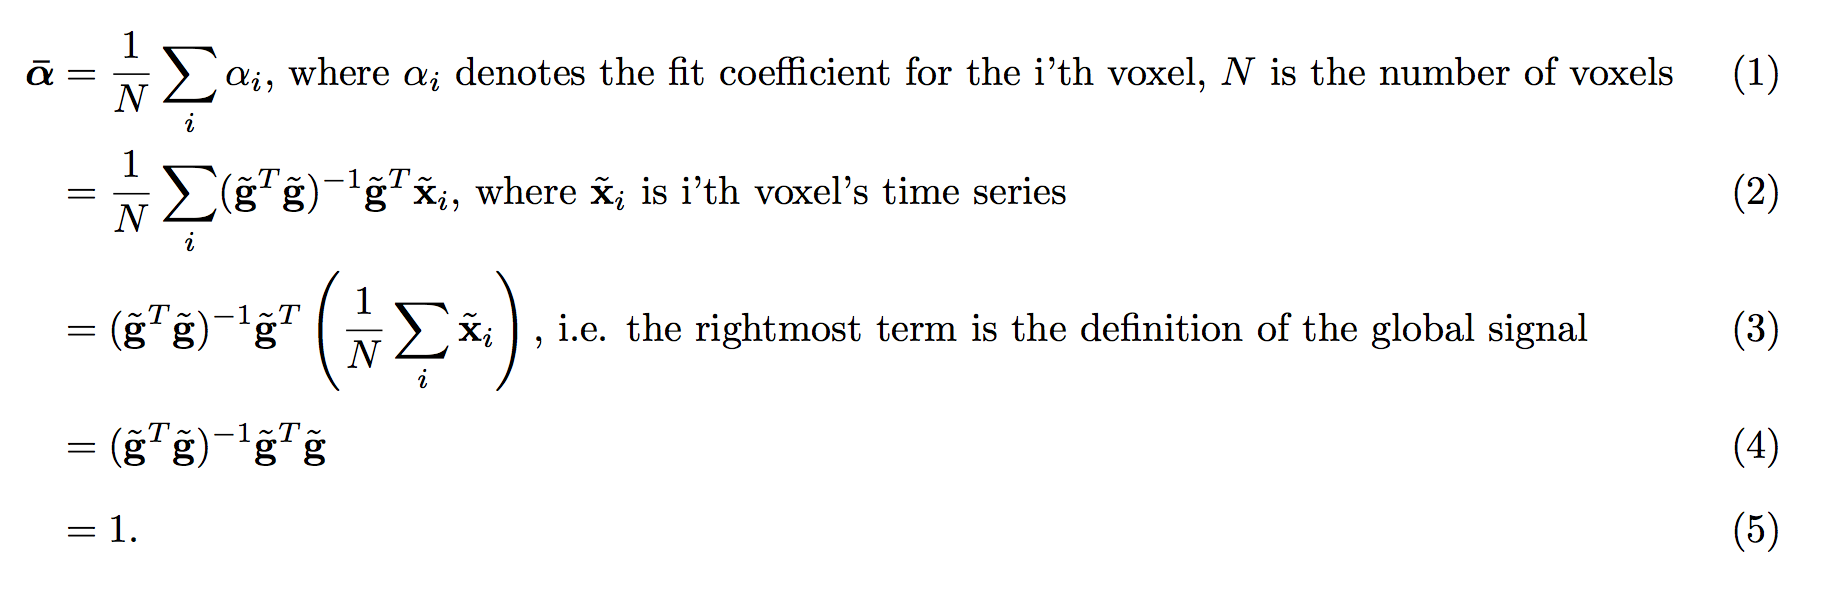
The process of GSR is described as $$$\mathbf{y}_{GSR}=\tilde{\mathbf{x}}-\alpha\tilde{\mathbf{g}}$$$ where the fit coefficient $$$\alpha = (\tilde{\mathbf{g}}^T\tilde{\mathbf{g}})^{-1}\tilde{\mathbf{g}}^T\tilde{\mathbf{x}}$$$. GSR and GSS are equivalent when $$$\alpha=1$$$ (normalization does not affect this equality). As shown in Figure 2, the mean value of alpha (over voxels) is equal to 1.0. For any given voxel, the relation between GSR and GSS will depend on how “close” $$$\alpha$$$ is to 1.0.
Methods
We used the data analyzed in,4 which was acquired from 17 subjects undergoing 4 BOLD-EPI resting-state scans (TR=2.16s, 4x4x4mm, 194 frames/scan). Pre-processing steps are described in.5 To assess the similarity between the approaches, we computed posterior-cingulate cortex (PCC) and white-matter (WM) seed-based functional connectivity maps before and after the application of GSR, GSS, and GSN and compared the spatial correlations between these maps. We further calculated the fit coefficient $$$\alpha$$$ for each seed voxel and examined the relation between the coefficient and the spatial correlation between maps obtained with GSR and GSS.Results
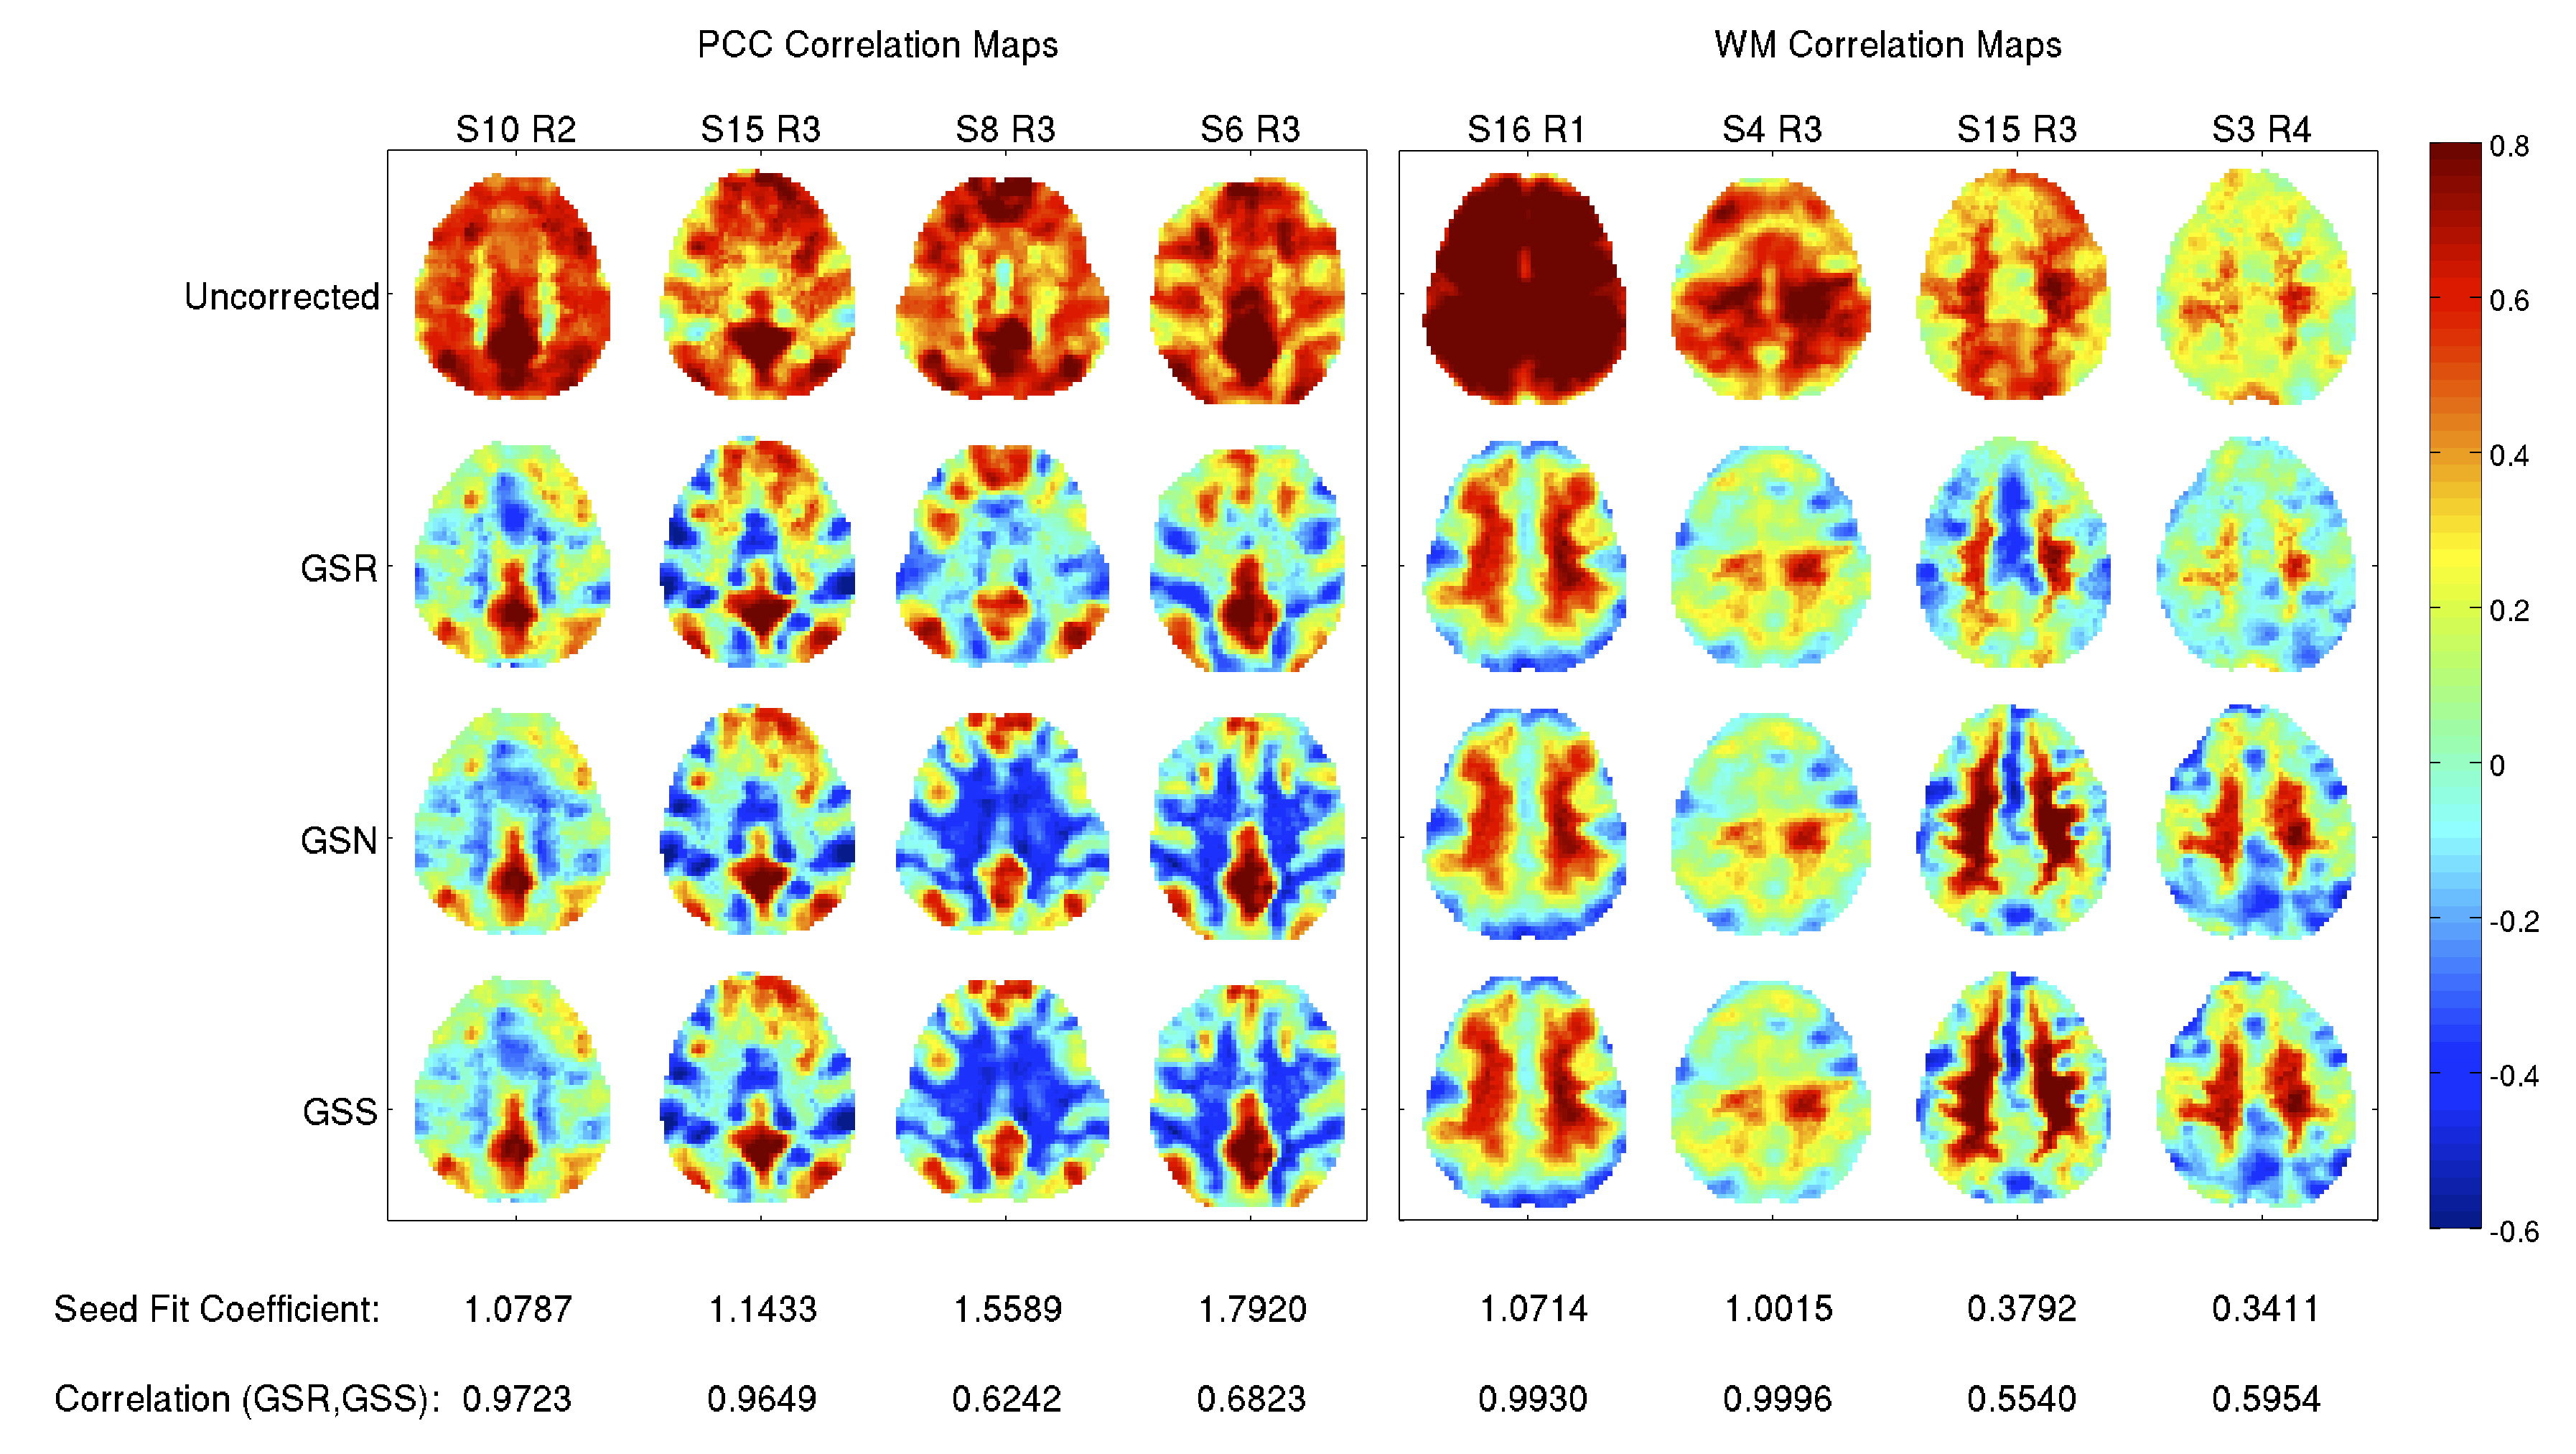
Figure 3 shows representative PCC and WM functional maps obtained after GSR, GSS, and GSN. The maps with GSS and GSN are nearly identical, consistent with the derivation in Figure 1. The mean (over all 68 scans) of the spatial correlations between the PCC and WM maps with GSS and GSN is 0.99 with a small standard deviation (0.003).
In contrast, spatial correlations between PCC maps for GSR and GSS range from 0.62 to 0.99 with a mean of 0.94. For WM maps, the spatial correlations range from 0.37 to 0.99 with a mean of 0.73. As indicated by the fit coefficients and correlation values listed under each column of Figure 3, the degree of similarity depends on the closeness of the fit coefficient to 1.0.
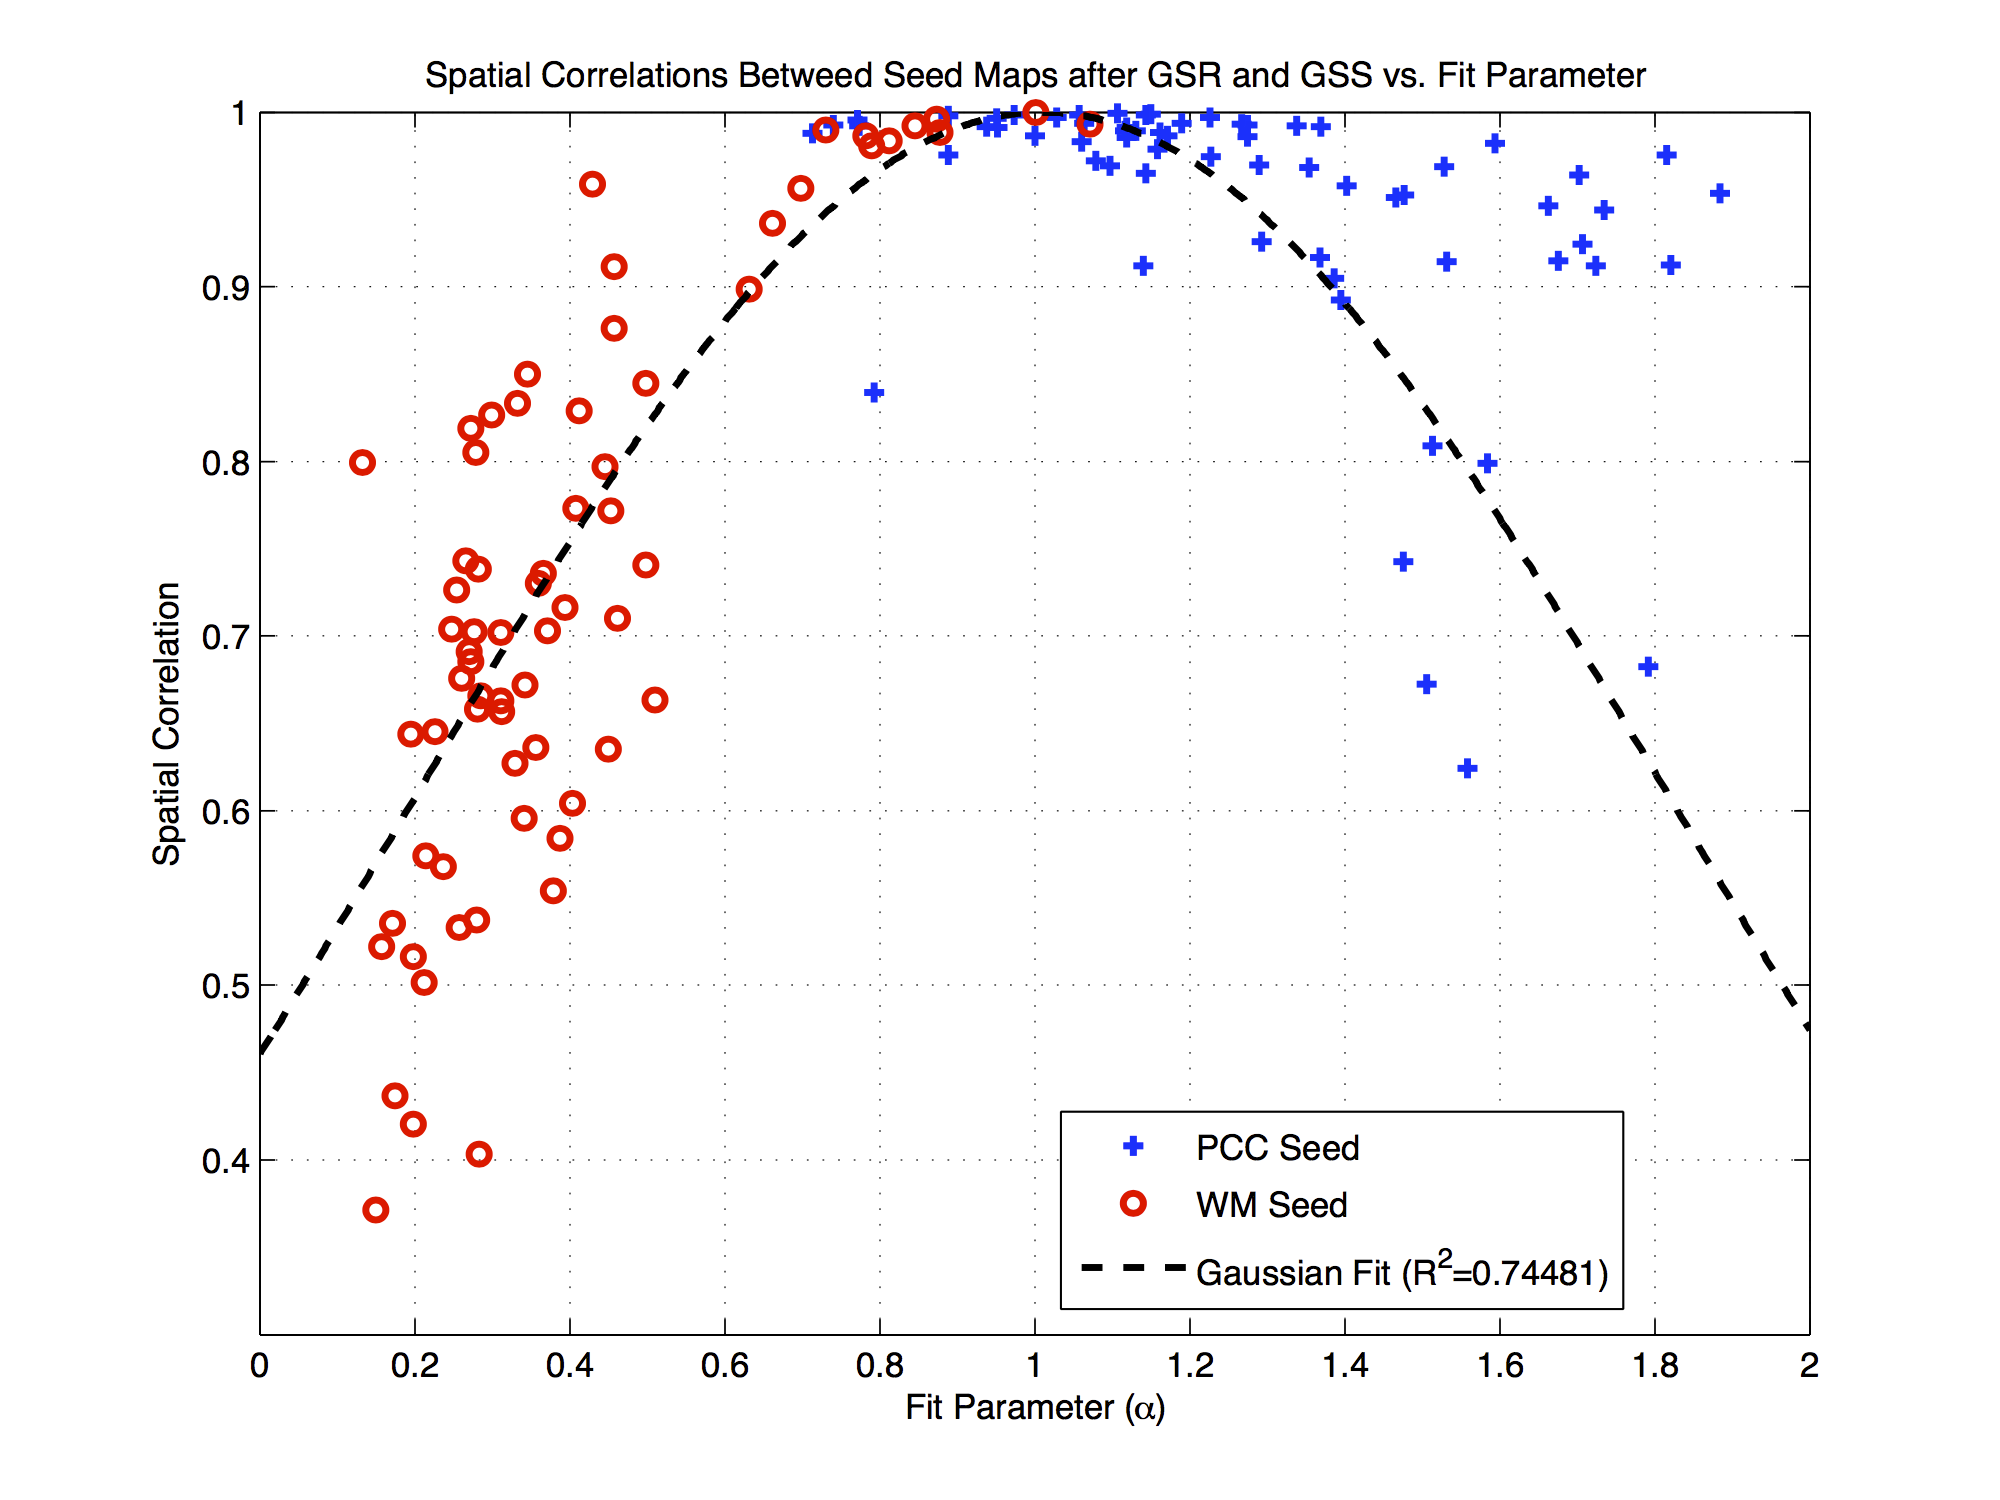
Figure 4 shows the PCC and WM seed fit coefficients versus the spatial correlations between the corresponding connectivity maps obtained after GSR and GSS. As the fit coefficient deviates from the ideal value of 1.0, the spatial correlations decrease sharply for the WM seed and more gradually for the PCC seed.
Discussion
We have shown that the effects of GSS and GSN on resting-state fMRI data are nearly identical. Moreover, we have shown that the effects of GSR are similar to GSS when the GSR fit coefficient is close to 1.0. The similarity between GSR and GSN for PCC maps was previously noted in.2 Given the controversy regarding the use of GSR,1,2 our results suggest that caution must also be exercised when using the other methods, given their similarity to GSR. For instance, in some ICA-based analysis approaches, GSS is used as a pre-processing step.3Acknowledgements
No acknowledgement found.References
1. Murphy, K., Birn, R. M., Handwerker, D. A., Jones, T. B., Bandettini, P. A., Feb. 2009. The impact of global signal regression on resting state correlations: are anti-correlated networks introduced? NeuroImage 44 (3), 893–905.
2. Fox, M. D., Zhang, D., Snyder, A. Z., Raichle, M. E., Jun. 2009. The global signal and observed anticorrelated resting state brain networks. Journal of Neurophysiology 101 (6), 3270–3283.
3. Remes, J. J., Starck, T., Nikkinen, J., Ollila, E., Beckmann, C. F., Tervonen, O., Kiviniemi, V., Silven, O., May 2011. Effects of repeatability measures on results of fMRI sICA: a study on simulated and real resting-state effects. NeuroImage 56 (2), 554–569.
4. Power, J. D., Mitra, A., Laumann, T. O., Snyder, A. Z., Schlaggar, B. L., Petersen, S. E., Jan. 2014. Methods to detect, characterize, and remove motion artifact in resting state fMRI. NeuroImage 84, 320–341.
5. Fox, M. D., Snyder, A. Z., Vincent, J. L., Raichle, M. E., 2007. Intrinsic fluctuations within cortical systems account for intertrial variability in human behavior. Neuron 56 (1), 171–184.
Figures