1653
Optimization of white matter fMRI analysis using physiologically derived hemodynamic response functions1School of Mechatronic Systems Engineering, Simon Fraser University, Surrey, BC, Canada, 2School of Mechatronic Systems Engineering, Simon Fraser University, 3Fraser Health Authority, Surrey, BC, Canada, 4Department of Physics, The University of British Columbia, Vancouver, BC, Canada, 5Department of Radiology, The University of British Columbia, Vancouver, BC, Canada, 6School of Computing Science, Simon Fraser University, Burnaby, BC, Canada, 7School of Engineering Science, Simon Fraser University, Burnaby, BC, Canada
Synopsis
White matter functional MRI has been successfully demonstrated in studies using high-field scanners and customized sequences. In the current study, we demonstrated that conventional GRE EPI using 3T MRI replicated white matter activation in the corpus callosum at both the group and individual levels (61.5% of individuals). Importantly, hemodynamic response functions (HRF) using delayed-onset improved sensitivity to white matter activation over the canonical HRF developed from gray matter activity. The results suggest that white matter fMRI studies, which are increasingly reported in the literature, benefit significantly from optimization in acquisition and analysis methods.
Purpose
1) To detect functional MRI activation in corpus callosal white matter using standard 3T GRE-EPI. 2) To investigate the sensitivity to modified hemodynamic response functions (HRF) of WM activation.Methods
Subjects: Thirteen healthy, right-handed volunteers participated in the study (7M/6F, age = 24.4±2.4 years, education = 4.17±1.03 years post-secondary).
fMRI tasks: Participants performed the Sperry task1 to stimulate visual-motor interhemispheric transfer. Lateralized stimuli of words and faces were presented beside fixation for 150ms2 in the left or right visual hemifield (Presentation 15.0, Neurobehavioral Systems, Berkeley, USA). The stimuli were presented in blocks, 22s active, 18s rest. Participants responded via button boxes, using left or right index or middle finger to classify the stimulus.
Data acquisition: MR data were acquired using a 3T Philips Achieva MRI, with an 8-channel, SENSE head coil. Functional data were captured using a single-shot GRE-EPI sequence (35 transverse, 3mm thick, contiguous slices were collected in interleaved order, with 3mm isotropic resolution (TE = 30ms, flip angle = 90°, TR = 2000ms). Total field of view of 288mm RL x 288mm AP x 139mm FH, oriented to cover the entire brain. 3D T1-weighted structural images for co-registration consisted of 109 contiguous 1mm slices, with a 1mm isotropic voxels (TE = 3.7ms, flip angle = 8°, TR = 8.1ms).
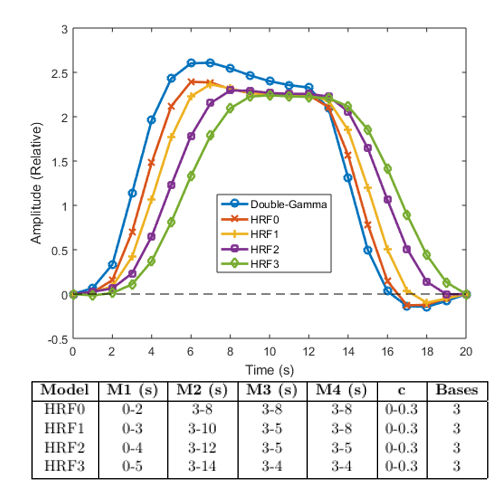
Data analysis: Data were analyzed using FMRIB Software Library 5.0.93. General linear model predictors were constructed using a double-gamma HRF as well as waveforms generated from FLOBS. These included an FSL “optimal” HRF, and three HRF bases with increased onset times (Figure 1). Cluster corrected thresholding was applied at Z>2.3 and Z>2.0 (P = 0.05, corrected). Individual functional data were registered to respective structural images and MNI152 space using FLIRT and FNIRT4.
Results
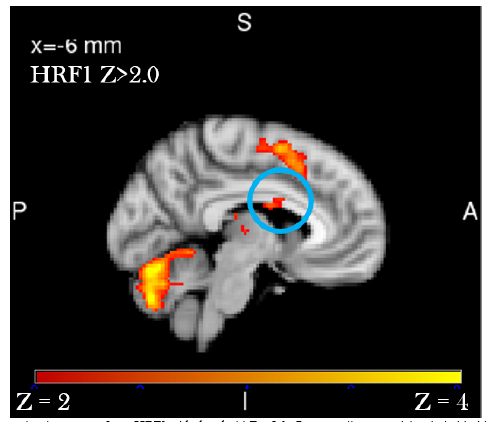
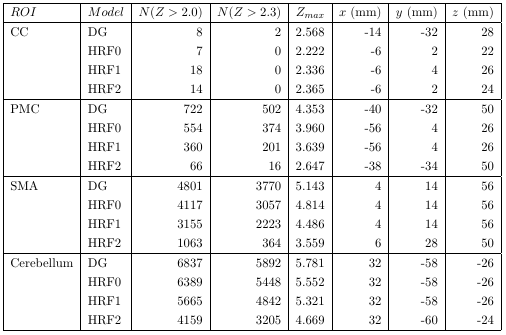
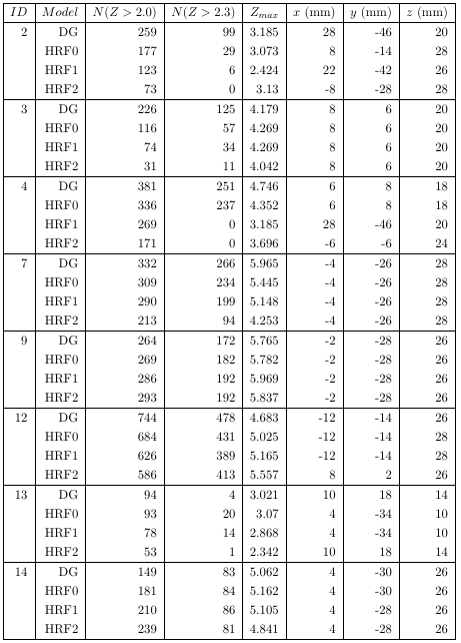
Group level results indicated whole-brain activation consistent with previously reported results5 using the Sperry task at thresholds of Z > 2.3. Gray matter activity is present in the cerebellum, superior and lateral occipital cortices, temporo-occipital fusiform, inferior frontal gyri, motor and premotor cortices (Figure 2, Table 1). Statistically significant white matter activation in corpus callosum ROI was found in the analysis using Z>2.0 thresholding, with a peak Z score of 2.57. Activation was localized to the same anterior mid-body corpus callosum region as previously reported6. Of the 13 individuals tested, eight indicated some activation in the corpus callosum (61.5%). Table 2 shows the individual level extent and peak of activation in the corpus callosum. Figure 3 shows the activation of the 8 individuals.
Modification of the HRF with delayed response onset was associated with an increased sensitivity in detecting WM activation (Figure 3 Panel A), which was also revealed from the time course data (Figure 3, Panel B). In contrast, a similar change was not observed in the gray matter (Figure 3, Panel B). When decreasing the onset slope of the HRF, all gray matter regions showed decreased sensitivity in voxel count and Z score maximum. HRF’s with delayed onset yielded larger voxel count and consistent Z maxima in the corpus callosum.
Discussion
In the current study, gray matter fMRI activation was consistent with task design and replicated previous reports1,7. Similarly group and individual level white matter fMRI activation replicated prior studies,7 with corpus callosum activation detected in 61.5% of individuals, for all HRF models except HRF3. The percentage of detection is weaker than the 100% reported using 4T and the specialized asymmetric spin echo sequences6, but more successful than the earliest studies of 21% using 4T and conventional spirals5.
Sensitivity to white matter fMRI activation also appeared to be dependent on the modeled hemodynamic response function. By varying the hemodynamic response function, it was possible to improve sensitivity to white matter activation in terms of both extent and intensity. With some differing reports speculating about potential differences in underlying hemodynamic response in white matter8,9, the current evidence suggests that more detailed examination is needed.
Conclusion
We replicated white matter fMRI activation in the corpus callosum using standard GRE EPI in 3T MRI. As with prior work, the predicted corpus callosum activation was detectable at both the group and individual levels (61.5%). However, through examination of the hemodynamic response function model, it was possible to increase sensitivity to white matter activation. The results suggest that it is possible to optimize both acquisition and analysis methods to characterize white matter fMRI activity.Acknowledgements
The authors would like to thank NSERC for funding this study.References
1. D’Arcy, R. C. N., Hamilton, A., Jarmasz, M., Sullivan, S. & Stroink, G. Exploratory data analysis reveals visuovisual interhemispheric transfer in functional magnetic resonance imaging. Magn. Reson. Med. 55, 952–8 (2006).
2. Gezeck, S., Fischer, B. & Timmer, J. Saccadic reaction times: a statistical analysis of multimodal distributions. Vision Res. 37, 2119–2131 (1997).
3. Jenkinson, M., Beckmann, C. F., Behrens, T. E. J., Woolrich, M. W. & Smith, S. M. FSL. Neuroimage 62, 782–790 (2012).
4. Jenkinson, M. & Smith, S. M. A global optimization method for robust affine registration of brain images. Med. Imaging Anal. 5, 143–156 (2001).
5. Mazerolle, E. L., D’Arcy, R. C. N. & Beyea, S. D. Detecting functional magnetic resonance imaging activation in white matter: interhemispheric transfer across the corpus callosum. BMC Neurosci. 9, 84 (2008).
6. Gawryluk, J. R., D’Arcy, R. C. N., Mazerolle, E. L., Brewer, K. D. & Beyea, S. D. Functional mapping in the corpus callosum: A 4T fMRI study of white matter. Neuroimage 54, 10–15 (2011).
7. Fabri, M., Polonara, G., Mascioli, G., Salvolini, U. & Manzoni, T. Topographical organization of human corpus callosum: an fMRI mapping study. Brain Res. 1370, 99–111 (2011).
8. Tae, W. S., Yakunina, N., Kim, T. S., Kim, S. S. & Nam, E.-C. Activation of auditory white matter tracts as revealed by functional magnetic resonance imaging. Neuroradiology 56, 597–605 (2014).
9. Fraser, L. M.,
Stevens, M. T., Beyea, S. D. & D’Arcy, R. C. N. White versus gray matter:
fMRI hemodynamic responses show similar characteristics, but differ in peak
amplitude. BMC Neurosci. 13, 91 (2012).
Figures