1652
Optimal resolution for searchlight classification of BOLD fMRI data.1Advanced MRI section, LFMI, NINDS, National Institutes of Health, Bethesda, MD, United States
Synopsis
Information-theoretic approaches to BOLD fMRI analysis, like the Searchlight method for multivariate pattern analysis (MVPA), suggest that distinctive local patterns of BOLD signal on a spatial scale of millimeters carry information that allows the classification or decoding of perceptual stimuli. In this study high-resolution (1.2mm) BOLD fMRI experiments at 7T combined with naturalistic movie stimuli reveal that Searchlight decoding primarily relies on a neurogenic BOLD signal that is spatially smooth, unlike the accompanying physiological artifacts. As a result the optimal fMRI resolution peaks between 2 and 4mm, a voxel size well above the technical limits of fMRI.
Introduction
Conventional univariate BOLD fMRI analysis relies on an a-priori model of the hemodynamic response to predefined stimulus features. The alternative Searchlight (SL) method [1] relies on fewer assumptions and infers local information content from multivariate BOLD signal statistics. It has been hypothesized that higher spatial fMRI resolution would increase SL classification accuracy (CA) allowing better discrimination between different stimuli. Here we investigate the effect of fMRI resolution on the sensitivity of SL analysis using several machine-learning (ML) classifiers and a variety of visual stimuli presented as a movie.
Methods
Four healthy volunteers underwent fMRI and simultaneous eye tracking while watching a 5-minute scene from a popular action movie repeatedly i.e. 16 times over the course of 4-6 scan sessions. For each experimental run fMRI data were acquired either at a high (1.2mm) or a low (2mm) fMRI resolution on a 7T MRI scanner equipped with a 32-channel receive head coil using a TR of 2s and typical single-shot EPI sequence parameters. Various amounts of Gaussian smoothing were additionally applied to mimic lower resolutions. All data analysis was done using custom code in Matlab supplemented by tools from AFNI and FSL. The fMRI data from each experimental run underwent motion correction, alignment to the subject's T2-weighted anatomical scan and resampling to an isotropic resolution of 1.2mm. Motion parameters and trends up to 2nd order were regressed out before normalizing the variance of each voxel time series. ML classifiers known as Nearest Neighbor (NN), Gaussian Naïve Bayes (GNB) and Linear Discriminant Analysis (LDA), based on the correlation distance, the standardized Euclidean and the Mahalanobis distances respectively, were used to determine the classification accuracy (CA) in discriminating each of the 150 time points (300s/TR) in the movie using a leave-one-experiment-out cross-validation scheme. The classification analysis was performed separately for each voxel location using a neighborhood of 1-5 voxels in each direction as input features. The resulting CA was assigned to the center voxel of this cubic searchlight volume of (3.6-13.2mm)^3 thus forming a searchlight map. The principal components and spatial Fourier spectra of Searchlight volumes were analyzed to reveal the link between local CA and fMRI resolution or smoothing.
Results & Discussion
Figure 1: Searchlight CA decreased with decreasing SL volume, yielding mostly insignificant CA for SL radii <(6mm)^3 in both HR and LR data. For SL volumes >(1cm)^3 CA in most cortical locations increased with increasing voxel size. Gaussian smoothing had a similar effect. These findings were consistent with previous results, which showed a maximum in CA for classifiers operating on 20% of all visually activated voxels across the entire ventral visual stream and at a moderate fMRI resolution of 2-3mm [2]. For intermediate SL volumes (6-9mm)^3 CA and fMRI resolution effects varied systematically between brain regions, subjects and experimental runs: a) Searchlight CA maps showed hotspots in early visual areas V1-4 and V5/hMT. b) Positive resolution effects CA(HR)-CA(LR) were mostly observed in primary visual cortex V1-4. Figure 2: SL volumes (locations) that yielded a higher CA with higher fMRI resolution (HR>LR) exhibited more leading PCs that were spatially smooth and fewer that were spatially variable like PC#6 in this example. Figure 3: Conversely, Searchlight PCs that had reproducibility (i.e. high CNR across experimental runs) tended to be of low spatial frequency. At the same time, Searchlight volumes that were dominated by low spatial frequencies tended to support high CA. Figure 4: Gaussian smoothing to 3mm FWHM yielded the highest CA in locations of significant baseline CA.
Conclusions
Searchlight classification accuracy relies primarily on fMRI signal patterns on a large spatial scale above 2mm, with a possible exception of retinotopically organized early visual cortex. PCA of local fMRI signal patterns suggests that reproducible neuronal contributions were spatially auto-correlated and smooth, but the optimal resolution for information extraction depended on the relative strength of physiological artifact and noise components of high spatial frequency.
Acknowledgements
This research was supported by the Intramural Research Program of the NIH, NINDS.References
[1] Kriegeskorte, N. (2006), 'Information-based functional brain mapping', PNAS, 103(10):3863–3868
[2] Mandelkow et al. (2015), 'Classifiers for the BOLD fMRI response to movies', Poster presented at the 21st Annual Meeting of the Organization for Human Brain Mapping in Honolulu, USA.
Figures
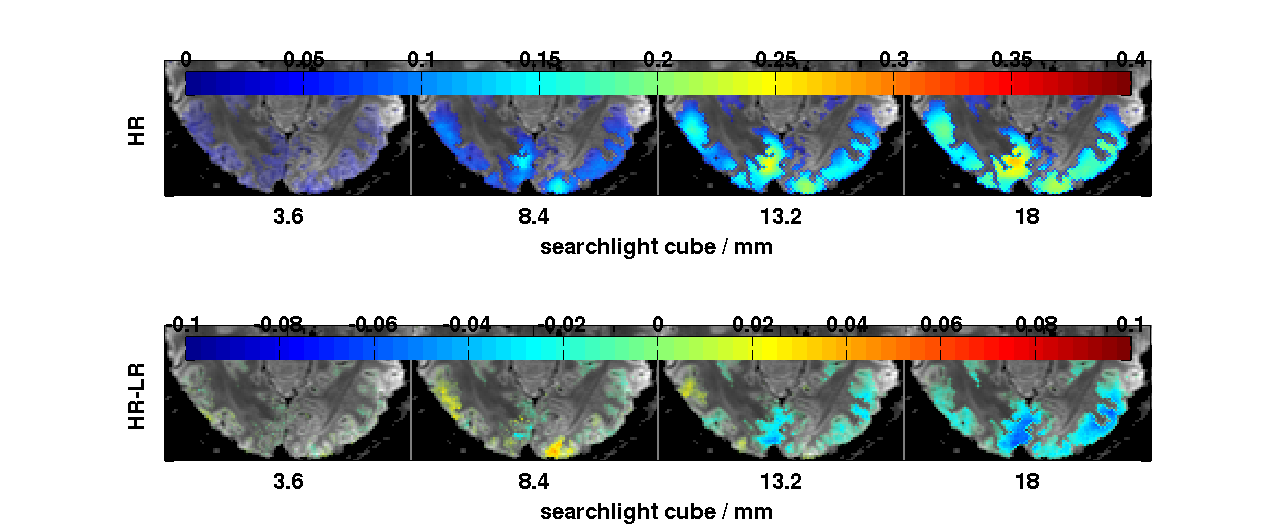
Figure 1: CA maps for SL volumes of (3.6 – 18mm)^3
Top: Searchlight (SL) classification accuracy (CA) = fraction of correctly classified stimuli from 8 scans of high-resolution (HR) data (one slice from one representative subject). Bottom: Difference in CA between high- and low-resolution fMRI data (HR-LR).
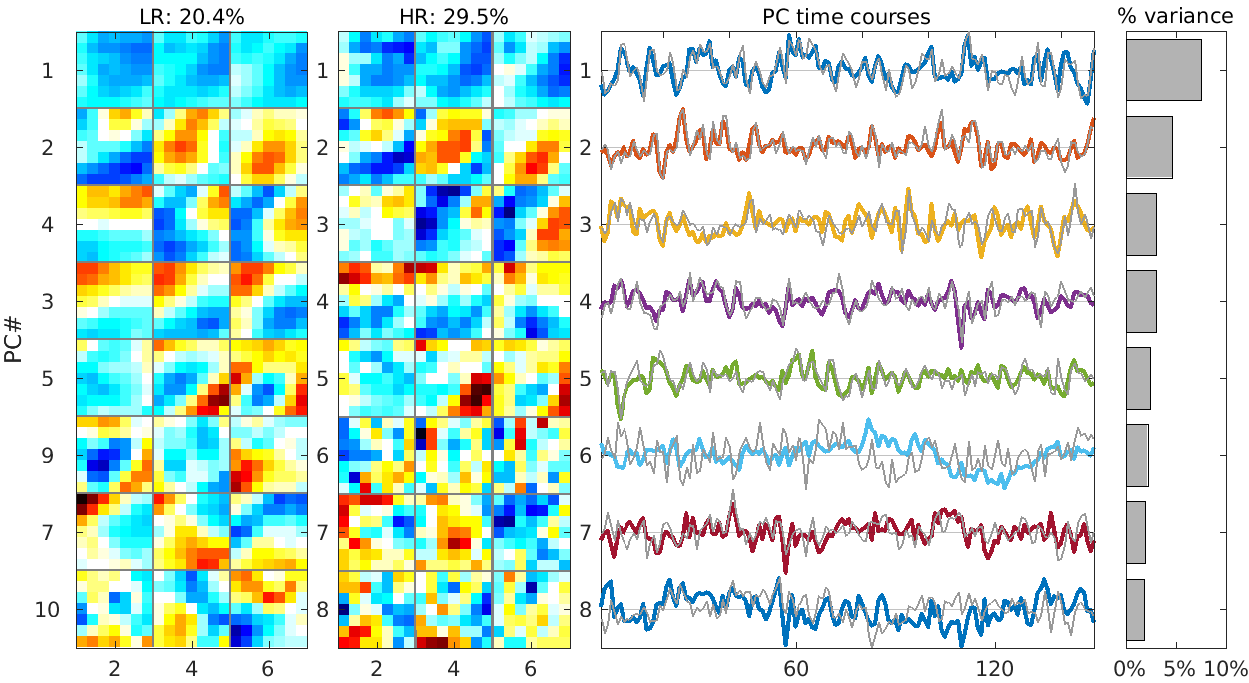
Figure 2: Searchlight PCA
The stimulated (reproducible) fMRI signal is smooth both in 2mm (LR, left) and 1.2mm (HR, middle) fMRI data, but (physiological) noise and (motion) artifacts (in HR) are not (see PC#6). The relative weight (variance) of these artifact components determines the optimal resolution for SL CA in each location, here HR(29%)>LR(20%).
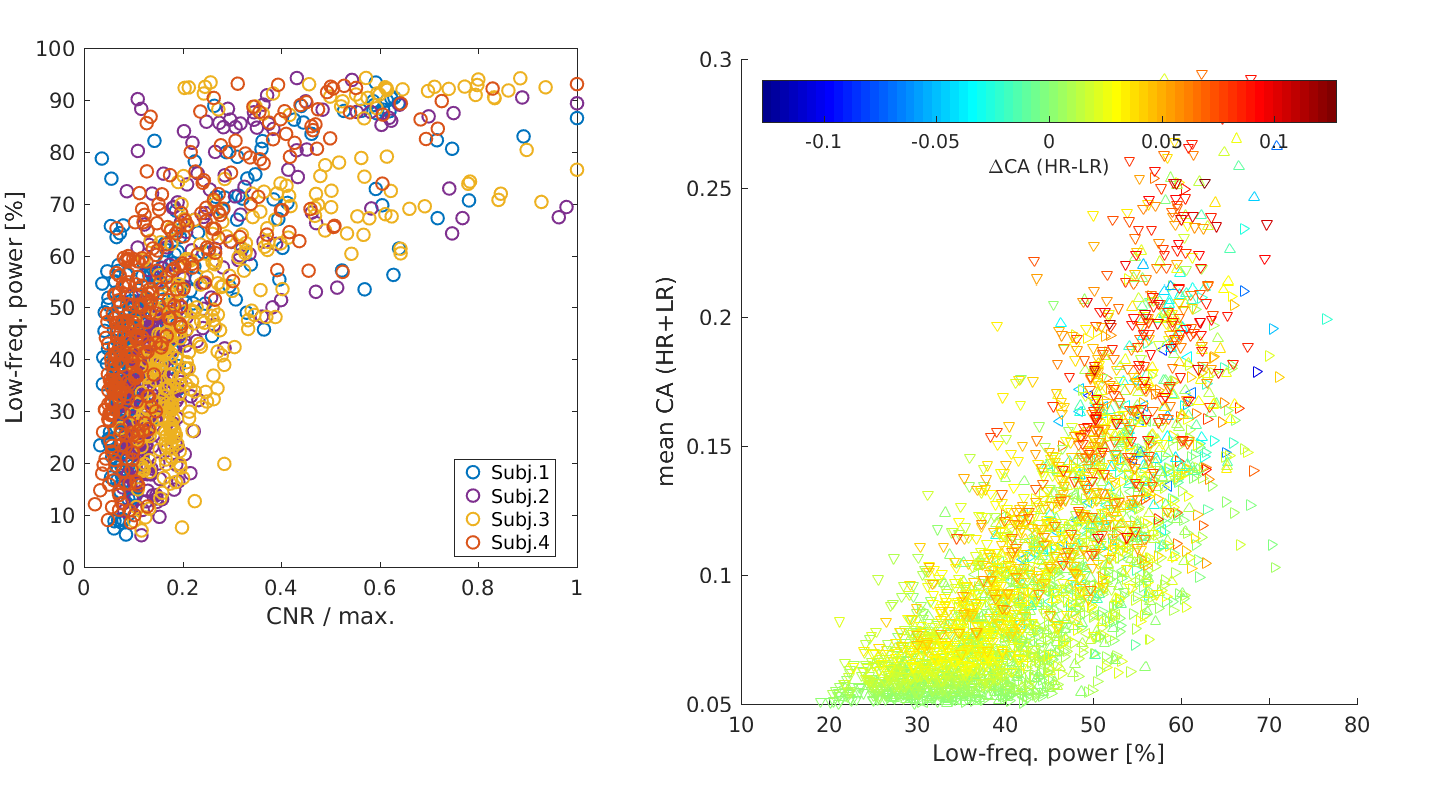
Figure 3 Spectral power at low spatial frequencies correlates with CA and PCs of high reproducibility.
Left: Searchlight PCs that have high reproducibility i.e. CNR (x-axis) across experimental runs tend to be of low spatial frequency (y-axis). (One dot per SL location, PC and subject) Right: At the same time, Searchlight volumes that are dominated by low spatial frequencies (x-axis) tend to support high classification accuracy (y-axis). (One dot per SL location and subject.)
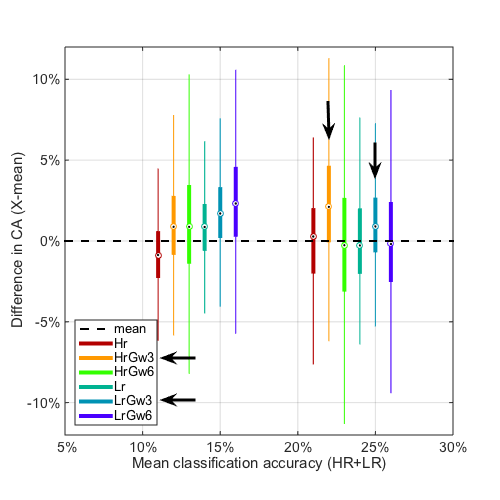
Figure 4 SL CA peaks around 3mm resolution
Boxplot summary of CA changes for HR and LR data with smoothing to 0,3,6mm FWHM (legend:Gw3,6) in all SL locations and subjects stratified in two groups by high and low baseline CA (10%<CA and 20%<CA).