1651
Improved specificity of high-resolution fMRI with surface-based cortical ribbon smoothing1Martinos Imgaing Center, MGH/Harvard, Charlestown, MA, United States, 2Orchard Scientific, Somerville, MA, United States, 3Division of Health Sciences and Technology, Harvard-MIT, Cambridge, MA, United States
Synopsis
High-resolution fMRI data enables strategies to improve spatial specificity of the measured fMRI activations through anatomically-informed sampling. Here we demonstrate that cortical surface-based smoothing of high-resolution data can improve the specificity of fMRI activations by simultaneously canceling thermal noise through spatial averaging while avoiding physiological noise contamination from superficial CSF and signal dilution from subjacent white matter. By combining both tangential and radial smoothing using our surface-based analysis framework, specificity of responses to a breathold challenge can be similar in high-resolution data natively sampled at 1.1 mm iso. and unsmoothed data at a conventional resolution of 3.0 mm iso.
Introduction
Introduction: Volume-based smoothing of fMRI data has been shown to introduce mislocalization of the activation (1), for this reason anatomically-constrained surface-based smoothing approaches have been suggested (2–4). The spatial specificity of fMRI activation has been shown to increase in voxels sampling deep within the cortical gray matter ribbon away from the pial vasculature (5) and fMRI analysis approaches that remove those voxels intersecting the pial surface (i.e., “no-pial” sampling) have been proposed to improve spatial fidelity (6). However, including deep cortical voxels that partially include subjacent white matter tissue should also be avoided, because no fMRI activations are expected within the white matter (WM). We previously demonstrated that appropriate “laminar” and “columnar” surface-based smoothing high-resolution fMRI data using steerable smoothing kernels can provide higher sensitivity (higher time-series SNR) than natively low-resolution fMRI data, through restricting the 3D smoothing to follow the cortex and avoid noise contributions from superficial CSF (7). Here we utilize this anatomically-informed spatial smoothing framework to investigate the effect of different smoothing kernels on signal specificity in task-driven fMRI data.Methods
Four volunteers (2F/2M, 26±3yo) were imaged on a whole-body 7T scanner (Siemens Healthineers, Erlangen, Germany) using four gradient-echo EPI BOLD fMRI protocols with isotropic spatial resolution: 1.1, 1.5, 2.0 and 3.0 mm. During each of the runs, subjects performed a task consisting of four 16-s long breath-holds preceded by paced breathing. Same-session 0.75 mm isotropic FOCI-MEMPRAGE data (7,8) were acquired (Table 1) for cortical surface reconstruction using Freesurfer. A surface-based cortical depth analysis was applied as previously described [8]. Surface-based smoothing along the tangential direction was performed using a method presented previously (11) on each cortical depth separately with different sizes of vertex neighborhood (NB=1-6). In addition, smoothing along the radial direction was performed, resulting in a ‘wine-cork’ smoothing which combines tangential smoothing with radial smoothing across depths. Two ‘wine-cork’ approaches were used: WC-00 extended from 0% (WM) towards the pial surface, WC-05 from mid-layer (50%) and extended towards WM and pial surfaces. GLM analyses were performed using feat (FSL) (9). Resulting z-statistic, ∆S/S and contrast variance (√varcor) values were projected onto the surfaces, and masked to remove brain regions affected by geometric distortion (10).Results
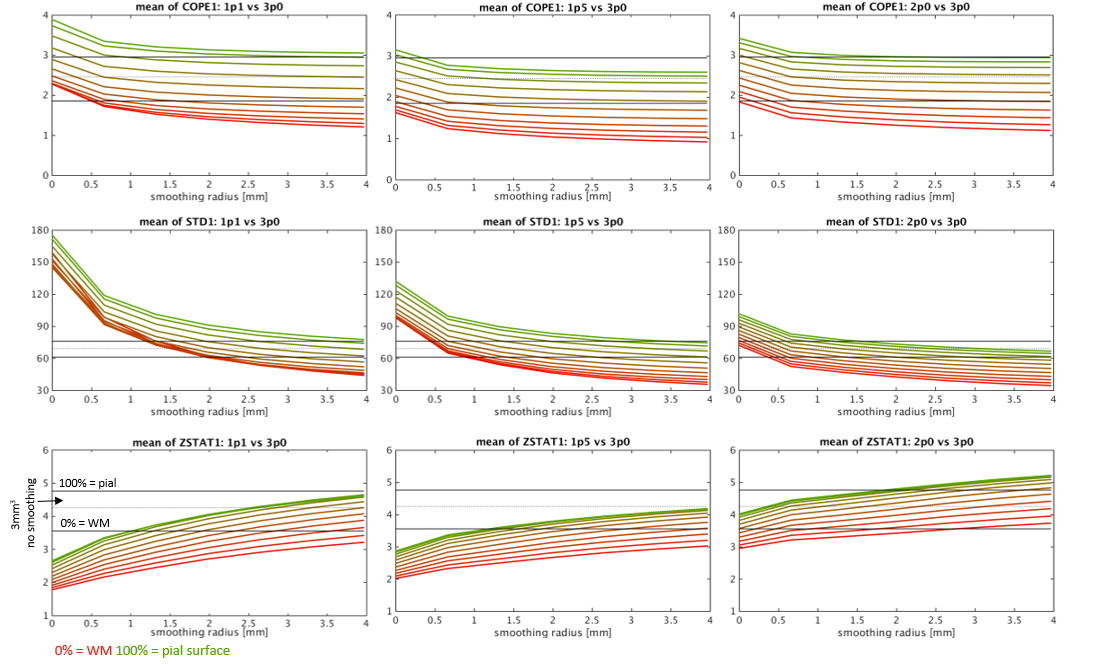
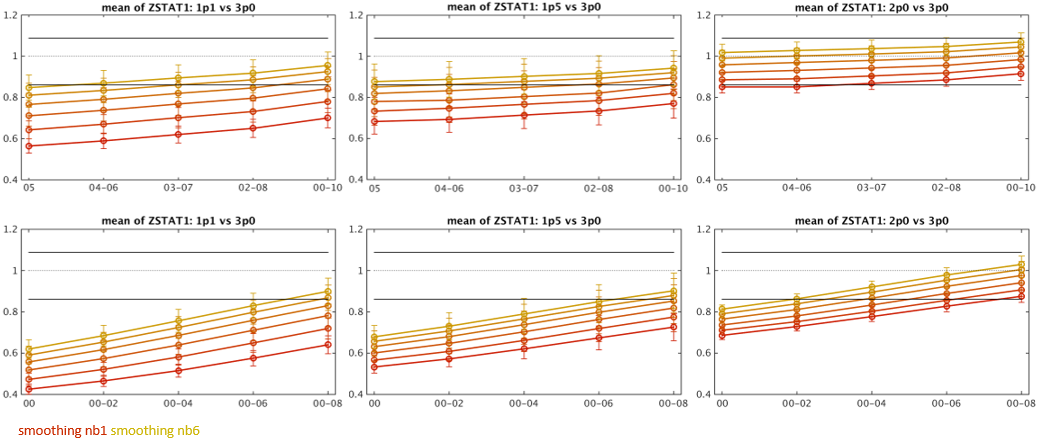
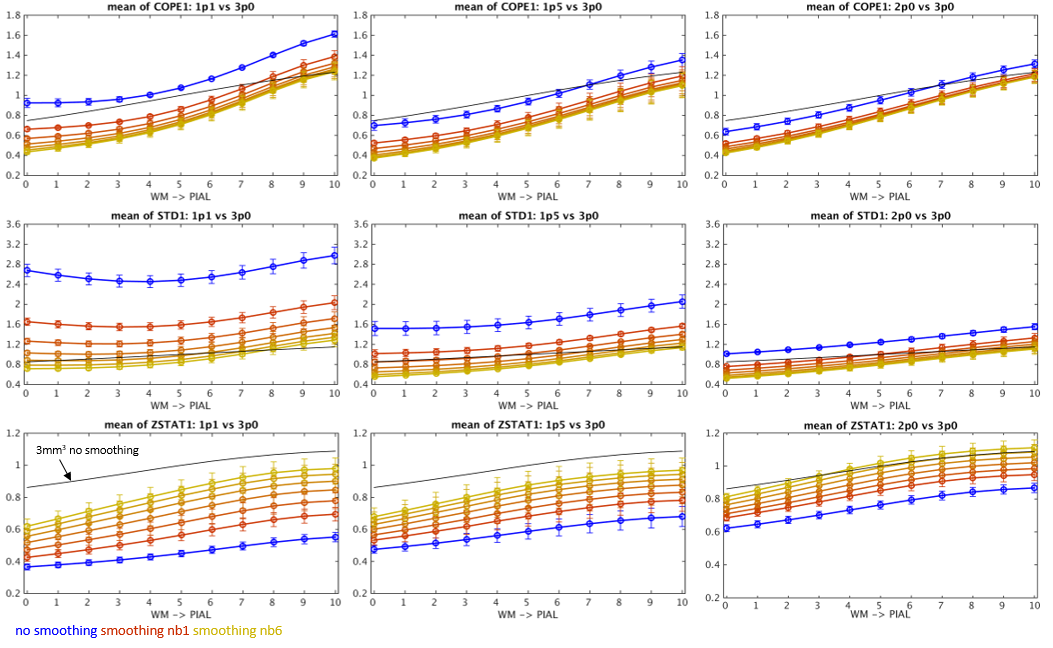
Example ∆S/S, contrast variance and z-statistic values obtained for all data resolutions against laminar smoothing radius are presented in Figure 2 for a representative subject. Figure 3 summarizes these results by presenting means across all the subjects for original (non-smoothed) data and six laminar smoothing kernel radii. While tangential smoothing improves the z-statistic of the high-resolution data, it is not sufficient to increase the values to the level of the low-resolution 3.0 mm data. The results of WC-00 and WC-05 smoothing are presented in Figure 4 for six laminar smoothing radii and five different radial kernel extents. By combining tangential smoothing radius of 2 mm and a radial smoothing radius of approximately 3 mm (i.e. a smoothing kernel volume of 37 mm3), anatomically-informed smoothing can provide similar z-statistics in the 1.0 mm data to those seen in conventional 3.0 mm3 resolution data.Discussion
We showed that application of surface-based smoothing kernel to high-resolution fMRI data can provide signal specificity at the level of low-resolution, un-smoothed data through avoiding the WM signal dilution, leading to increased spatial specificity. ∆S/S decreased slightly with application of a larger laminar smoothing kernel, however the lower slope of the noise variance trend with tangential smoothing leads to a trend of increased z-statistics with smoothing. Interestingly, the 1.5 mm3 data achieved lower z-statistic values than 1.1 mm3 which can be potentially explained its smaller contribution of thermal (vs. physiological) noise. The increase of the z-statistic with smoothing approaches the level of z-statistic calculated for the 3.0 mm3 data, and is higher further from the WM boundary. Application of WC- smoothing kernels allows further improvement of z-statistic which reaches values recorded for deep layers of the cortex in 3.0 mm data while using a kernel of laminar radius ∼2 mm and 100% of the cortical ribbon extent. This approach allows design of an appropriate smoothing kernel avoiding the proximity of the pial surface and/or WM in order to maximize specificity of fMRI activation detection within the cortical gray matter while avoiding spatial localization errors caused by unconstrained 3D smoothing.Acknowledgements
Supported by NIH NIBIB P41-EB015896 and R01-EB019437, NIMH R01-MH111419 (BRAIN Initiative), the Athinoula A. Martinos Center for Biomedical Imaging, and made possible by NIH NCRR Shared Instrumentation Grants S10-RR023401, S10-RR023043 and S10-RR020948.References
1. Andrade A, Kherif F, Mangin J-F, Worsley KJ, Paradis A-L, Simon O, Dehaene S, Le Bihan D, Poline J-B. Detection of fMRI activation Using Cortical Surface Mapping. Hum. Brain Mapp. 2001;12:79–93.
2. Jo HJ, Lee JM, Kim JH, Shin YW, Kim IY, Kwon JS, Kim SI. Spatial accuracy of fMRI activation influenced by volume- and surface-based spatial smoothing techniques. NeuroImage 2007;34:550–564.
3. Jo HJ, Lee J-M, Kim J-H, Choi C-H, Kang D-H, Kwon JS, Kim SI. Surface-based functional magnetic resonance imaging analysis of partial brain echo planar imaging data at 1.5 T. Magn. Reson. Imaging 2009;27:691–700.
4. Kiebel SJ, Goebel R, Friston KJ. Anatomically Informed Basis Functions. NeuroImage 2000;11:656–667.
5. Polimeni JR, Fischl B, Greve DN, Wald LL. Laminar analysis of 7T BOLD using an imposed spatial activation pattern in human V1. NeuroImage 2010;52:1334–1346.
6. Ahveninen J, Chang W-T, Huang S, Keil B, Kopco N, Rossi S, Bonmassar G, Witzel T, Polimeni JR. Intracortical depth analyses of frequency-sensitive regions of human auditory cortex using 7TfMRI. NeuroImage 2016;143:116–127.
7. Hurley AC, Al-Radaideh A, Bai L, Aickelin U, Coxon R, Glover P, Gowland P a. Tailored RF pulse for magnetization inversion at ultrahigh field. Magn. Reson. Med. 2010;63:51–8.
8. van der Kouwe AJW, Benner T, Salat D, Fischl B. Brain Morphometry with Multiecho MPRAGE. NeuroImage 2008;40:559–569.
9. Woolrich MW, Ripley BD, Brady M, Smith SM. Temporal Autocorrelation in Univariate Linear Modeling of FMRI Data. NeuroImage 2001;14:1370–1386.
10. Greve DN, Fischl B. Accurate and Robust Brain Image Alignment using Boundary- based Registration. 2010;48:63–72.
11. Blazejewska A. I., Hinds O., Polimeni J. R, Improved tSNR of highresolutionfMRI with surfacebasedcortical ribbonsmoothing, OHBM 2015.
Figures