1649
Measurement of high frequency band signals by ultra-high temporal resolution imaging in task-based fMRI1Kansei Fukushi Research Institute, Tohoku Fukushi University, Sendai, Japan, 2GSIS and RIEC, Tohoku University, Sendai, Japan
Synopsis
Recent advances in MRI technique such as the multiband sequence have made fast sampling available up to 100-200 ms TR for whole brain acquisition. However, its usefulness is limited because there is not found any significant functional changes needed to be sampled with that short TR. In this study, we challenged to detect task-induced fast signals with the ultra-high temporal resolution imaging with 100 Hz sampling rates.
Introduction
Functional MRI studies have focused on slow signal changes of 6-8 seconds to peak amplitude because BOLD signals are dominated by vasculature dynamics. Recent advances in MRI technique such as the multiband sequence have made fast sampling available up to 100-200 ms TR for whole brain acquisition [1]. However, its usefulness is limited because there is not found any significant functional changes needed to be sampled with that short TR. In this study, we challenged to detect task-induced functional signals with temporal frequency as high as EEG signals related to signal processing in the brain by using ultra-high temporal resolution imaging we developed [2-4].Methods
(Pulse sequence & image reconstruction) A typical GRE sequence with multiple echoes was modified to obtain radial trajectories. Each session consisted of consecutive three scans: initial dummy scan for steady-state magnetization (20 sec.), reference scan, and projection scans in order. The image reconstruction was made by inverse imaging method [4].
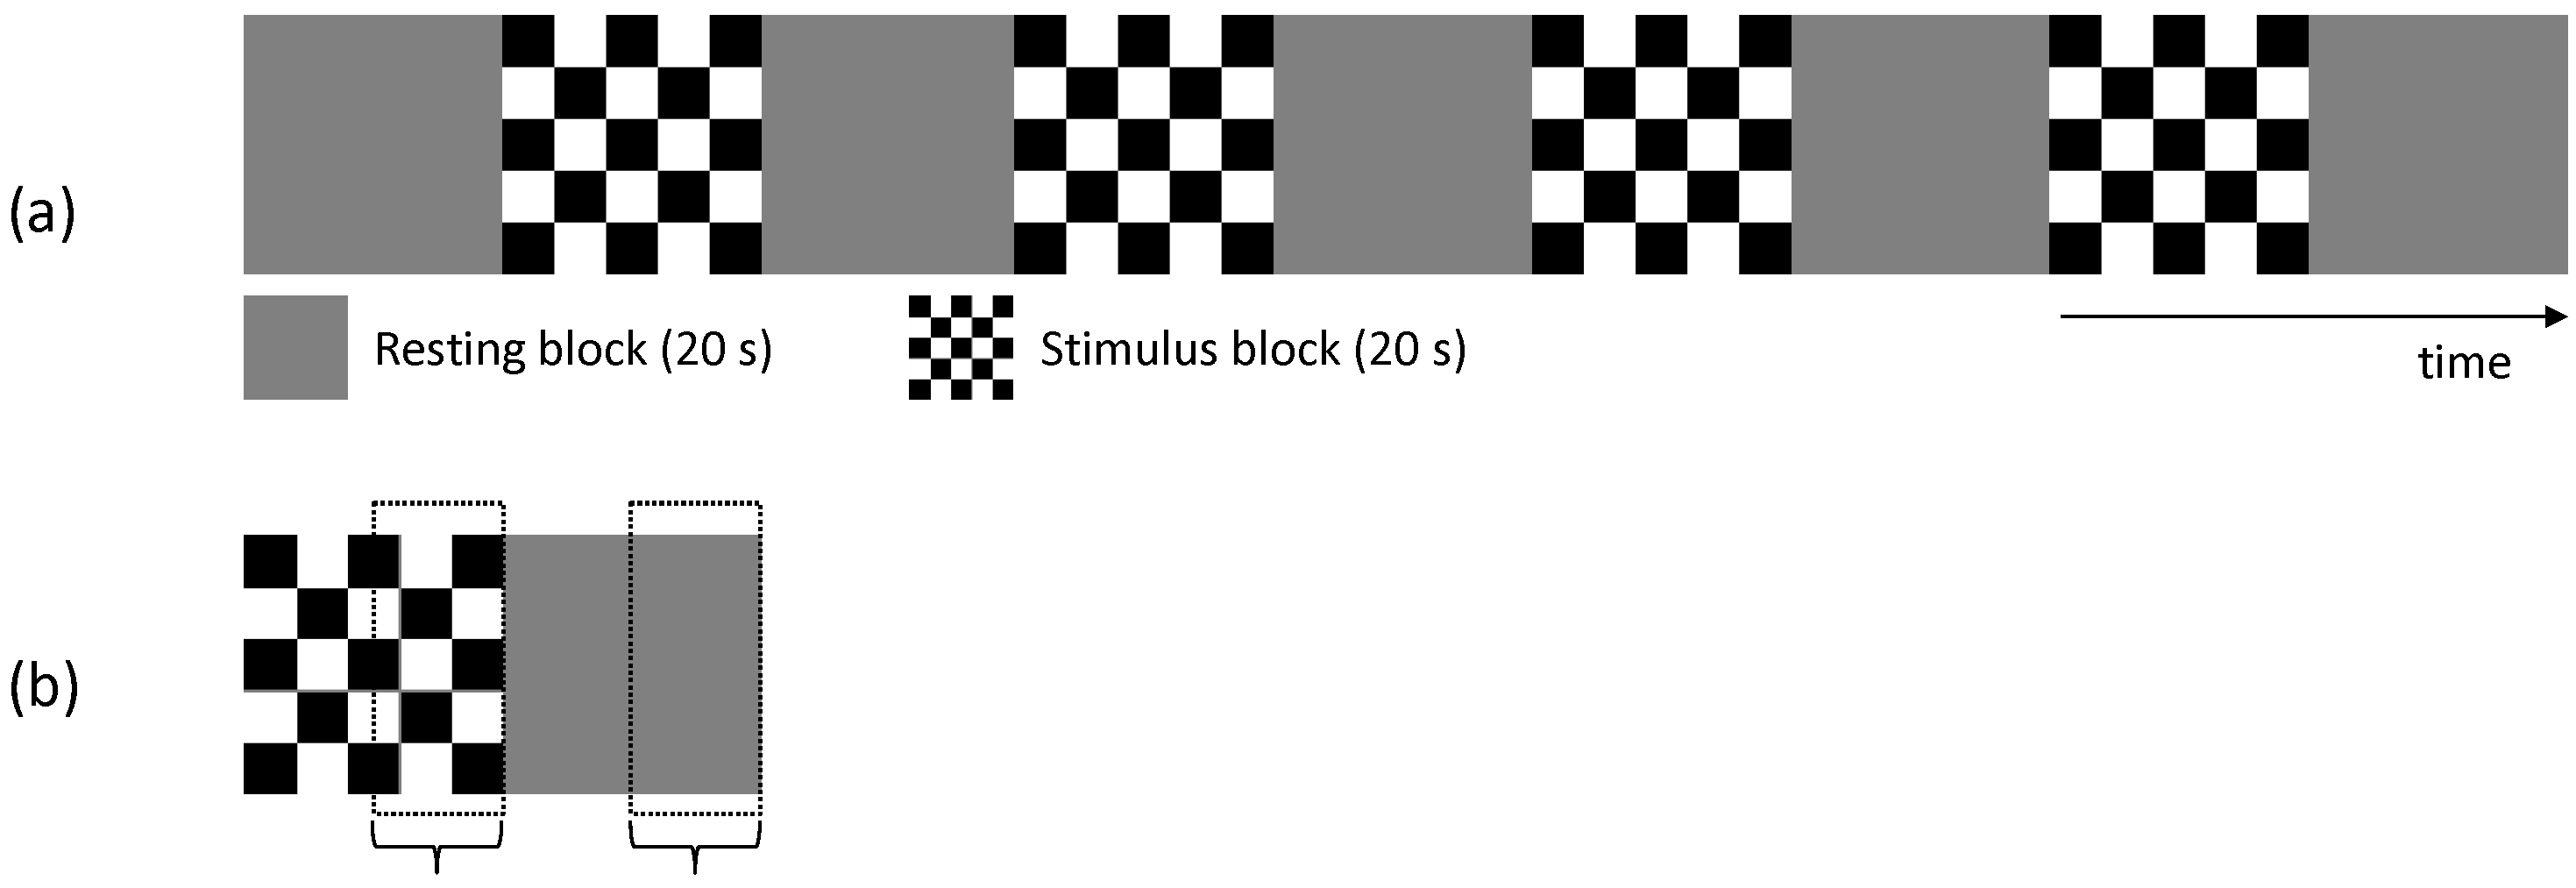
(fMRI protocol) To derive the activation in BOLD signal in the primary visual area, a checkerboard pattern flickering at 8 Hz was used. Each session consisted of initial rest period of 20 s, and 4 repetitions of the stimulus period of 20 s and the resting period of 20 s as shown in Figure 1(a), which made a single session 180 s. Four fMRI sessions were made for each subject.
(Data acquisition) Six healthy volunteers participated in this study. All MRI experiments were performed using a 3T Skyra-fit system (Siemens Healthcare GmbH, Erlangen, Germany) with a standard, 16-channel head matrix coil. For imaging, multi-echo projection sequence was used with three TEs of 4.0, 5.3, 6.7 ms, TR of 10 ms, FA of 8°, FOV of 220 mm, in-plane resolution of 3.4 mm, slice thickness of 5.0 mm, and BW of 2kHz/pixel. A single slice was taken to include the calcarine sulcus of the brain. The orientation angles of the read-out gradient were 0°, 120°, and 60°.
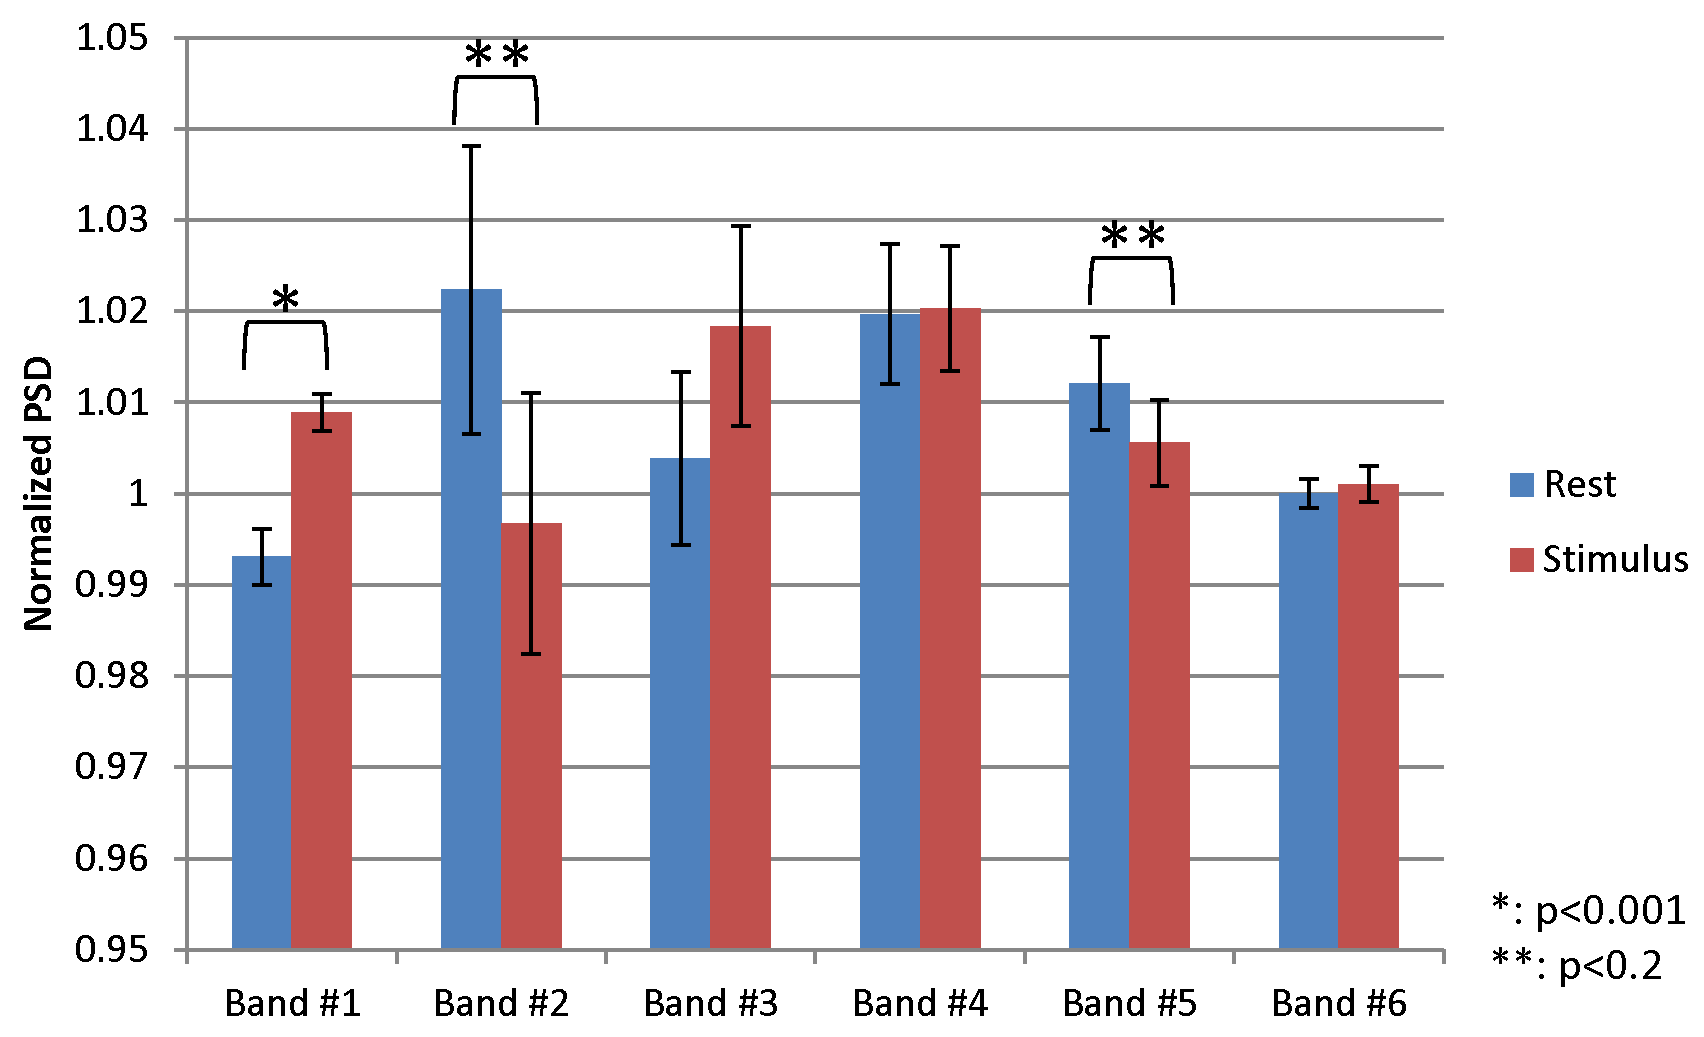
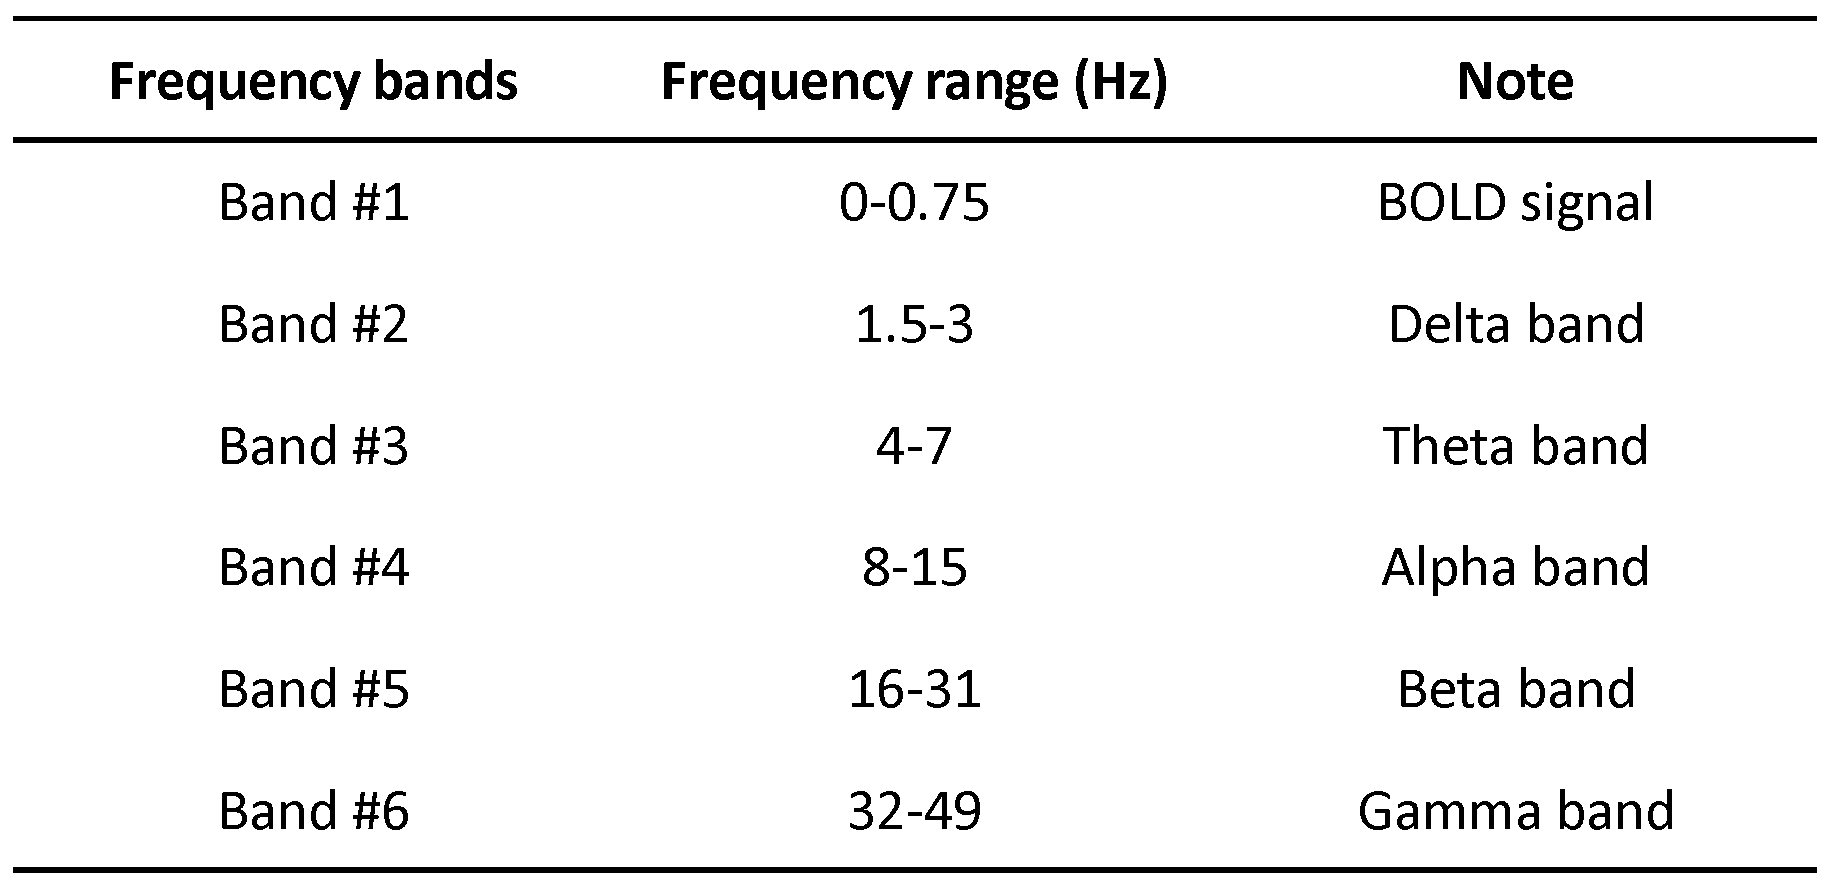
(Analysis) The BOLD activation map was estimated by general linear model (GML) analysis. A voxel with the highest beta value and adjacent eight voxels in the primary visual area were selected as a region of interest (10.2 x 10.2 x 5.0 mm3, ROI). To evaluate task-induced fast signal changes, we examined the power spectrum density (PSD) in six frequency bands corresponding to typical EEG signals such as α and β waves that were defined in Table 1. The signals were evaluated in the nine periods as depicted in Figure 1(b). To normalize PSDs, the criterion was taken as the PSD value obtained from the initial period of each session. For the statistical analysis, paired t-test was performed between PSDs of stimulus and resting periods.
Results
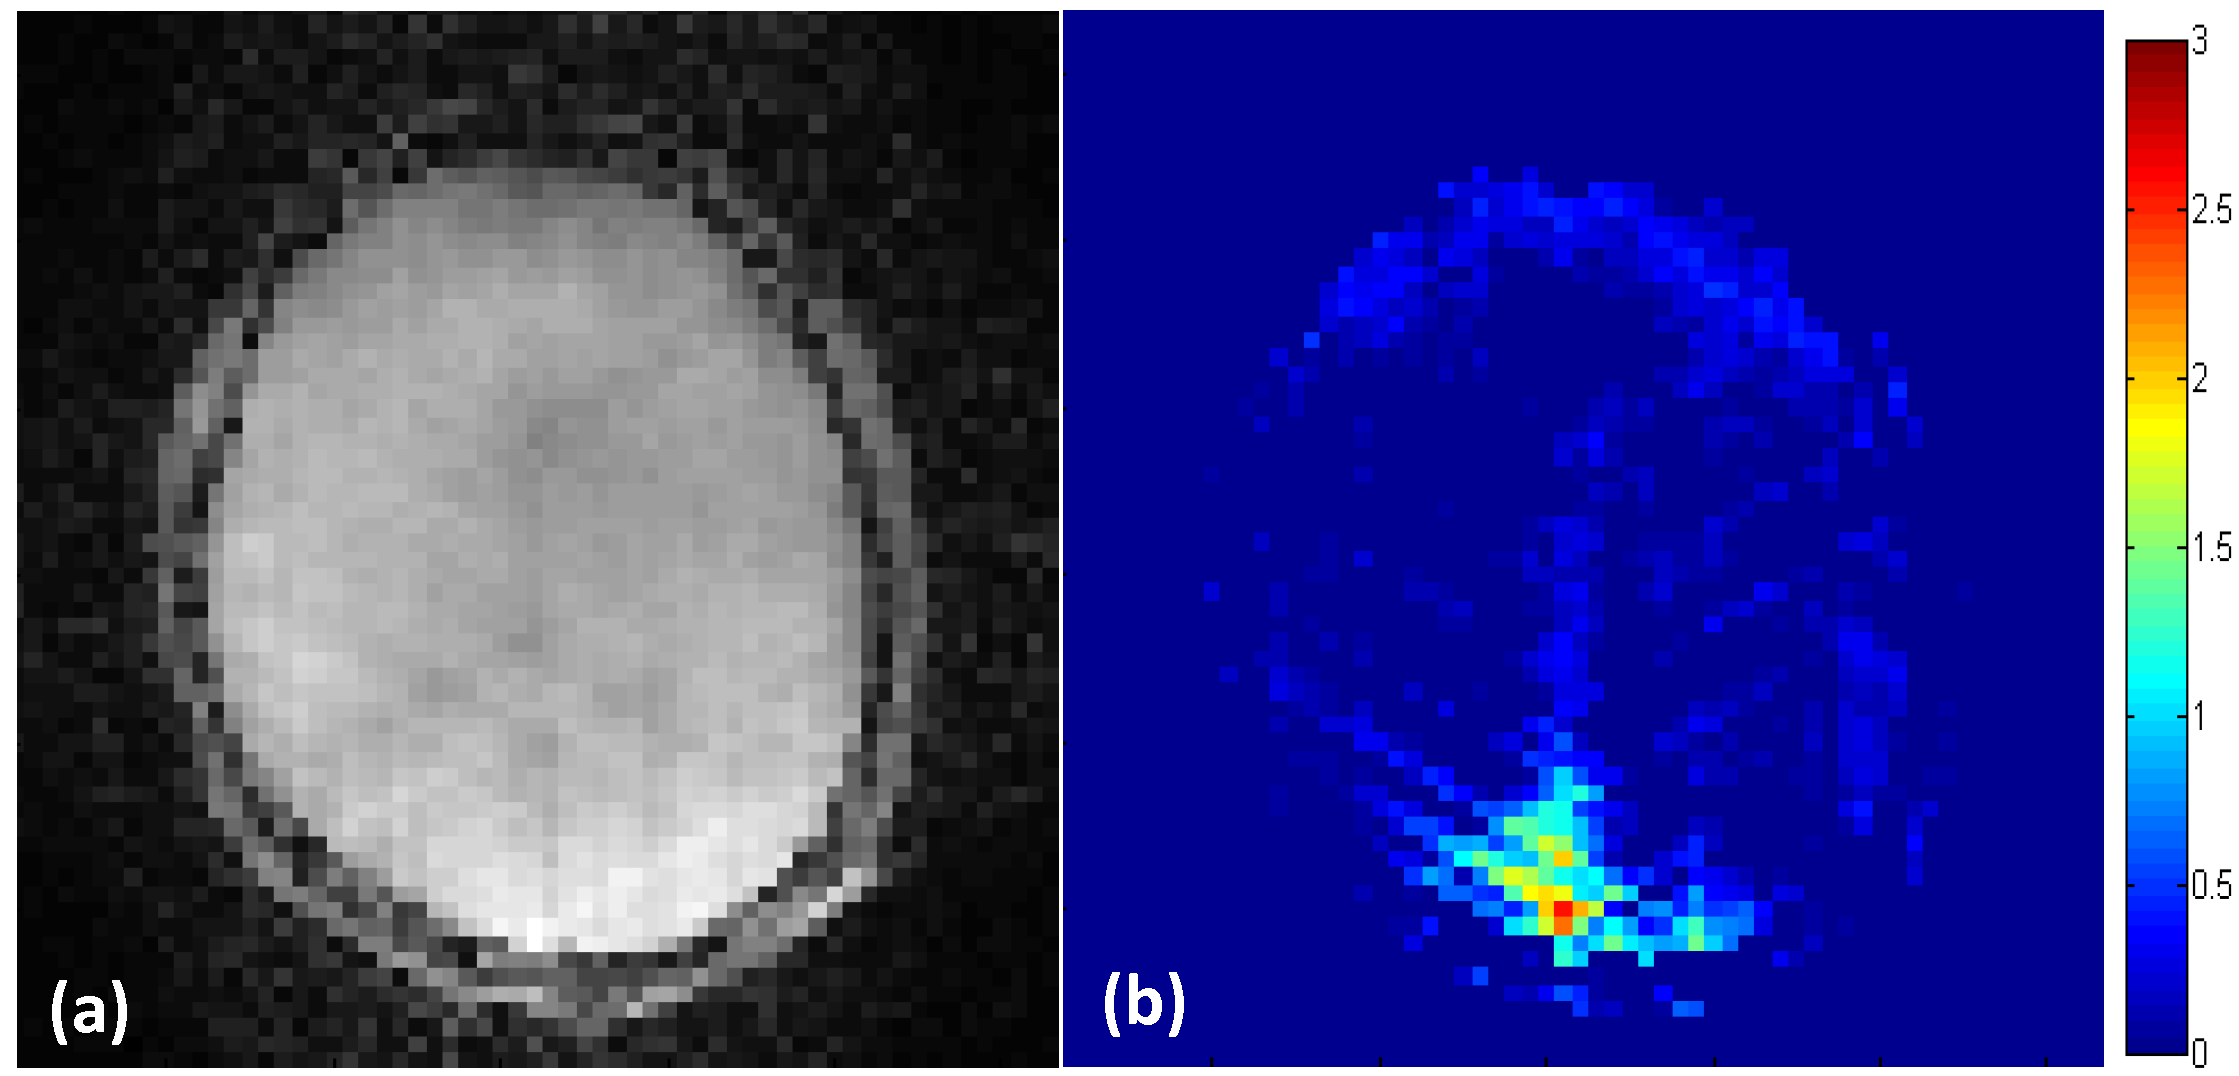
Among 24 sessions obtained from 6 subjects, 2 sessions were rejected due to a large motion. 88 pairs of stimulus and resting periods from 22 sessions were used for the following analysis. Figure 2 showed examples of the reconstructed images and the BOLD-based activation map by the visual stimulation. The average beta value at ROIs was 1.376 ± 0.375 (mean ± standard deviation). Figure 3 shows the normalized PSDs depending on the task stimulus for the six frequency bands. The band #1 showed significant increase of PSD at the stimulus period (p<0.001), which correspond to the BOLD signal. The PSDs in band #2 and #5 tended to decrease at the stimulus period (p = 0.16 and 0.15, respectively).Discussion
We attempted to detect task-induced high frequency signals by the ultra-high temporal resolution imaging with 100 Hz sampling rates. We found that two high frequency band signals tended to be modulated by the stimulus. This indicates that there was some physiological signal changes (non-BOLD) reflecting neuronal activation related to the stimulus, which suggests a possibility that fast imaging techniques may be used to measure more direct neuronal activities although further studies are needed to make the possibility clearer.Conclusion
The ultra-high temporal resolution imaging can be used to measure fast physiological signals related to neuronal activities in task-based fMRI.Acknowledgements
This study was supported by the MEXT-Supported program for the Strategic Research Foundation at Private Universities, 2014-2018.References
[1] Steen Moeller et al., “Multiband multislice GE-EPI at 7 tesla, with 16-fold acceleration using partial parallel imaging with application to high spatial and temporal whole-brain fMRI,” Magn. Reson. Med., vol. 63, no. 5, pp. 1144–1153, 2010.
[2] F.-H. Lin, et al., “Dynamic magnetic resonance inverse imaging of human brain function,” Magn. Reson. Med., vol. 56, no. 4, pp. 787–802, 2006.
[3] J. Hennig, et al., “MR-Encephalography?: Fast multi-channel monitoring of brain physiology with magnetic resonance,” vol. 34, pp. 212–219, 2007.
[4] Kang et al., “2D inverse imaging with multiple-echo scheme for ultra-high sampling in fMRI,” submitted in ISMRM 2017.
Figures