1648
Modeling serial correlations in fMRI time series collected by faster TRs1Electrical Engineering & Radiology, Stanford University, Stanford, CA, United States, 2Electrical Engineering & Radiology, Stanford University, CA, United States
Synopsis
Serial correlations of fMRI time series are altered at faster TRs (<1s) due to reduced signal to noise ratio per time frame. Thus, caution is advised when utilizing serial correlation models describing long TR (2~3s) conditions with fast acquisitions. Here, we show that statistical models alternative to the commonly used first order auto-regressive (AR) model – AR2 and AR1moving-average(MA)1 model —can achieve reasonable fitting for short TR data and improve the accuracy of activation estimates. Potential model bias can be further reduced by low-pass filtering.
Introduction
With recent advances of MR technology, one is able to collect whole-brain fMRI datasets with sub-second TRs, thus achieving increased statistical power (more data points) as well as cleaner representations of neural activity (no aliasing from physiological fluctuations). Notably, the signal-to-noise ratio (SNR) per image frame of short TRs (<1s) is diminished compared to long TR (2~3s) acquisitions, yielding increased contributions from white thermal noise and decreased contributions from physiological noise in fMRI observations. As such, serial correlations of time series resolved by faster TRs may not be effectively captured by certain models describing long TR data (e.g., the first order auto-regressive (AR) model AR1, AR1 (with fixed coefficient) + white noise[1]). Since more sophisticated models (e.g., higher order AR models) may complicate computation and suffer from over-fitting, the first aim of this work is to evaluate whether alternative models (AR1moving-average(MA)1, AR2) commonly used by various analysis packages can capture short TR serial correlation structures better than the simple AR1 model. The second aim is to examine whether potential bias of these simple models can be ameliorated by moderate low-pass filtering[2], given that SNR drops quickly with frequency and high-frequency fluctuations contribute minimally to the overall information.Methods
FMRI images were collected at 3T (GE Signa 750, 32 channel coil, Simultaneous Multi-Slice with CAIPI[3], MB = 6, TE = 30ms, 30 slices). A first cohort of four subjects participated in the block-design visual+auditory stimulus task (7 blocks, block duration 15s off/15s on), each undergoing four scans with different TRs (TRs = 0.4/0.7/1.2/2 s, flip angles = 42o/53o/63o/63o, voxel size 3.44*3.44*4 mm3). Another cohort of ten subjects each underwent a 10-min long resting state scan (TR = 0.35s, flip angle = 40o, voxel size 3.14*3.14*4 mm3).
Regressors in the general linear model included linear and quadratic trends, physiological fluctuations (RETROICOR[4], RVHRcor[5]), six motion parameters, task covariate and its temporal derivative (for the visual+auditory stimulus). Serial structures of the time series were estimated using the residuals post ordinary least square fitting. Four types of serial structure models: AR1, AR2, AR1MA1 and ARp (with optimum p selected by bayes information criterion (BIC)) were examined with R. Effects of low-pass filtering were assessed on the task dataset (TR = 0.4s) and rest dataset respectively with cutoff thresholds 0.2/0.4/0.8 Hz.
Results
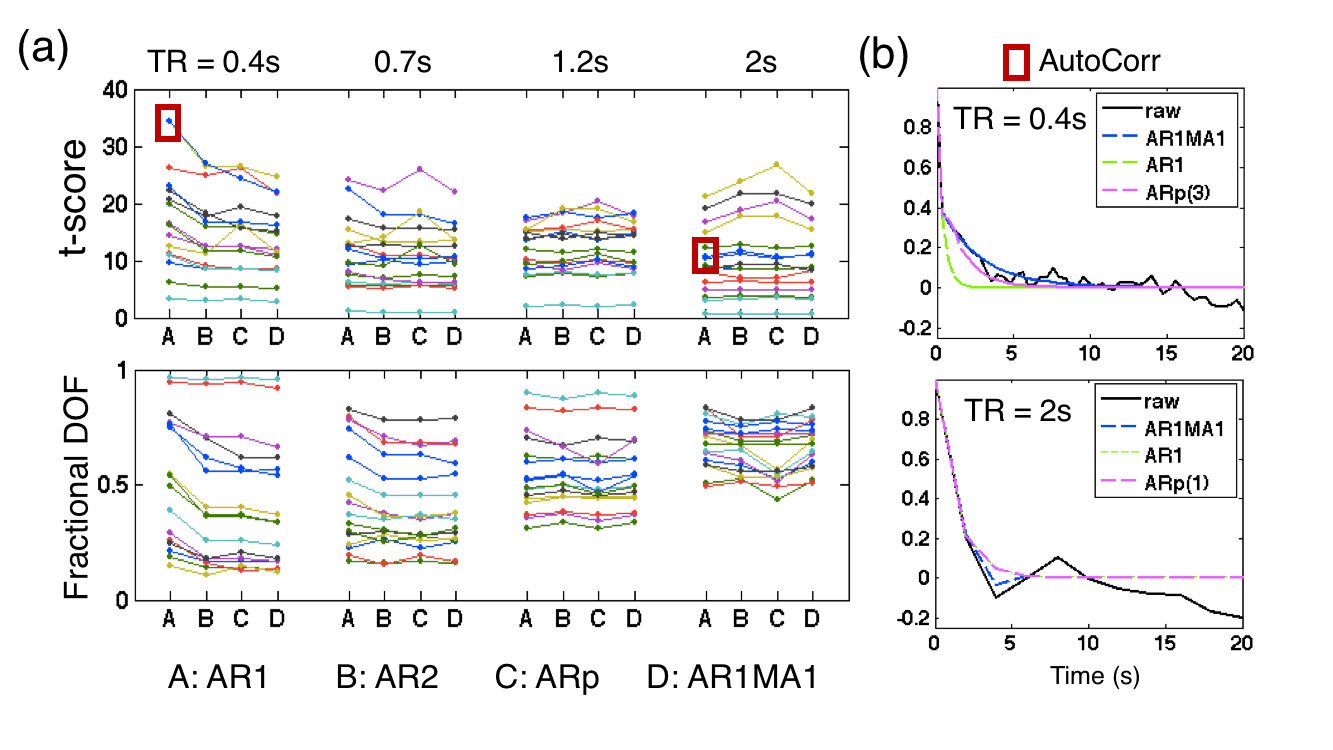
Figure 1 shows the dependence of task activation on serial correlation models. Taking ARp model as the gold standard, AR1 tends to overestimate the degrees of freedom (DOFs)[6] and inflate t-score values as TR shortens. As illustrated by a voxel’s temporal autocorrelation in Fig. 1(b, up), the prominent peak at lag = 0 (due to increased contribution of white thermal noise) drives the fitting of AR1 and fails to capture long-range correlations. This issue is less severe with long TR and high SNR (b, bottom). In contrast, slightly more complicated model AR2, AR1MA1 can already reduce the bias to considerable levels.
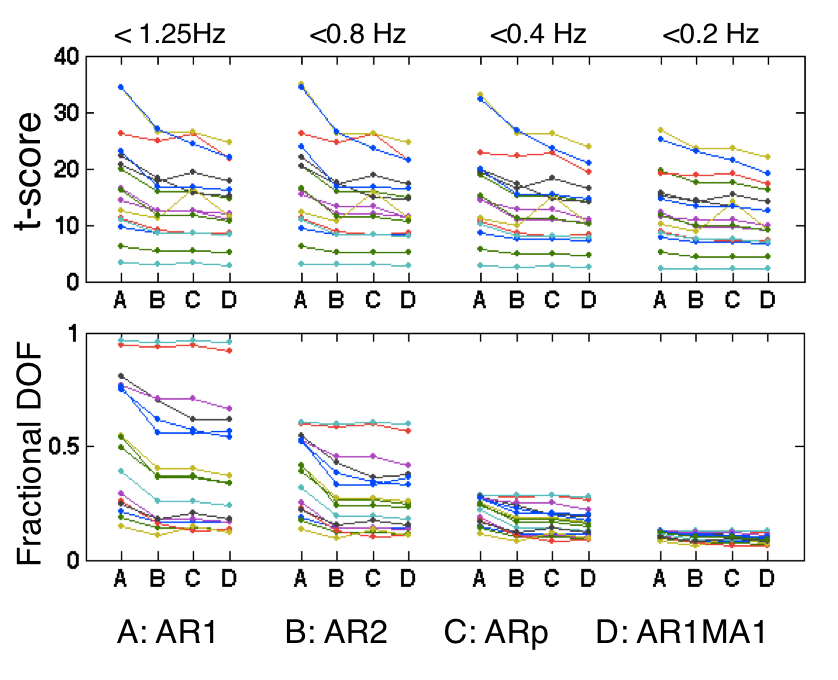
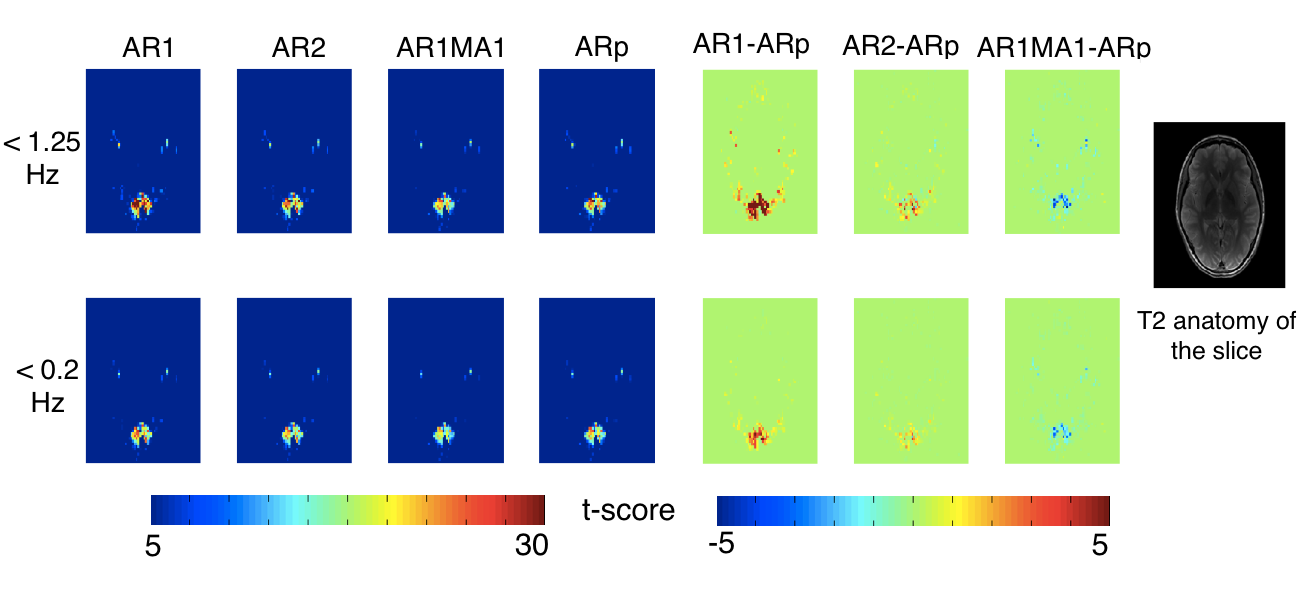
As shown in Figs 2 and 3, model bias can be further tempered by low-pass filtering. Of note, the statistical results drop modestly (Fig. 2 up, <0.2 Hz) despite the dramatic decrease in DOFs (bottom). This probably suggests that fluctuations removed by low-pass filtering are predominantly noise and the overall SNR is enhanced to compensate.
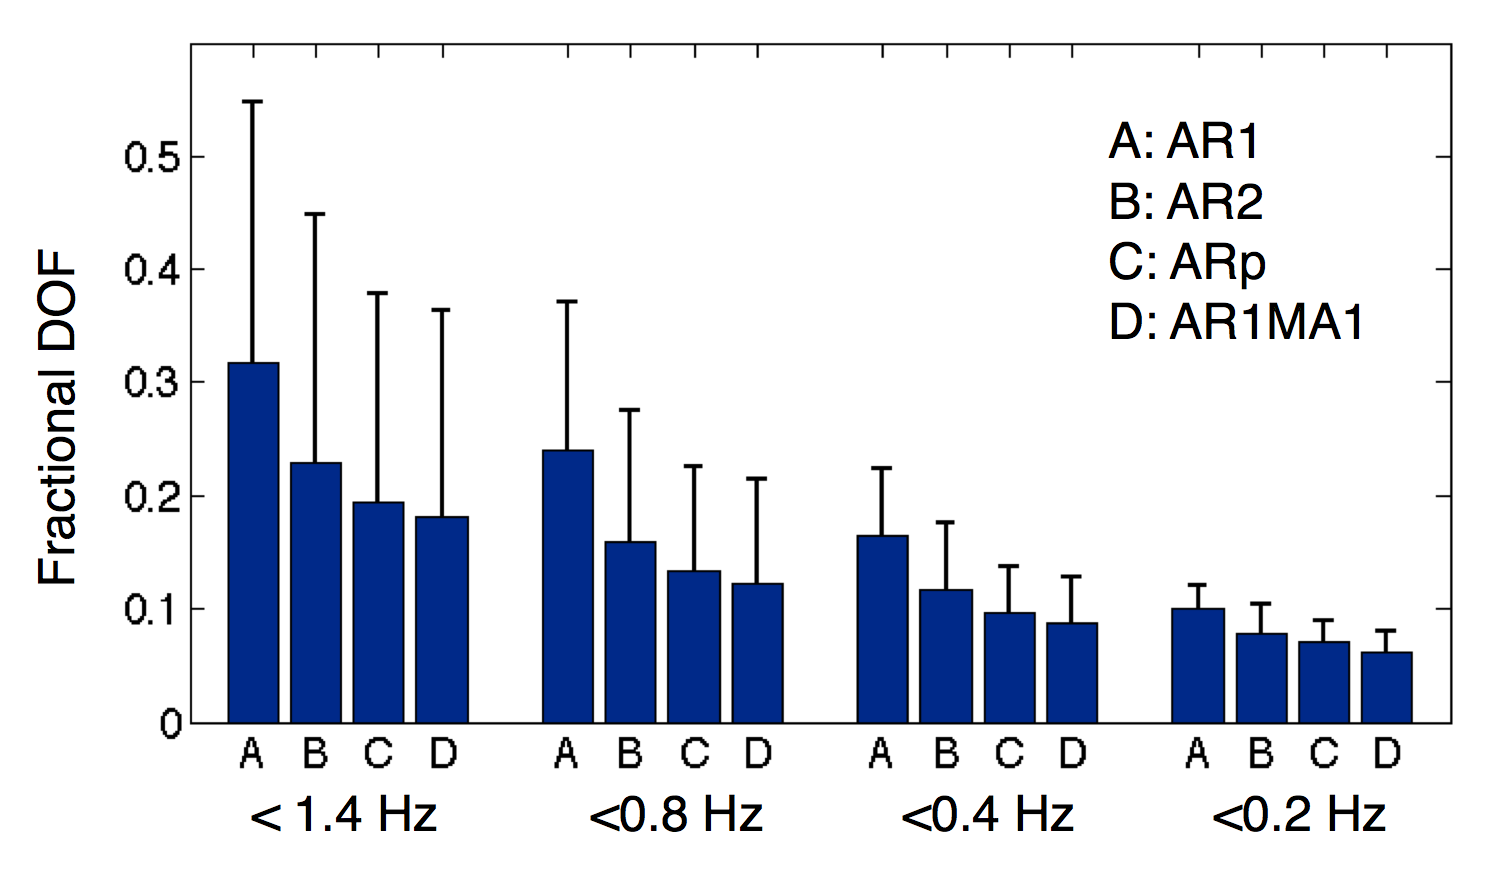
Figure 4 shows the influence of serial correlation models and temporal filtering on resting state data. In line with the task results, DOFs estimated using AR2 and AR1MA1 model approximate ARp better than the AR1 model.
Conclusion
With analyses on both block-design task and resting state datasets, we’ve re-confirmed that caution is advised when extending long TR (2~3s) serial correlation models to short TR (<1s) acquisitions[1]. Preliminary results shown here suggest that certain models (AR1MA1, AR2) may extend to faster TR conditions. Model bias between the assumed and actual models can be further ameliorated by moderate low-pass filtering.Acknowledgements
The authors acknowledge Hesam Jahanian for proving the rest data, and funding supports by NIH P41EB15891, R01 NS066506, R01 NS047607, R01 DK092241, and GE healthcare.
References
[1] Sahib, et al., (2016), Effect of temporal resolution and serial autocorrelations in event-related functional MRI. MRM. doi:10.1002/mrm.26073.
[2] Friston et al., (2000). To Smooth or Not to Smooth?: Bias and Efficiency in fMRI Time-Series Analysis. NeuroImage, (12) 196-208.
[3] Setsompop et al., (2012). Blipped-controlled aliasing in parallel imaging for simultaneous multislice echo planar imaging with reduced g-factor penalty. MRM (67), 1210-1224.
[4] Glover et al., (2000). Image-based method for retrospective correction of physiological motion effects in fMRI: RETROICOR. MRM (44), 162-167.
[5] Chang et a;., (2009). Influence of heart rate on the BOLD signal: The cardiac response function. Neuroimage (44), 857-869.
[6] Worsley and Friston, (1995), Analysis of fMRI time-series revisited-again. NeuroImage, (2) 173-181.
Figures