1647
Investigating Altered Brain Functional Network in Alzheimer’s Disease Using a Joint Framework of Graph Theoretical Analysis and Machine Learning1Institute of Biomedical Engineering and Nanomedicine, National Health Research Institutes, Miaoli, Taiwan, 2Department of Computer Science, National Chiao Tung University, Hsinchu, Taiwan, 3GE Healthcare, Taiwan, 4GE Healthcare MR Research China, Beijing, People's Republic of China, 5Institute of Medical Device and Imaging, National Taiwan University College of Medicine, Taiwan
Synopsis
The progressive decline in cognitive abilities occurred in the early stage of Alzheimer’s disease (AD) is often difficult to be distinguished from the symptoms of mild cognitive impairment (MCI). This study incorporated graph theoretical analysis and machine learning approach to investigate the alterations of brain functional network in AD. Statistical approach demonstrated regions with significantly altered network characteristics, which were also reported to be linked to AD in previous studies. Machine learning approach using TensorFlow also showcases the significant discriminative power of the brain network measures. Future work includes incorporation of other type of network measures, behavior and biochemical assessments, and more complex deep learning models.
Purpose
The progressive decline in cognitive abilities occurred in the early stage of Alzheimer’s disease (AD) is often difficult to be distinguished from the symptoms of mild cognitive impairment (MCI). The lack of early diagnosis and prognostic markers may delay patients from receiving appropriate medical care. Recently, neuroimaging approaches provide anatomical, functional and metabolic information non-invasively and have been considered as promising tools to improve the early diagnosis of AD. Previous studies have shown that the topological organization of brain network is disrupted in AD patients. Thus, imaging markers derived from graph theoretical analysis could be potentially helpful to distinguish AD from MCI or even early aging. Additionally, a joint development with machine learning approach for classification is also emergently needed. In this study, we incorporated statistical and machine-learning approaches on brain network measures to investigate the functional alterations of brain in AD and aim to establish a useful framework for classifying MCI and AD.Methods
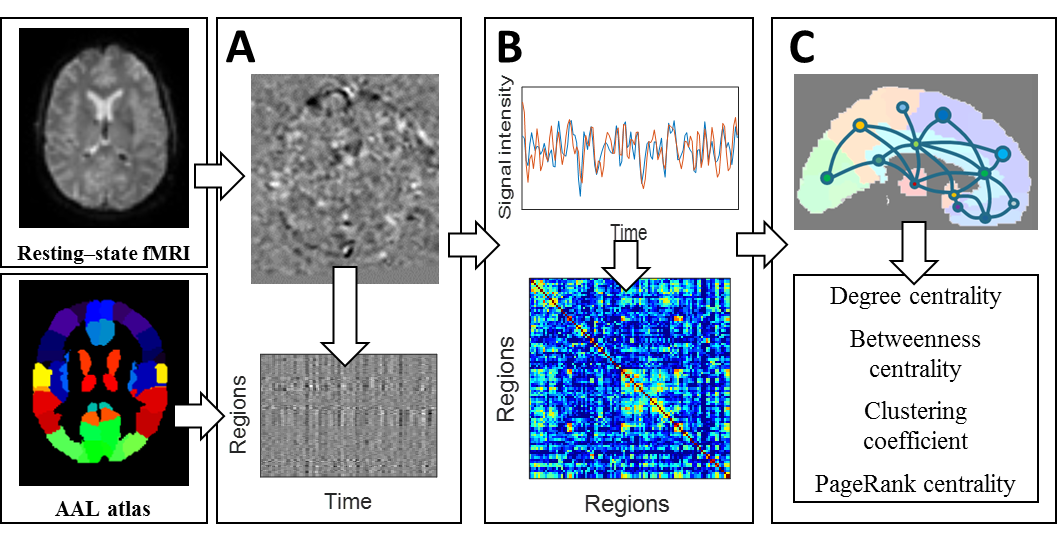
A total of 23 AD patients, 19 MCI patients and 22 healthy controls (HC) were recruited in this study. MR experiments were conducted on a 1.5T MRI scanner (HDxt, GE, USA). MR protocols include 3D T1-weighted imaging (1 × 1 × 1 mm3) and resting-state functional MRI (rs-fMRI, TR/TE of 3000/35 ms, scan time 6 mins, 3 × 3 × 3 mm3). The workflow of graph theoretical analysis is illustrated in Figure 1. Data pre-processing was performed using DPARSF toolbox1. Functional connectivity between the mean time series of 90 regions of AAL atlas2 was calculated using various connectivity metrics including Pearson’s correlation, covariance and normalized mutual information (NMI). Spurious connections were removed using multiple sparsity thresholds ranging from 0.1 to 0.3. Nodal network metrics, including degree centrality, betweenness centrality, clustering coefficient and PageRank centrality, were then estimated using Brain Connectivity Toolbox3. Various statistical analyses were performed to investigate the altered topology in AD and MCI patients. One-way ANOVA was performed for each type of network metrics. In addition, we performed multivariate ANOVA with all types of metrics jointly taken into consideration. ANOVA result of between-group comparison were corrected using false discovery rate (FDR) controlling procedure. Classification using machine learning was performed to investigate the potentiality of functional network metrics on differentiating MCI and AD. Features used for classification are all network metrics. We implemented a linear classifier based on single-layer perceptron using TensorFlow4. Dropout, L1 and L2 regularization were used to prevent overfitting. Results using different functional connectivity were compared. 10-fold cross-validation was used to evaluate the classification accuracy.Results & discussion
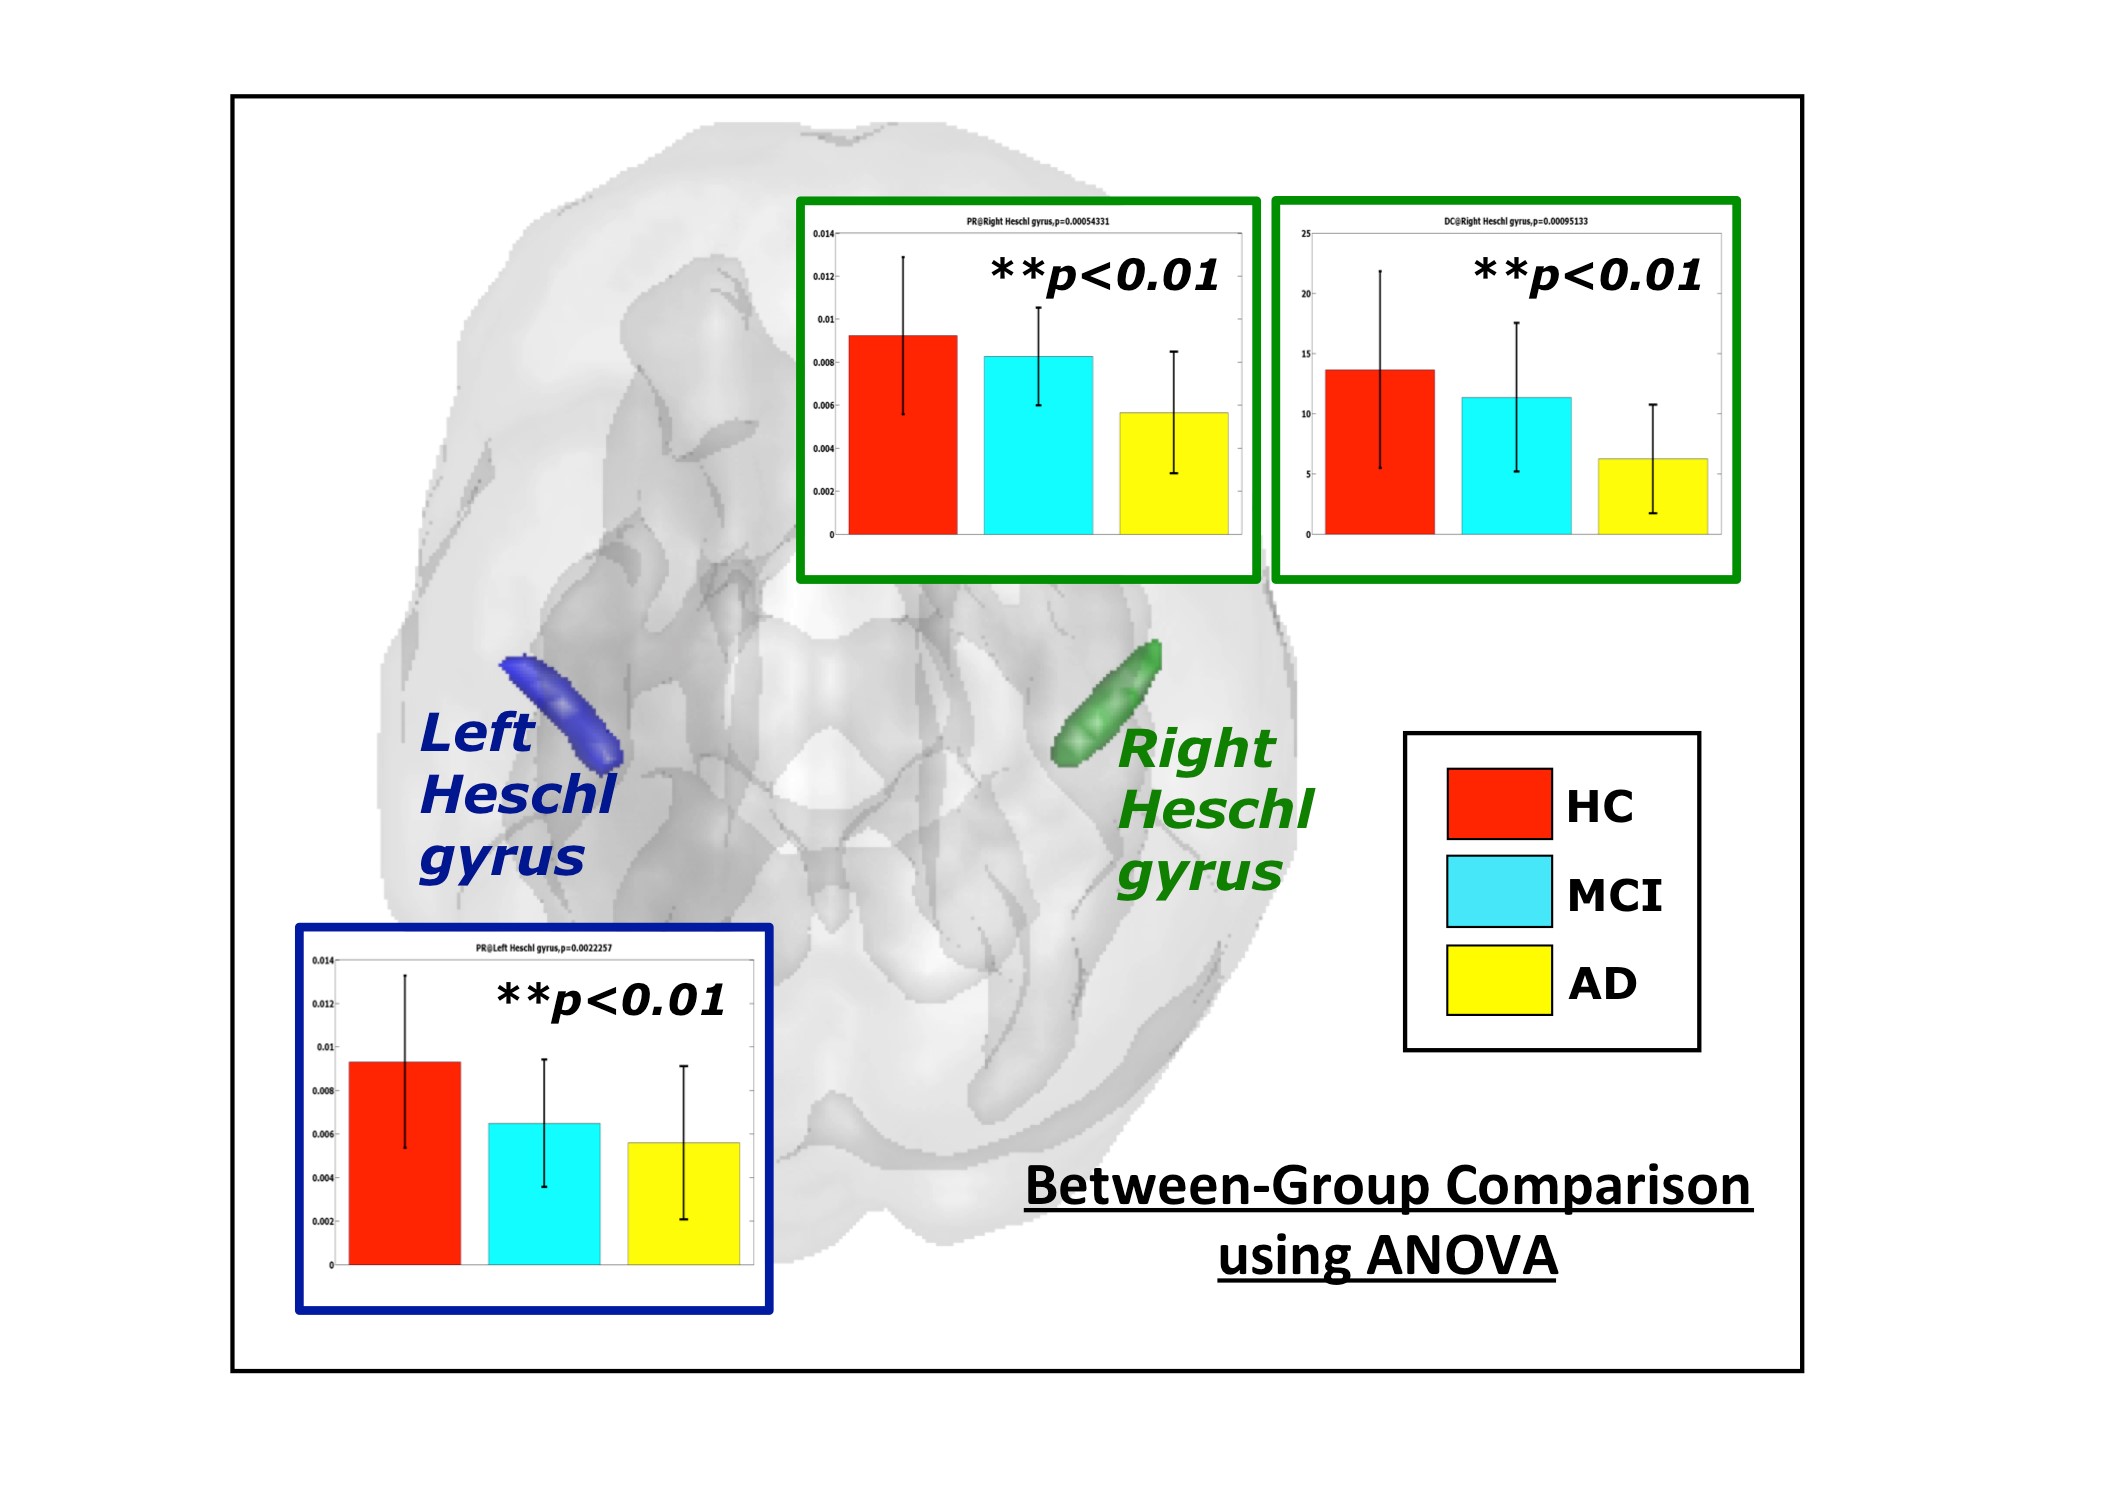
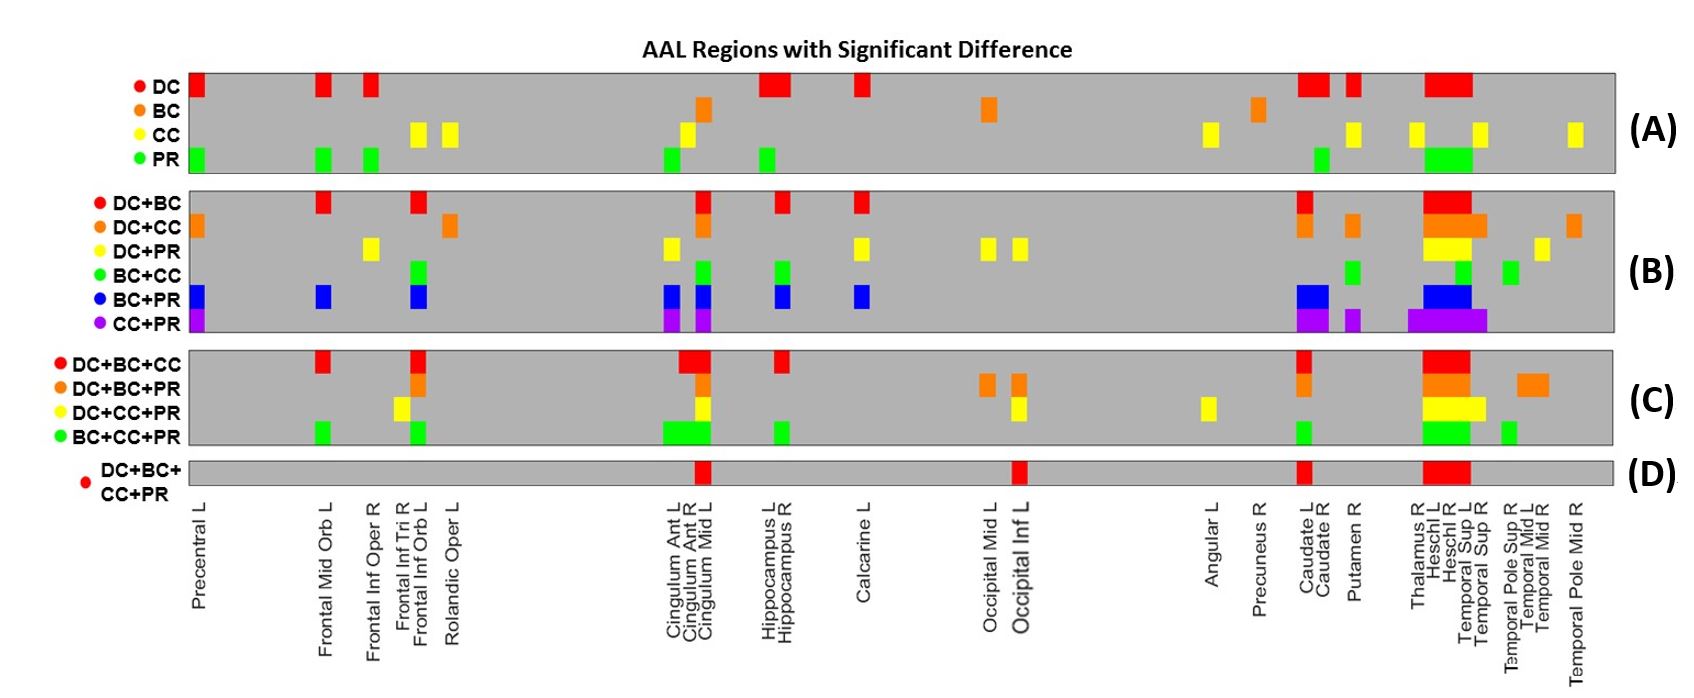
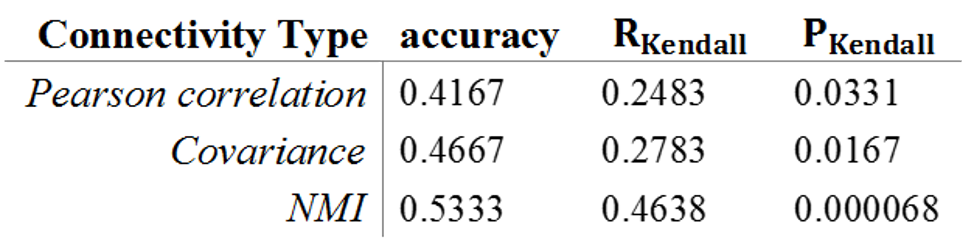
Left and right Heschl gyrus (HG) displayed significant between-group difference after FDR correction (See Figure 2). AD group generally shows lower centralities in either regions of interest from the bar graphs. As a component of primary auditory system, HG may be related to language disorder, which also serves as a symptom in AD5. Multivariate ANOVA also showed significant between-group differences in frontal region, cingulum, caudate nucleus, HG and superior temporal gyrus (STG) (see Figure 3). Classification using NMI-based network metrics yields the highest accuracy compared to other types of connectivity index (see Table 1), with the accuracy of 0.533 and significant correlation between the prediction result and the actual group label (Kendall’s tau correlation coefficient, p < 0.0001). This indicates that network measures yield significant discriminative power for distinguishing the difference between AD, MCI and NC, and NMI-based network measures yields higher accuracy compared to other types functional connectivity metrics in this study.Conclusion
This study shows the capability of brain network measures as potential biomarkers which could be used for classification of MCI and AD. The regions shown with significantly altered network characteristics were also reported to be linked to AD in previous studies. Preliminary results on classification also provide support for the potentiality of network measures. More subjects would be recruited to increase the statistical power and further work to incorporate more measures from connectivity and behavior is needed. A more complex deep learning classification framework incorporating influential network metrics and cortical regions is also needed for more reliable predictions.Acknowledgements
This work was supported by research grant NHRI-PP-06 of the National Health Research Institutes and Ministry of Science and Technology, Taiwan.References
1. Chao-Gan, Y. and Z. Yu-Feng, DPARSF: a MATLAB toolbox for “pipeline” data analysis of resting-state fMRI. Frontiers in systems neuroscience, 2010. 4.
2. Tzourio-Mazoyer, N., et al., Automated anatomical labeling of activations in SPM using a macroscopic anatomical parcellation of the MNI MRI single-subject brain. Neuroimage, 2002. 15(1): p. 273-289.
3. Rubinov, M. and O. Sporns, Complex network measures of brain connectivity: Uses and interpretations. NeuroImage, 2010. 52(3): p. 1059-1069.
4. Abadi, M., et al., Tensorflow: Large-scale machine learning on heterogeneous distributed systems. arXiv preprint arXiv:1603.04467, 2016.
5. Liégeois-Chauvel, C., et al., Specialization of left auditory cortex for speech perception in man depends on temporal coding. Cerebral cortex, 1999. 9(5): p. 484-496.
Figures