1646
Automatic physiological noise estimator with PESTICA in HCP resting state fMRI data1Radiology, Cleveland Clinic, Cleveland, OH, United States
Synopsis
Recent work with accelerated HCP rs-fMRI data shows strong correlation with non-neuronal noise sources, and their noise patterns appears to be linked across simultaneously excited slices (SMS)1,2. To correct for these noise sources, a measurement of physiologic cycles is needed, which can be supplied by monitoring, but not always available or accurate, or PESTICA which estimates physiological signal fluctuation from EPI data itself3. If the noise is dependent on SMS location, PESTICA could more efficiently detect physiologic signal fluctuation in HCP fMRI. In this study, we modified PESTICA for the SMS acuisition and evaluated performance compared with monitored physiological signals
Purpose
To evaluate simultaneously excited slices (multiband)-enhanced PESTICA in HCP rs-fMRIMethod
Two healthy subjects were scanned and re-scanned at 3T and four Multiple Sclerosis patients were scanned at 3T and 7T (HCP protocols 3T: CMRR_MB_EPI_VD13D_R014, MB factor=8, TR=0.8s and iso-2mm, 7T: CMRR_MB_EPI_17A_UHF_R014, TR=1s, MB=5 and iso-1.6mm). For comparison with PESTICA, cardiac (Card) and respiratory (Resp) signals were acquired during scans using a pulse oximeter and respiratory belt. While 4 scans of rs-fMRI scans (two scans with A-P and P-A phase encoding directions) were collected in the protocol, two scans with A-P direction are presented in the study.
The first ten volumes were removed and a modified PESTICA was applied. The SMS PESTICA consisted of averaging the fluctuation determined across the simultaneously excited slices.
For the baseline, Card and Resp signal fluctuations were modeled using the measured phase cycles with the second order Fourier Series4. From the voxels of top 5% of the highest correlation with the model, the hemodynamic impulse response Card and Resp functions (IRF) over phase cycles were calculated5. Using IRF, the monitored Card and Resp fluctuations were down-sampled with the slice acquisition time gap (=TR/slices*MB acc) and used as the baseline in this study.
Result
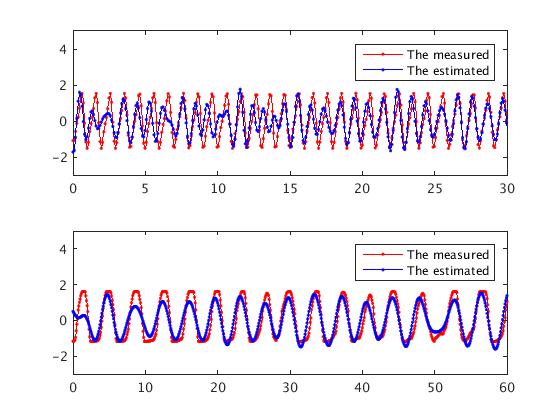
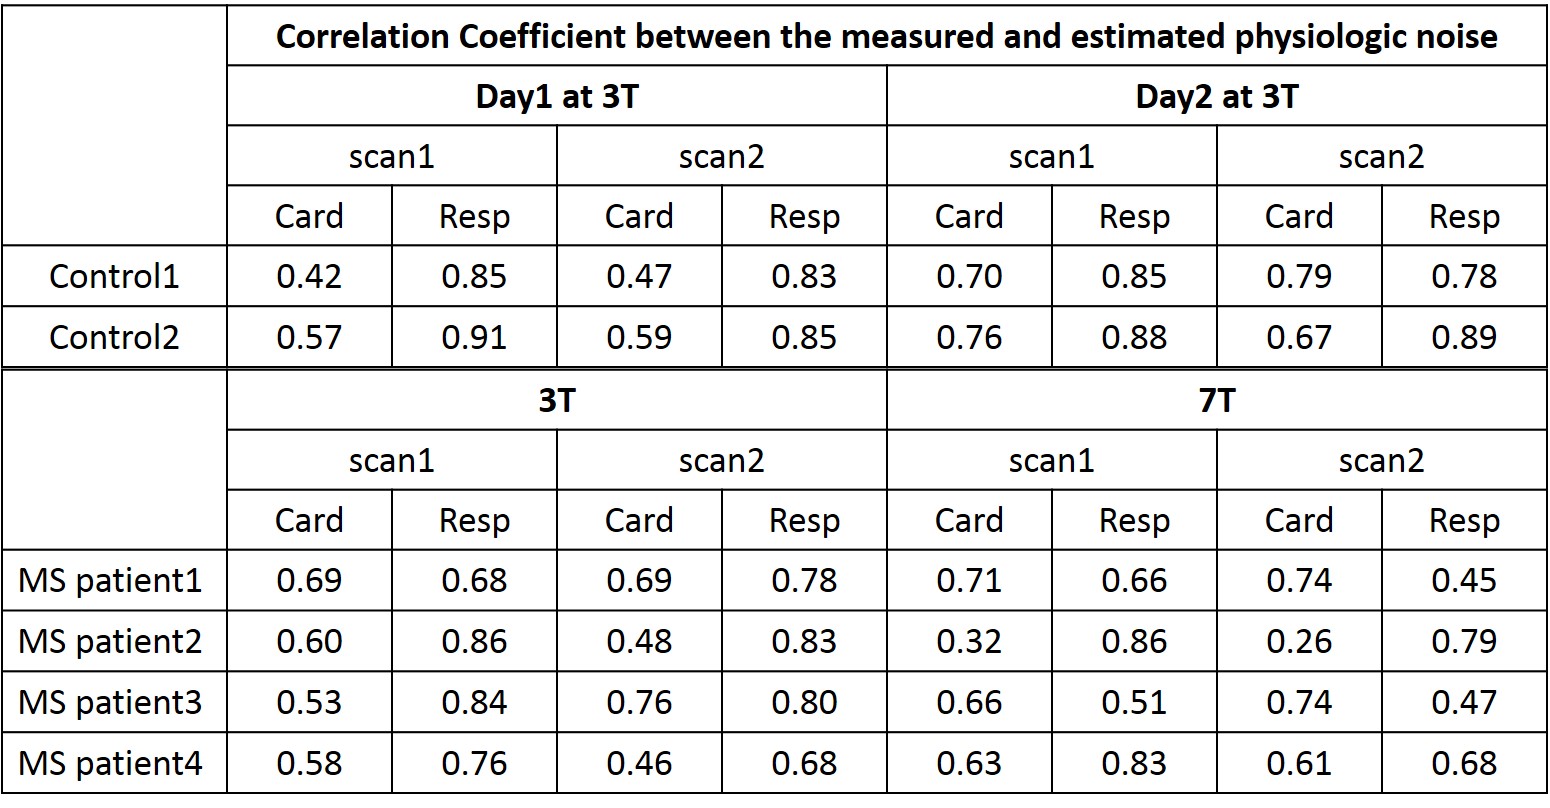
Fig1 shows monitored and PESTICA-determined Card and Resp signals from a healthy subject. The correlation coefficients (CC) between the PESTICA and monitored signals in controls and patients are presented in Table 1 (Fig2).
The average CCs were 0.62 for Card and 0.86 for Resp in controls, and 0.59 for Card and 0.72 for Resp in patients. In controls, scan-to-scan variability was 0.04 for Card and 0.03 for Resp. Day-by-day variations (reproducibility) were 0.15 of Card and 0.01 of Resp. In patient, there was no significant field strength difference in CC of Card and Resp (p > 0.05). Scan-to-scan variation of CC in Card and Resp were 0.06.
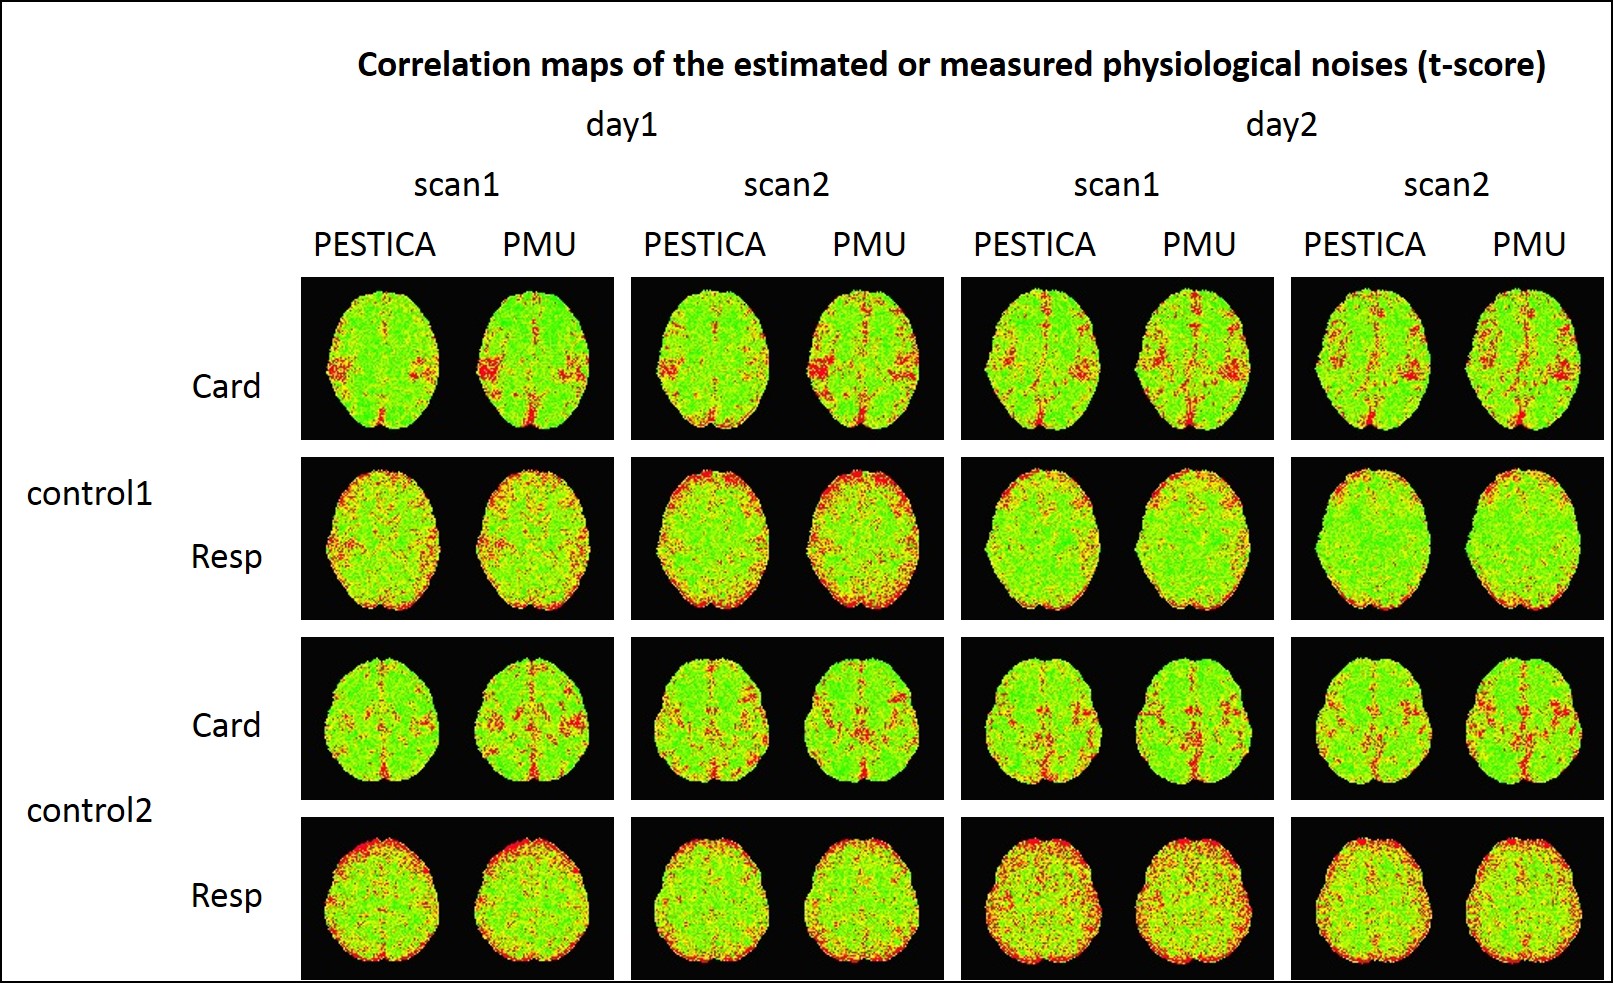
Fig3 shows the regression t-score map for the control subjects’ physiologic noise from PESTICA and from monitored, showing similar spatial pattern and statistical significance over all scans.
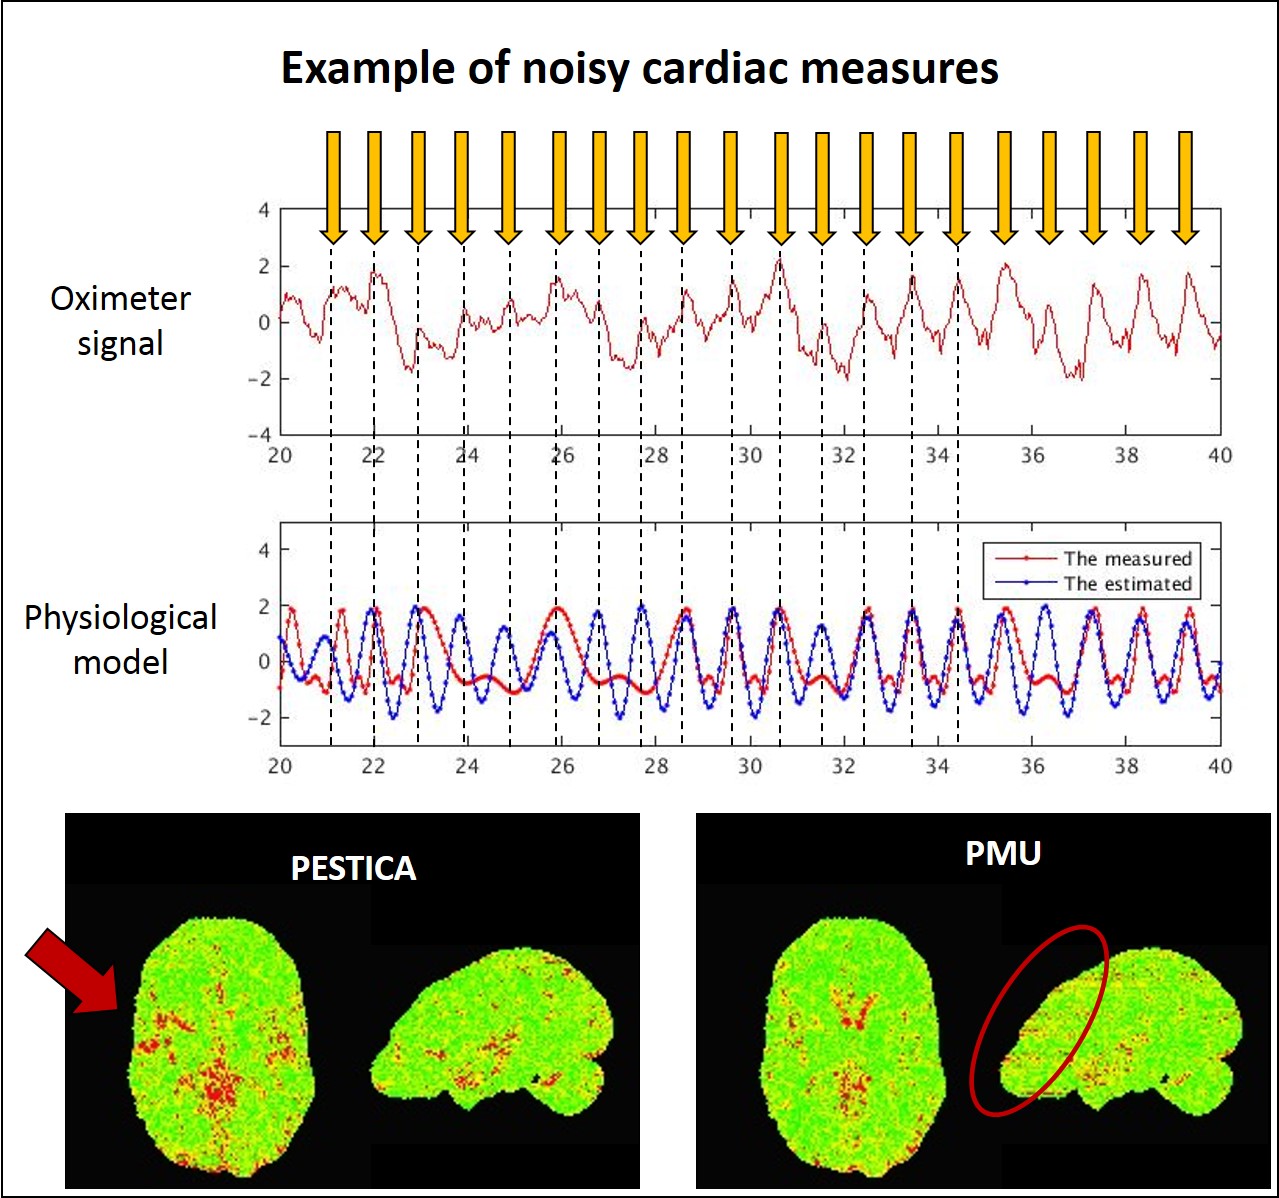
Fig 4 shows a case of noisy monitored (oximeter) signal in MS patient2, scan1 at 7T. The phase cycles were automatically determined using AFNI matlab package, RetroTS function. The yellow arrows were drawn manually to define the peak of oximeter signals considering the expected heart-beat frequency. In the same time domain, signal fluctuations with the monitored and PESTICA Card were presented. As shown, the estimated cardiac noise in BOLD fluctuation shows the higher coherent fluctuation cycles than the measured.
Discussion
PESTICA determines physiological signal fluctuations that are comparable or better than monitored physiologic signals in SMS-accelerated HCP data, and improve greatly over previous versions of PESTICA, as measured by CC between monitored and PESTICA signals. The original report of PESTICA had CC of 0.24 and 0.39 in Card and Resp fluctuations, respectively3, a second version PESTICA had CC of 0.41 and 0.426, and this SMS-enhanced version produces CC of 0.6 and 0.77. This was a surprising increase, and we believe it is due to increase in coherence of independent sources in simultaneously excited slices.
Figure 4 shows that the monitored phase cycles are mis-determined as shown in a red curve while PESTICA, as shown in a blue curve, produces the coherent fluctuation to the manually chosen cycles, which indicates that the low CC of 0.32 between the monitored and the estimated signals could be invoked by the Card phase measures and its process, rather than by the poor performance of PESTICA.
The correlation map comparison with PESTICA and phasor meausurement unit (PMU) in Fig4 also indicates that PESTICA generates the higher correlation in the areas near by middle cerebral arteries and their branches than the monitored Card signals, as shown in a red arrow. Even the correlation map with the measured PMU shows the SMS pattern, as shown in red circle, which is suspected to be the motion coherent artifact that contaminates Card phase measures.
Conclusion
PESTICA could be alternatively used in case that the physiological phase recording is not available or not accurate. PESTICA estimates the physiological noises with high accuracy in HCP data.Acknowledgements
Authors gratefully acknowledge Dr. Essa Yacoub for CMRR C2P support (CMRR_MB_EPI_VD13D_R014, CMRR_MB_EPIVB17A-UHF_R014), and HCP community for the helpful discussion.References
1. Hütel M, Melbourne A, Thomas DL, Rohrer J, Ourselin S. The hidden heart rate in the slice-wise BOLD-fMRI global signal. 2016, Proceeding of International Socieity of Magnetic Resonance in Medicine, 66
2. Viessmann O, Jezzard P, Moeller H. Improved Characterization of Low-Freqeuncy Fluctuations in Resting-State fMRI using GLM Correction of Baseline and Physiological Noise. 2016, Proceeding of International Socieity of Magnetic Resonance in Medicine, 3812
3. Beall EB, Lowe MJ. Isolating physiologic noise sources with independently determined spatial measures. Neuroimage. 2007;37(4):1286-300.
4. Glover GH, Li TQ, Ress D. Image-based method for retrospective correction of physiological motion effects in fMRI: RETROICOR. Magn Reson Med. 2000;44(1):162-7.
5. Beall EB. Adaptive cyclic physiologic noise modeling and correction in functional MRI. Journal of neuroscience methods. 2010;187(2):216-28.
6. Shin W, Beall E, Lowe MJ, The Improved Physiologic Estimation By Temporal ICA (PESTICA) in Resting State fMRI. 5th Biennial Conference on Resting State and Brain Connectivity; 2016; Vienna.
Figures