1645
7T-fMRI: Faster temporal resolution increases BOLD sensitivity and fMRI-based decoding performance specifically at high-spatial resolution1Anatomy and Neuroscience, The University of Melbourne, Melbourne, Australia, 2Department of Electrical & Electronic Engineering, The University of Melbourne, Australia, 3Imaging Division, Florey Institute of Neuroscience and Mental Health, Melbourne, Australia, 4Department of medicine and Neurology, The University of Melbourne, Australia, 5Siemens Healthcare, Melbourne, Australia
Synopsis
The benefits of ultra-high fMRI are maximized at high spatial resolutions with less physiological noise contribution. However, increasing the temporal resolution is often avoided at such high spatial resolutions due to limitations in the temporal signal-to-noise-ratio (tSNR). We investigated the effects of varying spatial and temporal resolutions on fMRI sensitivity measures at 7T, and their implications on an fMRI application, Brain-Computer-Interface (BCI). We demonstrate overall BOLD sensitivity increased with temporal resolution despite the tSNR decrease specifically at high-spatial resolution 7T-fMRI. We further demonstrate that this sensitivity increase also improved the accuracy of linear classifiers commonly used in BCIs.
Purpose
In fMRI, the temporal resolution is often decreased at high-spatial resolutions to improve the temporal signal-to-noise-ratio (tSNR). However, a systematic investigation into the effects of temporal resolution on overall BOLD sensitivity at ultra-high fields have not yet been conducted.
We hypothesized that a faster temporal resolution could improve the overall BOLD sensitivity by reducing the physiological noise contribution and more accurately sampling the signal. Then, any change in overall BOLD sensitivity should be mirrored in an fMRI application – namely, the decoding performance of an fMRI-based linear classifier commonly used in Brain-Computer-Interfaces1.
Methods
Six participants engaged in an ankle-dorsiflexion (15s-off; 5s-on; 4 trials for each ankle) fMRI experiment on a Siemens Healthcare 7T research MRI scanner with a 32-channel NOVA head coil. Functional images were acquired using multiband 2D GRE-EPI with parallel imaging at three different repetition times (TRs; 500ms, 1000ms and 2000ms) each at two spatial resolutions (i.e., voxel volume; VV; 1.5x1.5x1.5mm3 and 2x2x2mm3).
The bandwidth (~1980Hz/pixel), echo time (TE; 30ms) field-of-view (FOV; 224x224mm2), flip angle (Ernst angle for each TR; T1=2000ms2,3), echo spacing (0.67ms), EPI factor (148), PE shift factor (2), Partial Fourier (6/8), acquisition direction (A-P), multiband factor (3), GRAPPA factor (3), number of slices (21) and acquisition time (3.4min) were kept consistent across all GE-EPI scans.
The whole-coverage images were analysed at the individual level using the FMRIB’s Software Library’s (FSL v5.0.9) fMRI Expert Analysis Tool (FEAT v6.00)4. The data was motion corrected, brain extracted, pre-whitened, high-pass filtered, but was not spatially smoothed. Significant activations were defined using a lower Z-score threshold of 2.3 (p<0.01, cluster-based correction).
tSNR, observed range of percent signal change (%∆SRobs), volume of significant activation and Z-score were calculated from significant voxels in the primary motor cortex (M1) and the supplementary motor area (SMA) exclusively.
Decoding performance was measured by subjecting the normalised percent signal change time-courses from each significant voxel within M1 and SMA to linear classifiers using a leave-one-out cross validation approach. All values were averaged across voxels and trials.
Results
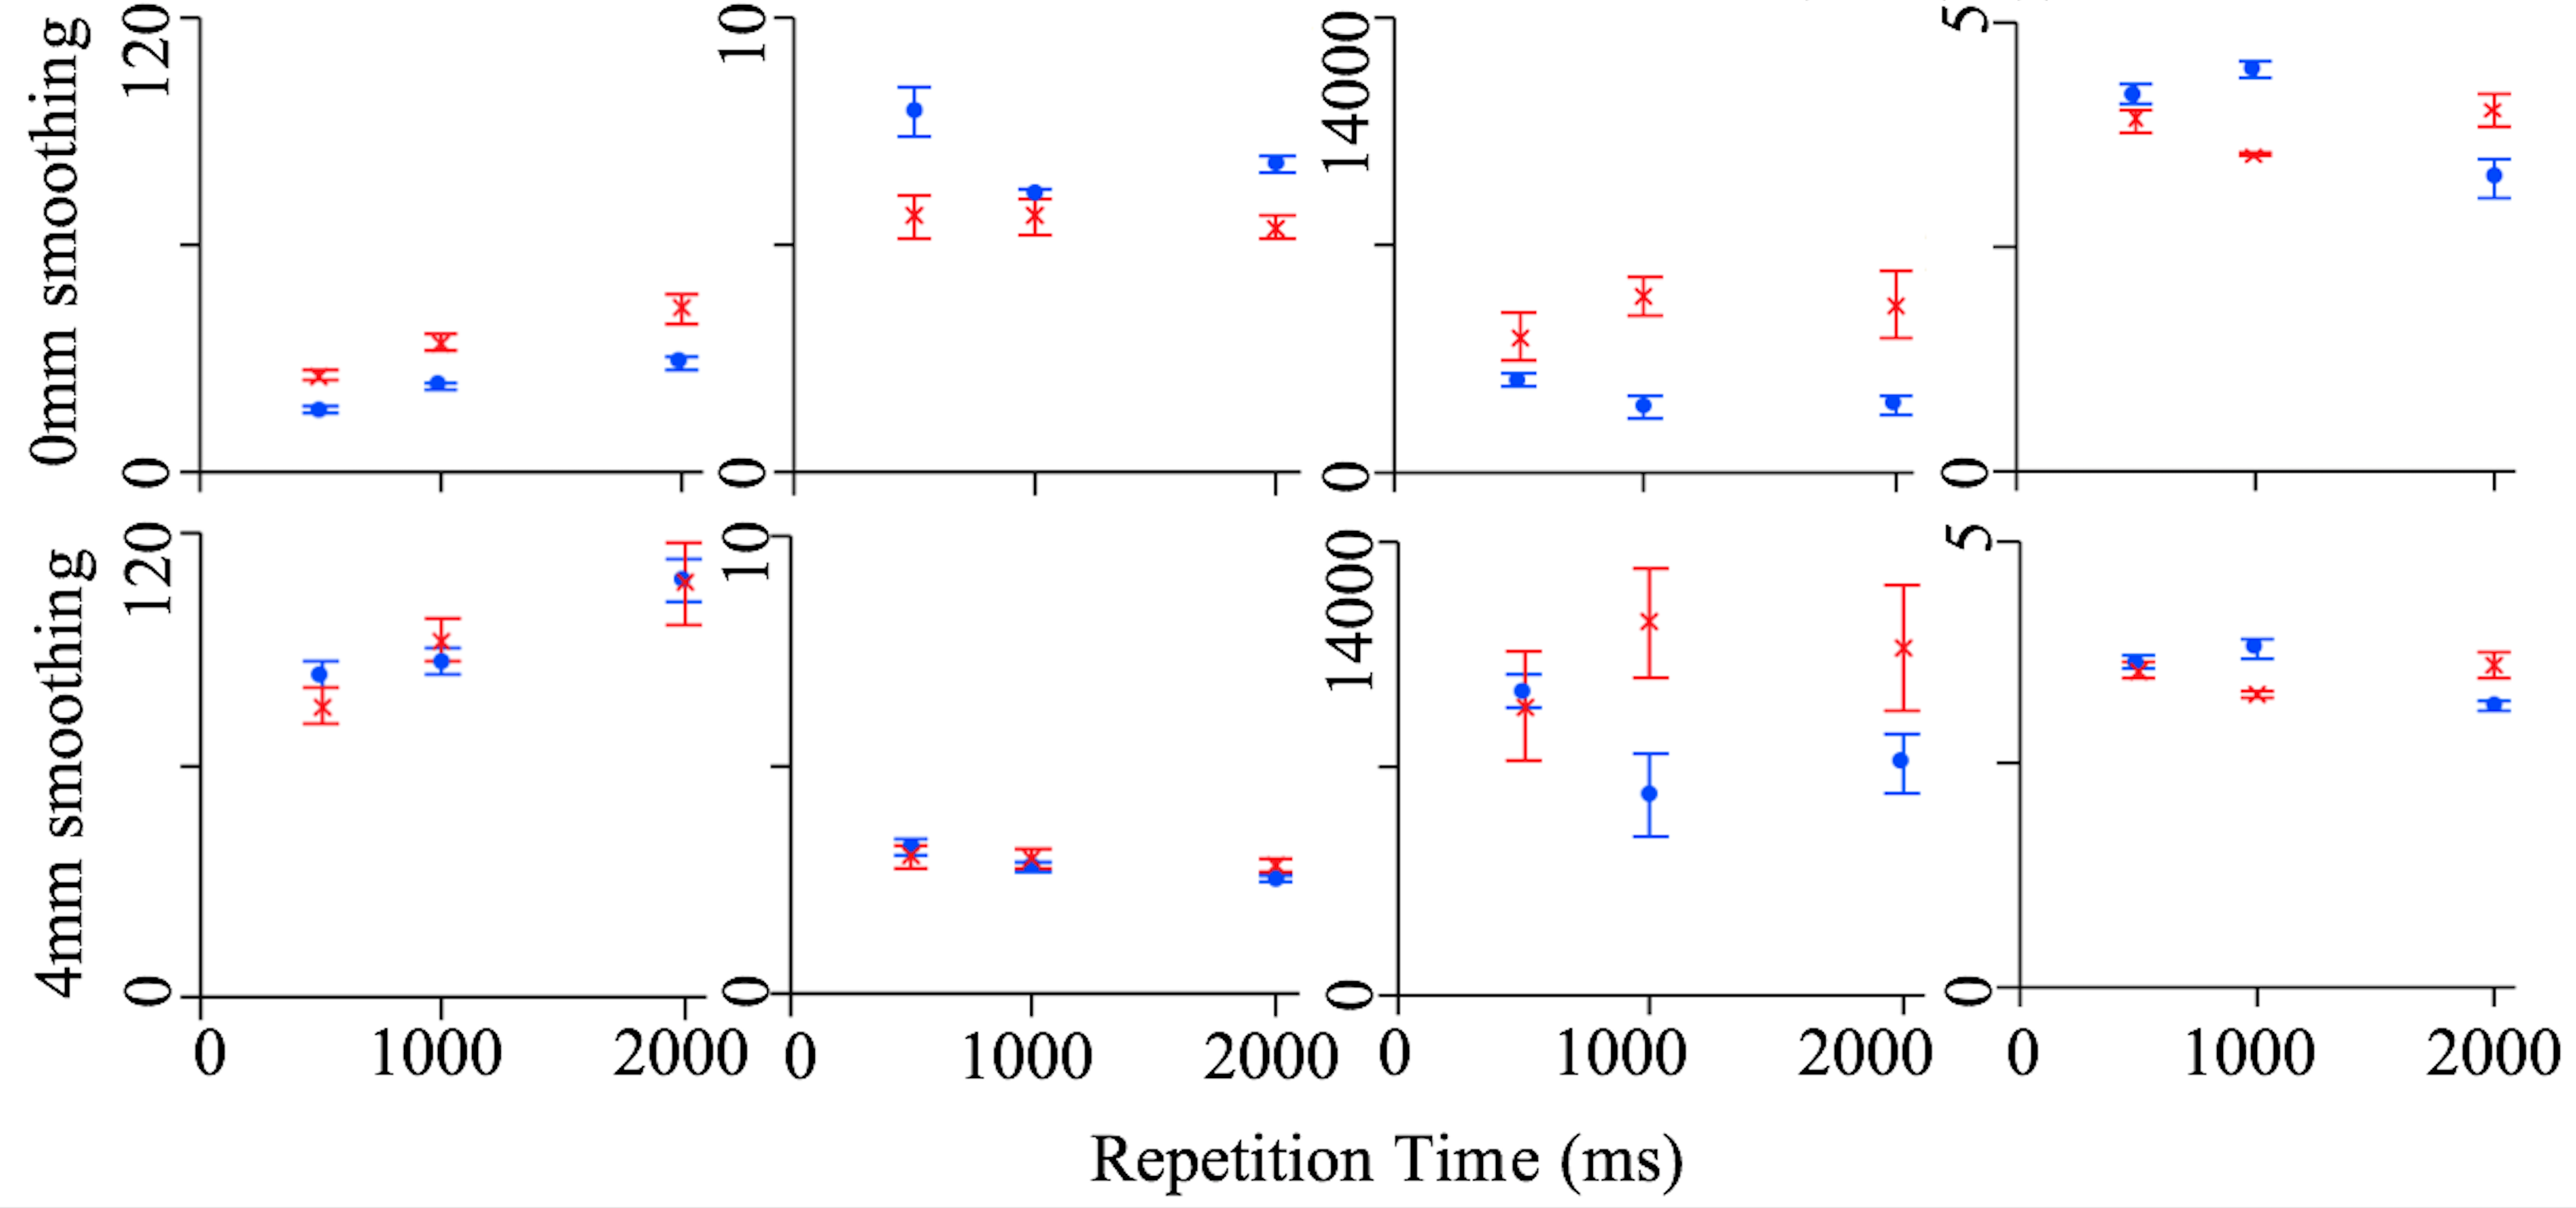
At VV of 1.5x1.5x1.5mm3, tSNR decreased to 16.26±0.79 (mean±standard error; SE) at TR of 500ms (Figure 1a; blue) from 1000ms (22.83±0.88; p<0.001) and 2000ms (29.45±2.34; p=0.003). tSNR also decreased at VV of 2x2x2mm3 to 26.13±1.74 at TR of 500ms (Figure 1a; red) from 1000ms (34.80±1.95; p=0.001) and 2000ms (44.14±4.53; p=0.005).
%∆SRobs increased to 7.90±0.56% at TR of 500ms from 1000ms (6.13±0.11; p=0.006) only at VV of 1.5x1.5x1.5mm3 (Figure 1b; blue).
The volume of significant activation did not differ across VV at TR of 500ms, or across TR at either VVs (Figure 1c). However, the volume of significant voxels did increase with VV significantly at TR of 1000ms and 2000ms (p=0.005 and p=0.018, respectively).
The Z-score increased from TR of 2000ms (3.15±0.12) to 1000ms (3.80±0.12; p=0.017) and 500ms (3.63±0.7; p=0.006) at VV of 1.5x1.5x1.5mm3 (Figure 1d; blue). Z-score increased from TR of 1000ms (3.27±0.036) to 500ms (3.54±0.10; p=0.006) at VV of 2x2x2mm3 (Figure 1d; red).
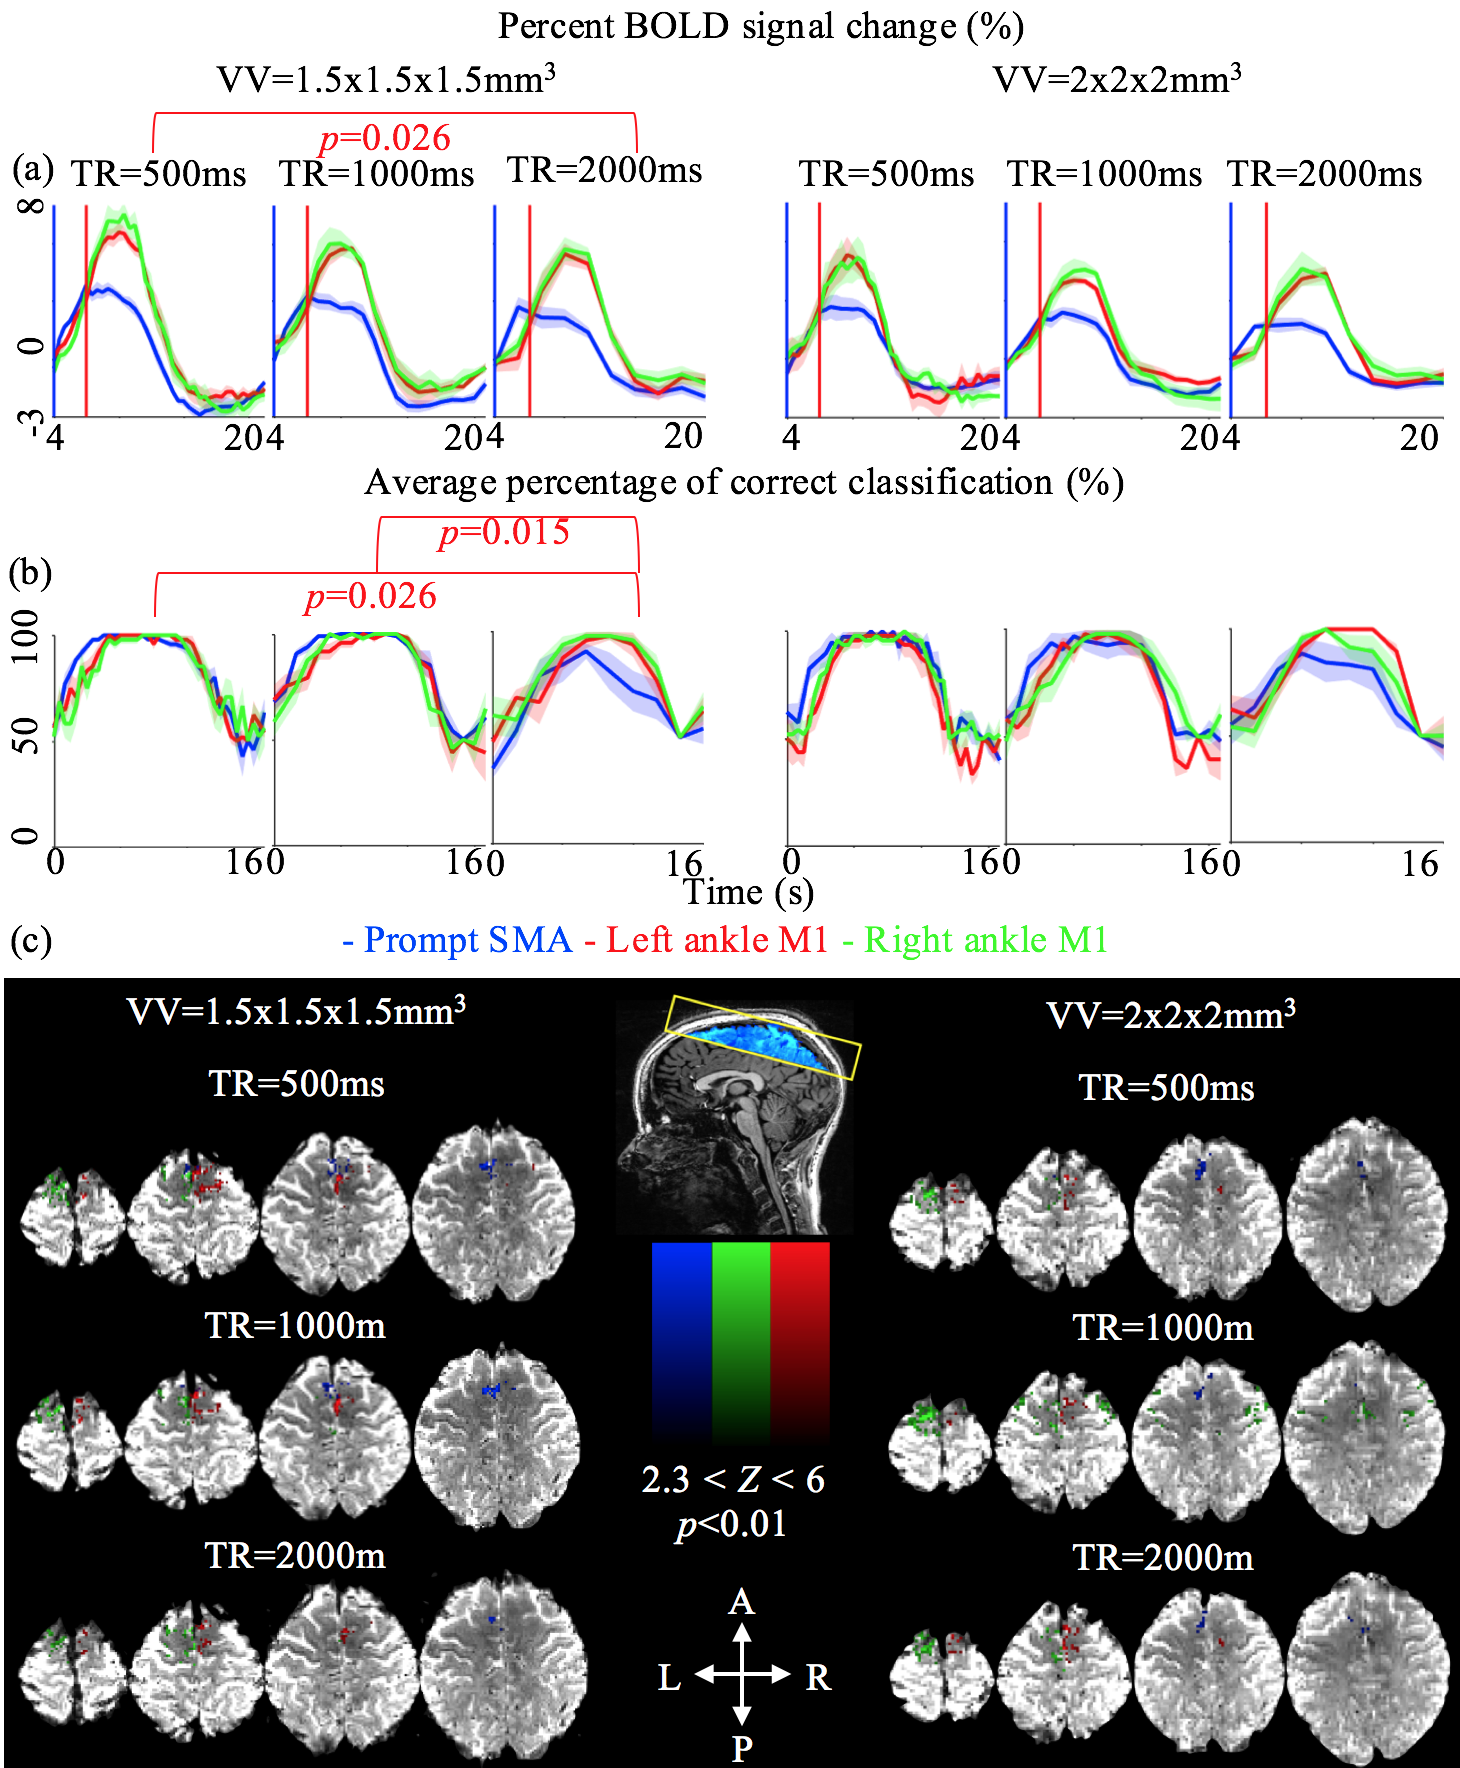
Decoding performance increased (Wilcoxon rank sum test; p<0.01) from TR of 2000ms (90.52±2.43%) to 500ms (98.71±0.62%; p=0.026) and 1000ms (98.88±0.54%; p=0.015) only at VV of 1.5x1.5.x1.5mm3 (Figure 2b). Robust activation was observed in the M1 and SMA (Figure 2c).
Discussion
We show that the apparent BOLD sensitivity can be increased with temporal resolution, however it is influenced by the spatial resolution. Only at the higher spatial resolution of 1.5x1.5x1.5mm3, did the %∆SRobs and decoding performance increase with temporal resolution despite a significant decrease in tSNR and plateauing of Z-scores. Further, the volume of significant activation was indifferent across the spatial resolutions exclusively at the TR of 500ms.
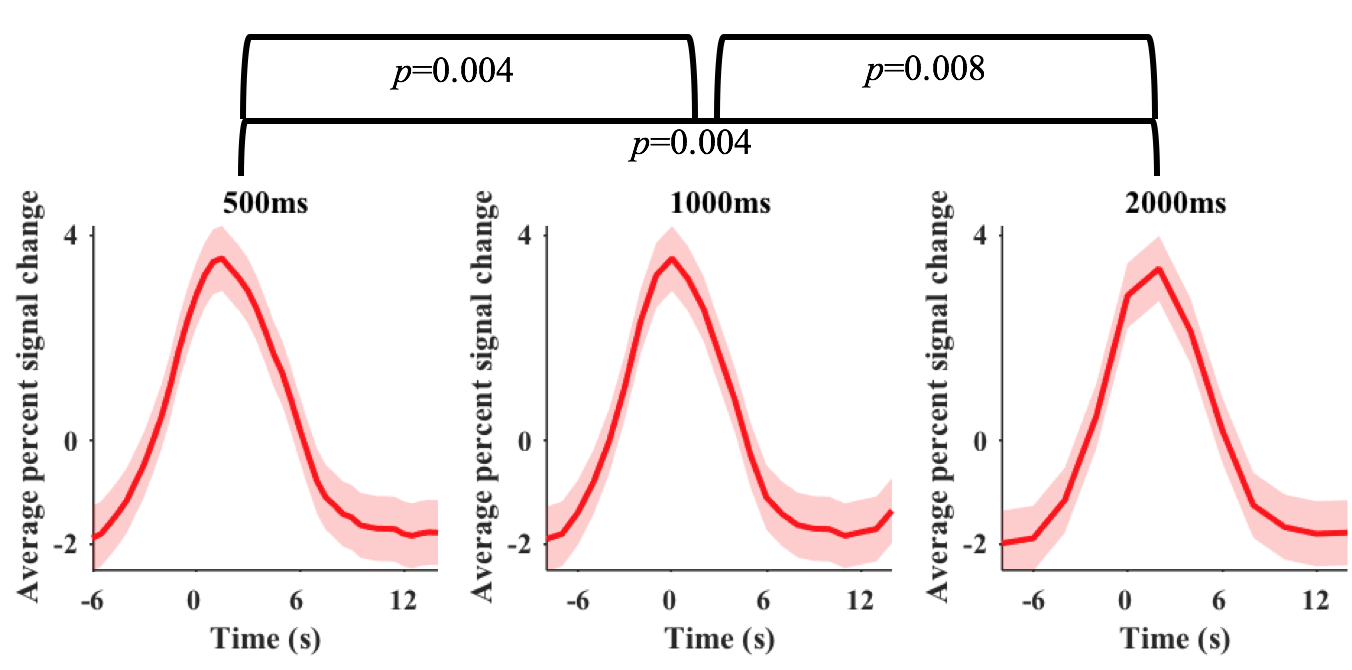
The current effect was attributed to the following factors. First, physiological noise level decreased with both spatial and temporal resolutions5,6. Second, the statistical power increased with temporal resolution, however plateaued at low tSNR10 (Figure 1e & Figure 1a). Third, faster sampling rate of faster TR increased the observed BOLD contrast (Figure 1b, Figure 2a & Figure 3) and improved the accuracy of the statistical modelling (Figure 1e & Figure 2c)7,8,9. Fourth, the noise and tSNR at the higher spatial resolution was too high for the effect of TR to be observed (Figure 1e & 1a).
Conclusion
These findings suggest that for high spatial resolution functional imaging of neural networks at 7T, increasing the temporal resolution could not only compensate but exceed the effect of subsequent decrease in tSNR, given an adequately high spatial resolution with minimal physiological noise level. Hence, the common practice of decreasing the temporal resolution at high-spatial resolutions to improve tSNR may lead to functional imaging in suboptimal resolutions at ultra-high fields.Acknowledgements
Acknowledgments We thank: We acknowledge the facilities, and the scientific and technical assistance of the Australian National Imaging Facility at the Melbourne Brain Centre Imaging Unit. The work was also supported by a research collaboration agreement with Siemens Healthcare, (Erlangen, Germany). All functional images were acquired using a Siemens Healthcare prototype research sequence.
Funding Funding: This work was supported by DARPA, the Office of Naval Research (ONR) Global, National Health and Medical Research Council of Australia (NHMRC), Defence Health Foundation, Australia and the author J. O. C was funded by the University of Melbourne McKenzie Fellowship.
References
1. Lotte, F., Congedo, M., Lecuyer, A., Lamarche, F., Arnaldi, B., 2007. A review of classification algorithms for EEG-based brain-computer interfaces. J Neural Eng 4, R1-R13.
2. Hernandez-Garcia, L., Lewis, D.P., Moffat, B., Branch, C.A., 2007. Magnetization transfer effects on the efficiency of flow-driven adiabatic fast passage inversion of arterial blood. NMR Biomed 20, 733-742.
3. Wright, P.J., Mougin, O.E., Totman, J.J., Peters, A.M., Brookes, M.J., Coxon, R., Morris, P.E., Clemence, M., Francis, S.T., Bowtell, R.W., Gowland, P.A., 2008. Water proton T1 measurements in brain tissue at 7, 3, and 1.5 T using IR-EPI, IR-TSE, and MPRAGE: results and optimization. MAGMA 21, 121-130.
4. Jenkinson, M., Beckmann, C.F., Behrens, T.E., Woolrich, M.W., Smith, S.M., 2012. Fsl. Neuroimage 62, 782-790.
5. Triantafyllou, C., Hoge, R.D., Krueger, G., Wiggins, C.J., Potthast, A., Wiggins, G.C., Wald, L.L., 2005. Comparison of physiological noise at 1.5 T, 3 T and 7 T and optimization of fMRI acquisition parameters. Neuroimage 26, 243-250.
6. Triantafyllou, C., Polimeni, J.R., Keil, B., Wald, L.L., 2016. Coil-to-coil physiological noise correlations and their impact on functional MRI time-series signal-to-noise ratio. Magn Reson Med.
7. Fera, F., Yongbi, M.N., van Gelderen, P., Frank, J.A., Mattay, V.S., Duyn, J.H., 2004. EPI-BOLD fMRI of human motor cortex at 1.5 T and 3.0 T: sensitivity dependence on echo time and acquisition bandwidth. J Magn Reson Imaging 19, 19-26.
8. Constable, R.T., Spencer, D.D., 2001. Repetition time in echo planar functional MRI. Magn Reson Med 46, 748-755.
9. Chang, W.T., Nummenmaa, A., Witzel, T., Ahveninen, J., Huang, S., Tsai, K.W., Chu, Y.H., Polimeni, J.R., Belliveau, J.W., Lin, F.H., 2013. Whole-head rapid fMRI acquisition using echo-shifted magnetic resonance inverse imaging. Neuroimage 78, 325-338.
10. Constable, R.T., Spencer, D.D., 2001. Repetition time in echo planar functional MRI. Magn Reson Med 46, 748-755.Figures