1643
Reduction of Scanner’s Noise in Recorded Voice Responses Using an Inline Reference Scanner’s Noise for Automated Measurement of Voice Response Time in Overt Speech fMRI1Institute of Applied Life Sciences, Human MR Center, University of Massachusetts Amherst, Amherst, MA, United States, 2Department of Communication Disorders, University of Massachusetts Amherst, Amherst, MA, United States
Synopsis
The overt voice response in fMRI is critical to aphasia
neuroimaging studies. A commercially available active noise cancelling
microphone makes this application possible. However, an automated measurement
of the voice response time is not reliable due to remaining scanner noises. The
incomplete noise cancellation is due to uneven slice time intervals in the EPI
sequence. The remaining noise was reduced using a post-processing approach
based on a previously published method that used a template of a reference
noise. The response time was measured from the noise-reduced voice signal using
an amplitude and duration threshold after an envelope filtering.
Purpose
fMRI with overt voice responses has been applied to the study of neuroscience1 and aphasia therapy2. The scanner’s acoustic noise in the recorded voice responses has been reduced using a post-processing method3 and more recently an active noise cancellation (ANC) microphone. The ANC microphone suppresses the scanner’s noise significantly, but it is not sufficient in measuring the voice response time automatically due to a remaining scanner noise. We applied the post-processing method3 to the voice responses recorded using an ANC microphone for an automatic measurement of the voice response time.Methods
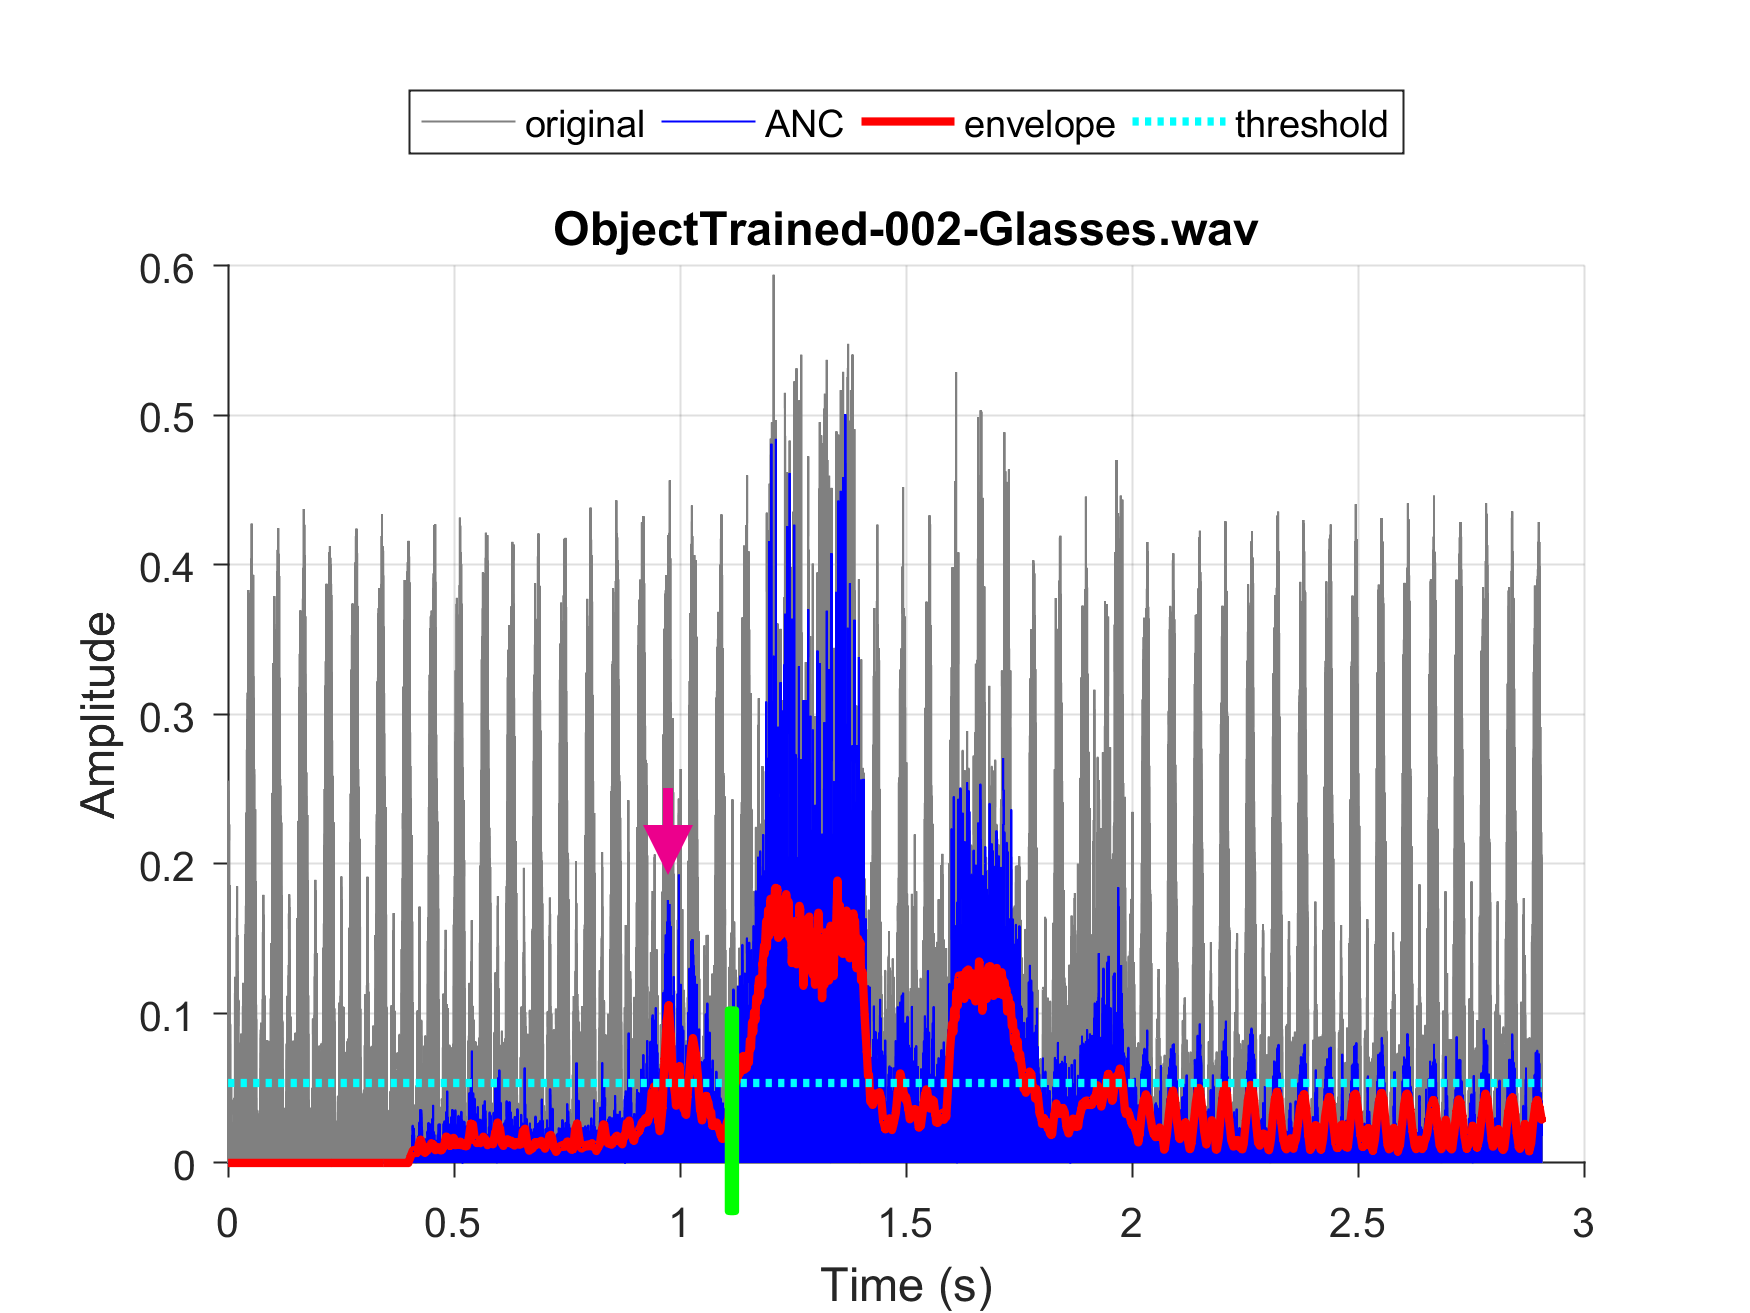
An ANC microphone FOMRI-III included in an OptoActive system (OptoAcoustics)4 was attached to a head RF coil (20-ch) of a 3T whole body MRI system. A gradient echo EPI sequence was used with a repetition time (TR) of 2.5 s for 43 slices and an echo time of 30 ms. The remaining scanner’s noise was evaluated by recording with ANC off and on using a phantom. The microphone signal and the trigger pulse from the USB output of the OptoActive console were recorded using OptiMRI 3.2. The voice signal from the earphone output of OptoActive was connected to a MIC input of a PC. Each event of a voice response was recorded using a SlideSoundIn sub-object of an ePrime2 program. The fMRI task was to name a picture overtly within 3 s as illustrated in Fig. 1. A temporarily later 2.5-s portion of the voice response was analyzed due to a delay in the voice response. The scanner’s noise recorded during the fixation period prior to a block of 5 pictures was used as a template for each block. The slice time interval of an EPI sequence is not evenly distributed. The slice interval after the last slice is longer than other slice time intervals by 20 ms to correct a B0 drift (Fig. 2).5 Therefore, The template duration was set to TR (2.5 s) and it was captured in a later portion of the recorded sound during the 5-s fixation. The scanner’s noise in the voice response was searched with a maximum correlation coefficient between a portion of the voice response and the circularly rotated template. The search range for the rotation time was limited to a slice time. The scanner’s noise in the voice response was subtracted by the rotated template. The voice response time was measured using an amplitude threshold on the envelope of the noise-suppressed voice response. The amplitude threshold was set adaptively by a scaled (typically 0.4) average of the envelope above a background noise level. Additionally, a duration of the envelope over the amplitude threshold was filtered over a user-defined minimum duration (typically 60 ms) to avoid a false detection. The method was tested on a phantom and control subjects followed by application to aphasia patients.Results
The scanner’s noise was significantly suppressed by ANC of OptoActive (Fig. 3) although remaining noise signals were observed during RF excitations. However, there was a noticeably unsuppressed noise during the 1st slice, which might be attributed to a failure of the OptoActive system in coping with the unevenly distributed slice time (Fig. 2). The unsuppressed noise at the 1st slice was observed in the recorded voice responses as well (Fig. 4). Both the remaining noises including the unsuppressed noise at the first slice were further removed by the proposed method. The envelope filtering removed resisting noises allowing a detection of the voice response using an amplitude threshold (Fig. 4). Other noise signals over the amplitude threshold were further filtered out by the duration filtering (Fig. 5). The amplitude threshold needed to be lowered for words with a soft leading phoneme such as ‘swan’ and ‘smoking’.Discussions
The recording of each voice response is advantageous compared to recording an entire run into one file to analyze voice response time and accuracy. The update of the noise template in each block would help adopt dynamically to the change of sound environment due to subject motion.3 The separation of other noise from the soft leading phoneme might be another challenge to overcome.Conclusion
The unevenly distributed slice time of an EPI sequence resulted in an insufficient ANC of the OptoActive system. The additional removal of the remaining scanner’s noise by the proposed method contributed to an automated measurement of the voice response time.Acknowledgements
This research was supported by funding from the National Institute on Deafness and Other Communication Disorders (NIDCD) of the National Institutes of Health under award number R01DC011526 (Kurland, PI). The content is solely the responsibility of the authors and does not necessarily represent the official views of the National Institutes of Health.References
1. Anderson JR, et al. Information-processing modules and their relative modality specificity. Cogn Psychol 2007;54(3):185-217.
2. Kurland J, et al. Constrained versus unconstrained intensive language therapy in two individuals with chronic, moderate-to-severe aphasia and apraxia of speech: behavioral and fMRI outcomes. Am J Speech Lang Pathol 2012;21(2):S65-87.
3. Jung KJ, et al. Extraction of overt verbal response from the acoustic noise in a functional magnetic resonance imaging scan by use of segmented active noise cancellation. Magnetic resonance in medicine : official journal of the Society of Magnetic Resonance in Medicine / Society of Magnetic Resonance in Medicine 2005;53(3):739-744.
4. OptoAcoustics. OptoActive™: The MR communications system you've dreamed of. http://www.optoacoustics.com/medical/optoactive.
5. Benner T, et al. Real-time RF pulse adjustment for B0 drift correction. Magnetic resonance in medicine : official journal of the Society of Magnetic Resonance in Medicine / Society of Magnetic Resonance in Medicine 2006;56(1):204-209.
Figures
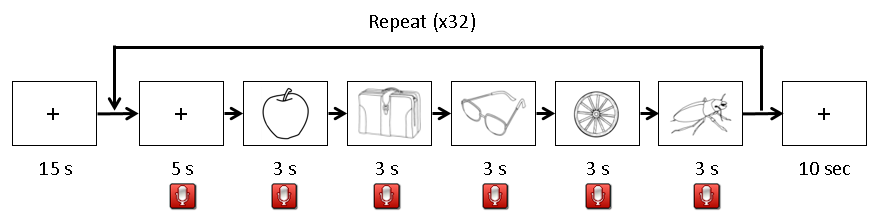
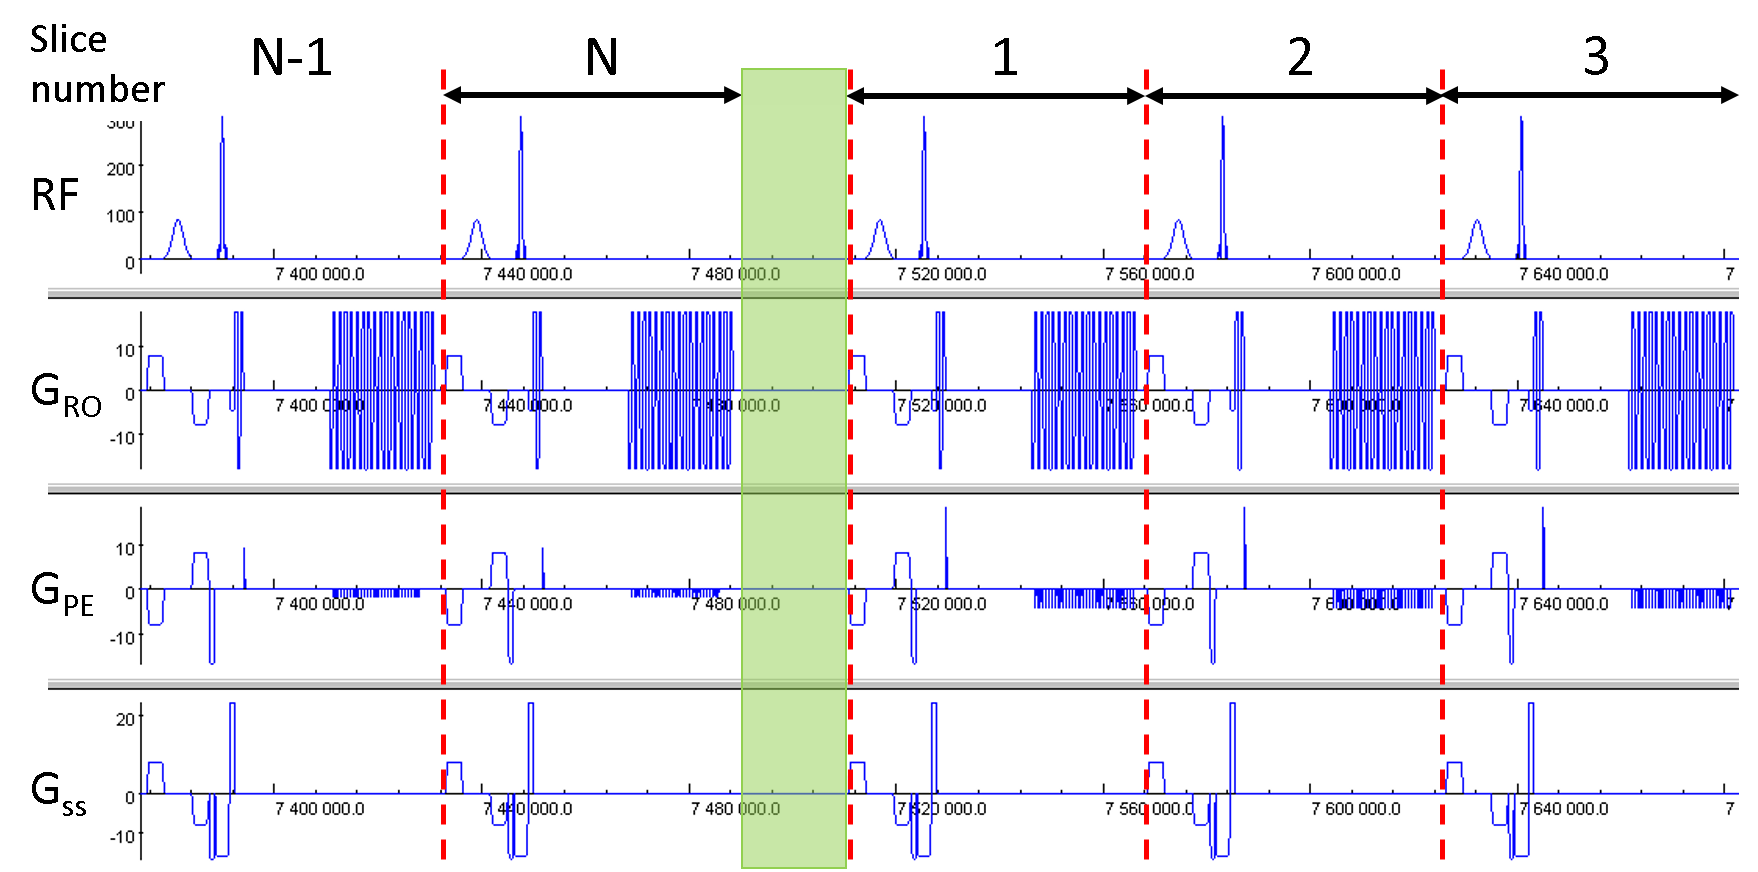

Fig. 3. Recorded waveforms of scanner’s noise. (A) A trigger pulse. (B) and (C) The scanner’s noise before and after the active noise cancellation, respectively. The slice numbers are listed on the top with the slice timing marked with red dotted vertical lines. The horizontal arrow lines indicate the slice interval which demonstrated the extended slice interval of the last slice with a slice number N. Note the increased remaining scanner’s noise at the 1st slice after the trigger pulse.