1642
Group differences in default mode network connectivity not just anti-correlation depend on choice of nuisance regressor model1Radiological Sciences, Division of Clinical Neuroscience, University of Nottingham, Nottingham, United Kingdom, 2Arthritis Research UK Pain Centre, University of Nottingham, Nottingham, United Kingdom, 3Sir Peter Mansfield Imaging Centre, University of Nottingham, Nottingham, United Kingdom
Synopsis
Resting state fMRI is prone to a large range of factors affecting the acquired data and processing pipelines available, which can impact on the outcome of a study. This study assessed the similarity of time series taken from aCompCor outputs to global signal to assess the inclusion of a ‘proxy’ global signal and its effect on group-wise tests of default-mode connectivity. The first components of both white matter and CSF were highly correlated with global signal and regressing either global signal or aCompCor outputs altered group-comparisons of functional connectivity. Future studies should scrutinise and report their postprocessing pipelines clearly.
Introduction
Resting state fMRI (rsfMRI) has proved to be a fruitful source of findings in the study of spontaneous fluctuations in brain activity. Studies commonly report finding spatially- and temporally-correlated networks such as the “default mode” and “salience” networks1. However, rsfMRI is prone to a large range of factors affecting the acquired data and processing pipelines available, which can impact on the outcome of a study2. One particularly controversial choice is whether to include or avoid global signal regression. This is commonly argued for to minimise the effect of global movement and physiological noise but has previously been shown to induce spurious anti-correlations in the data as well as unmasking distance-dependent artefacts3,4. aCompCor is a data driven approach that has been used previously to control for physiological noise without the inclusion of global signal but has recently been observed to produce results similar to those when global signal was regressed out4,5. This study assessed the similarity of time series taken from aCompCor outputs to global signal and whether these were significantly correlated to one another suggesting the inclusion of a ‘proxy’ global signal. Additionally, we assessed whether connectivity results were consistent when including a ‘proxy’ (aCompCor) or true global signal and compared this to whole-tissue white matter and grey matter tissue time series regression and whether this might affect group-wise tests of default-mode connectivity.Methods
We ran aCompCor (extracting the 1st-5th PCA components for WM & CSF)7. The time series for each of these components was then correlated vs. global signal to assess whether global signal regression was being carried out by proxy. Resting fMRI data used were from 25 chronic knee osteoarthritis patients (mean age 67yrs, 15 males) without co-morbidities and 19 healthy volunteers (mean age 64yrs, 8 males) previously reported for amygdala seed based functional connectivity fMRI6. As part of the multimodal MRI biomarker discovery study (3T, MR750, GE Healthcare) all patients underwent a resting state BOLD fMRI (GE-EPI: TE/TR=32/2000ms, 35 slices, voxel size=3.75x3.75mmx3.6mm, 160 volumes) using a 32-channel head coil. Image pre-processing was performed using FSL 5.0.8 (FMRIB software library) on subjects whom had passed QA tests based upon inspection of raw data9. A seed-based default mode network analysis (6mm sphere in the PCC; MNI xyz -8, -50, 28) was run to assess the effect of including global signal or using aCompCor on group-wise analyses. This included regressing six motion parameters alongside three approaches: 1. Regressing out only white matter and CSF signal (T1 tissue segmentations were acquired using FSL FAST and then eroded by 2 voxels), 2. Additionally including global signal regression to the previous model, 3. Running aCompCor using the top five white and grey matter component time courses8.Results
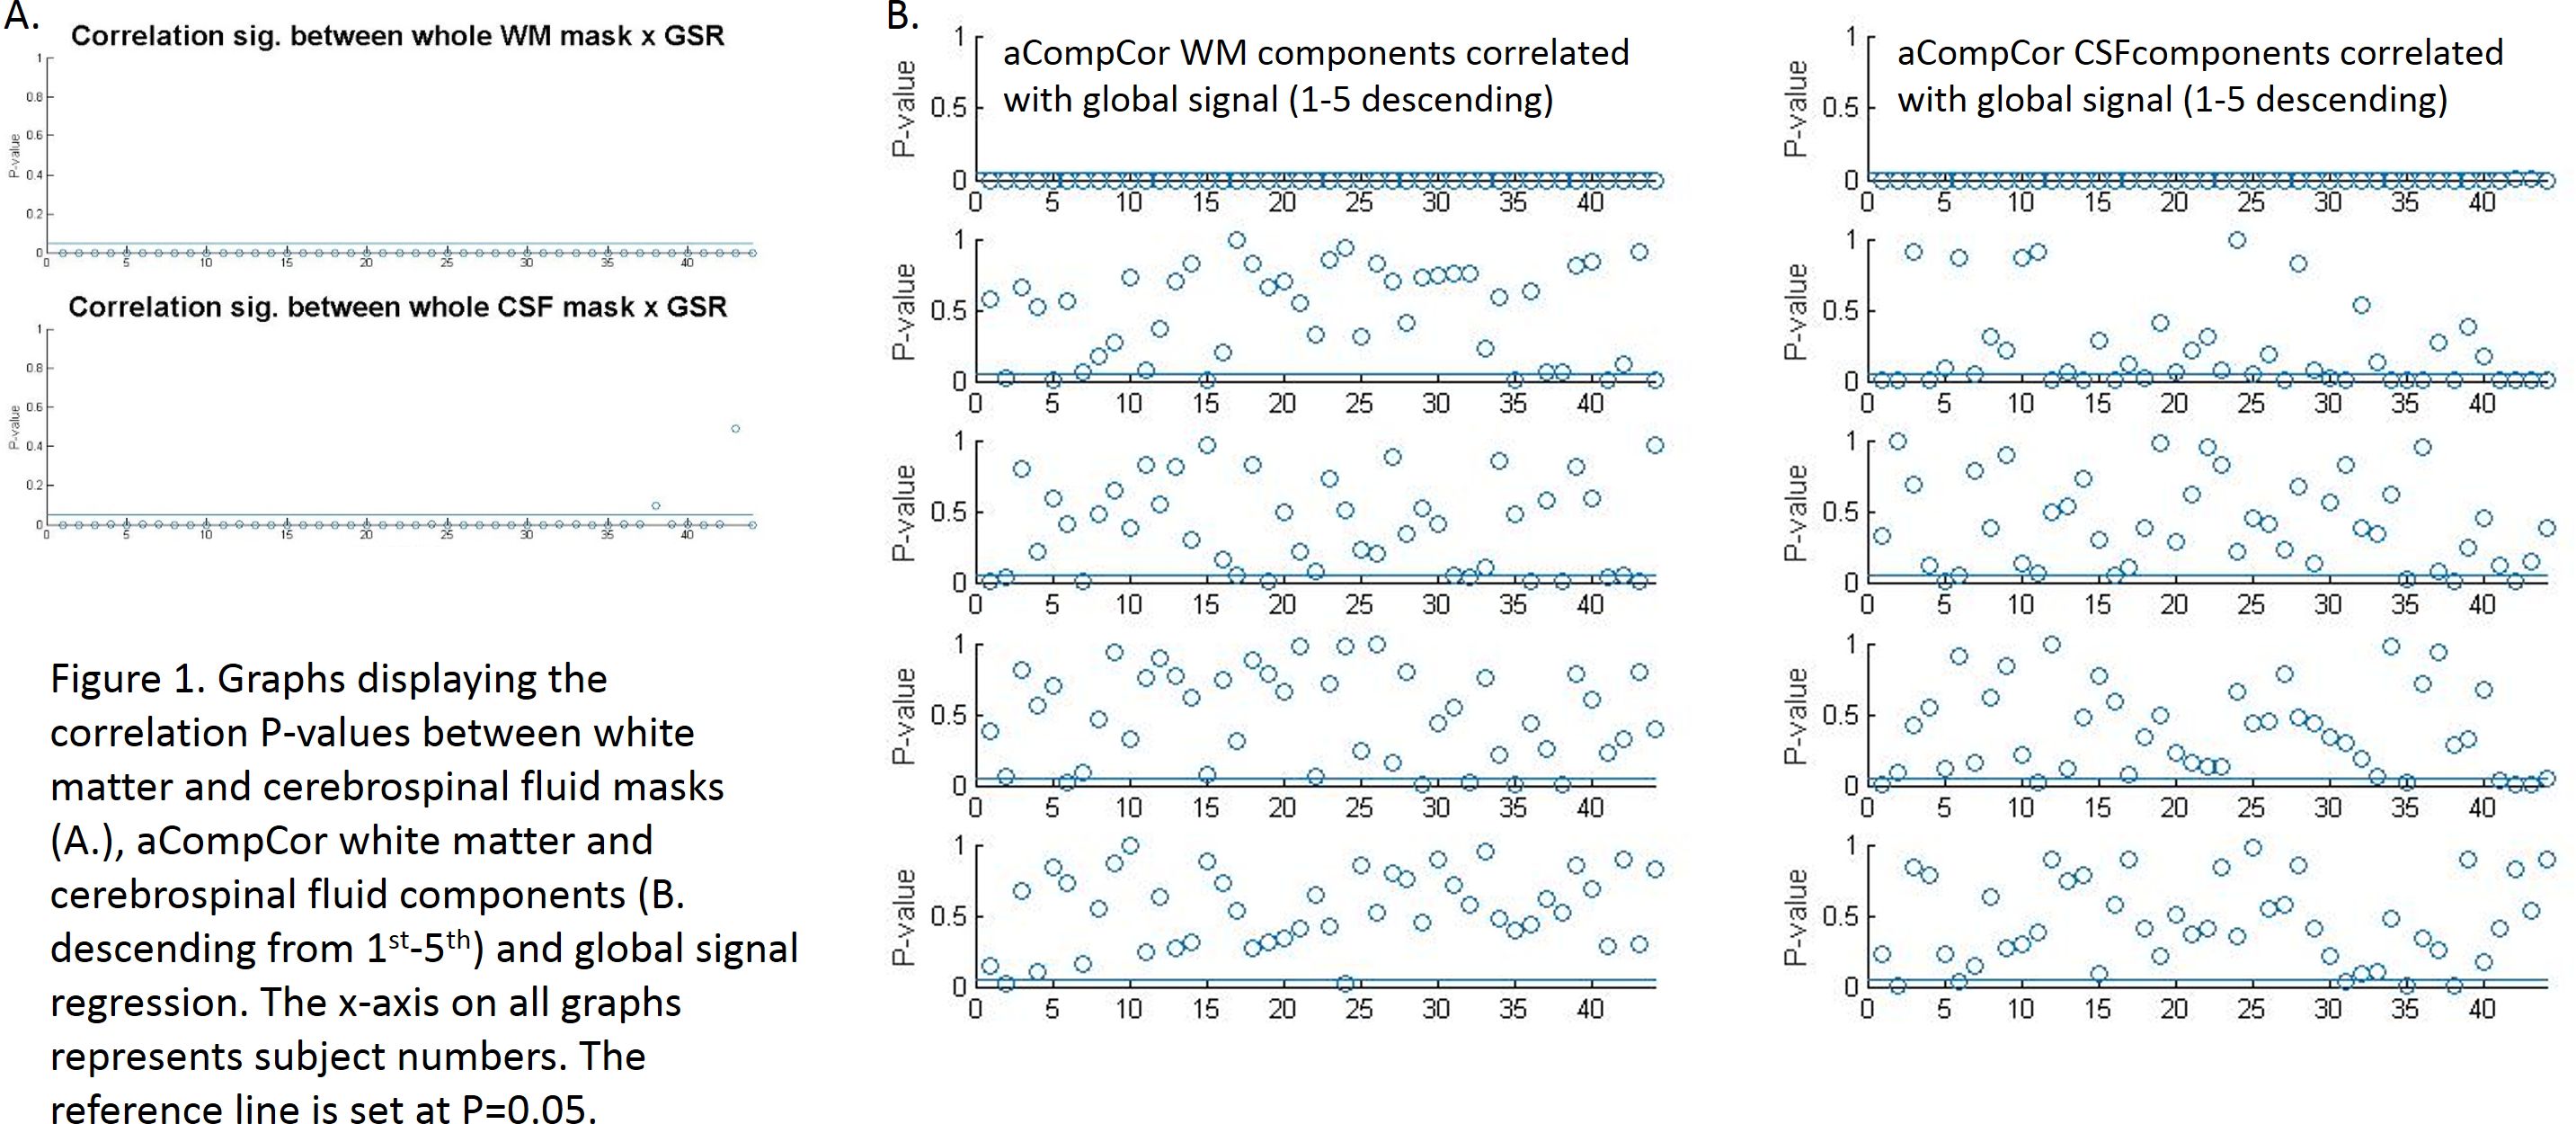
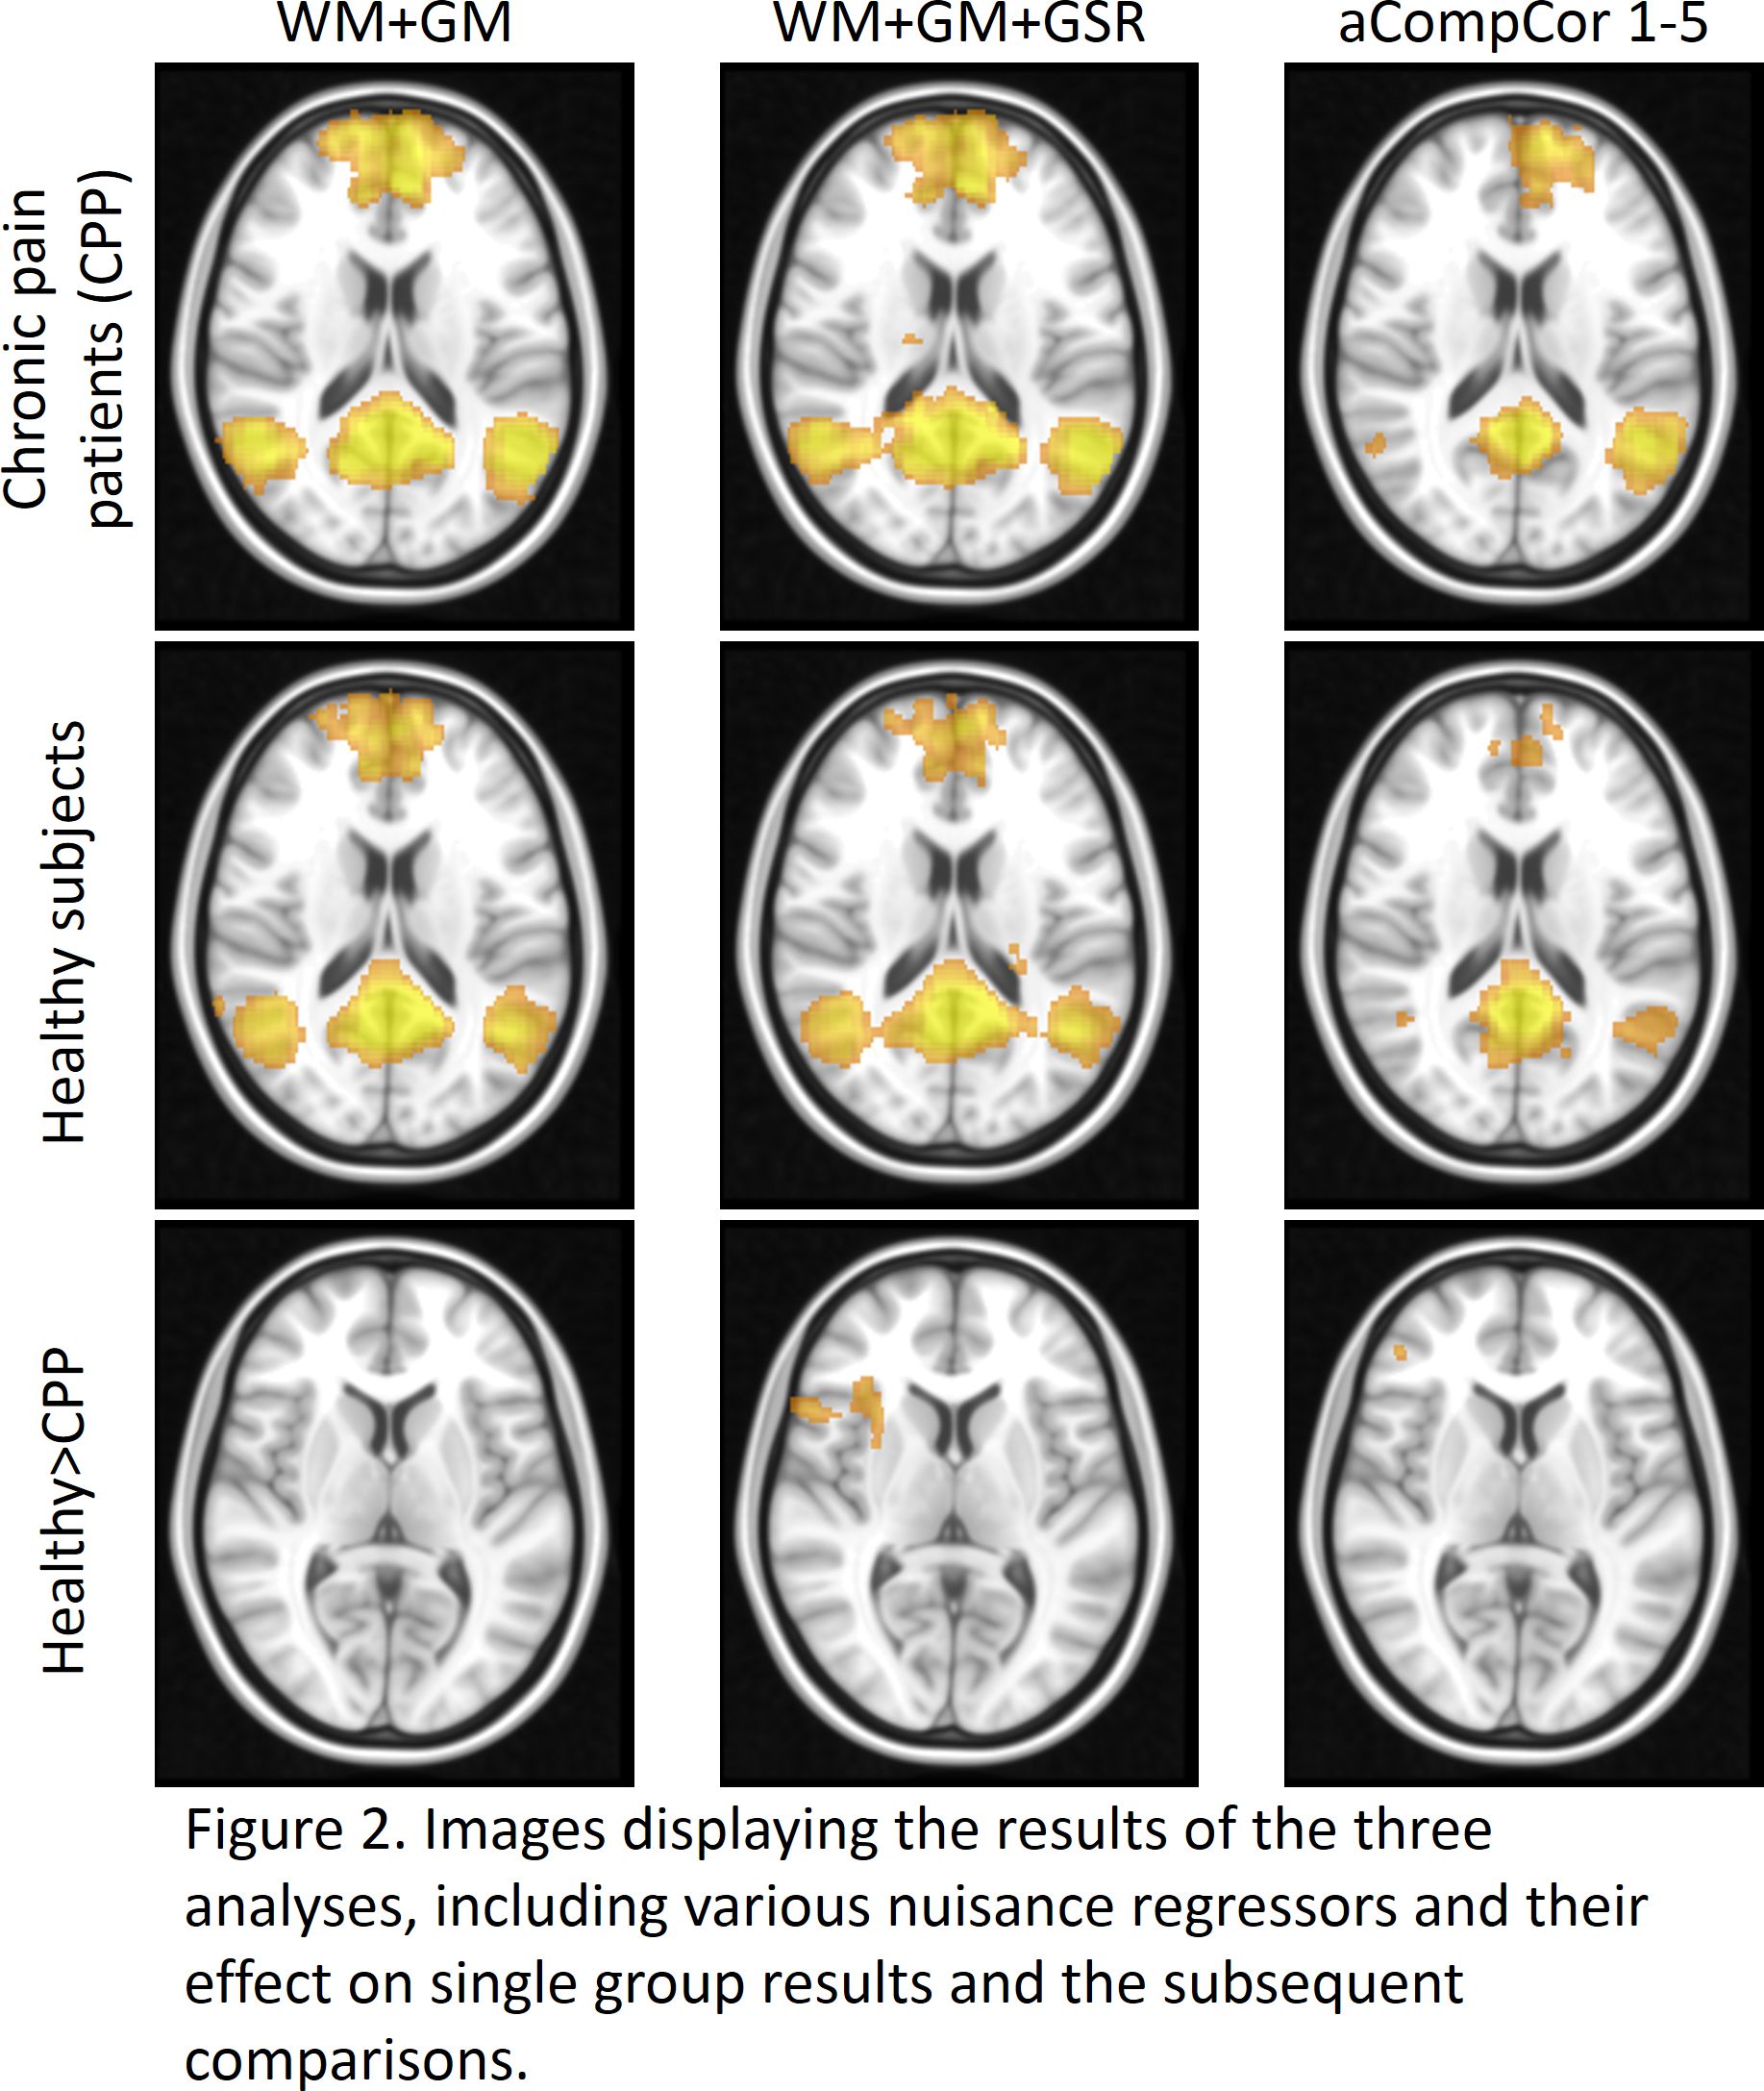
Initial assessment of whether nuisance regressors correlated with global signal revealed that whole-tissue segmentations of WM showed the highest correlations with global signal with CSF also significantly correlating (albeit to a lesser extent) (Fig 1A.), followed by the 1st component of WM and CSF tissue (as calculated using aCompCor – Fig 1B. We can therefore take the pragmatic view that those approaches correlating highly with global signal (whole-tissue CSF/WM, aCompCor) were applying a proxy global signal regression or not at all (2-5th aCompCor components). Assessing the impact of these regressors on group analysis, significant group comparisons were found between healthy subjects > chronic pain patients only in analyses 2 and 3 with marked differences between analysis 2 and 3. Analysis 1 found no significant differences between groups Fig 2).Discussion
We find that the first component output from aCompCor for signal from white matter and cerebrospinal fluid correlate highly with global signal and as such might serve as a ‘proxy’ global signal regression driving the similar results in previous reports4,5. These results highlight the need for strict reporting in regards to the methodological approach and the need to scrutinise what signal is being regressed out in software packages that might do this automatically without input from users against unfounded claims in the literature. Importantly, default mode connectivity changes are commonly reported across a vast range of brain diseases and in chronic pain disorders, and it is concerning how the choice of nuisance regression in postprocessing has altered the results so profoundly. It is conceivable that the choice of postprocessing pipelines may account for much of the inconsistency within the published literature. It remains beyond the scope of this study to suggest a ‘correct’ approach but it does highlight the need for careful reporting of group differences, preferably in the presence of different postprocessing pipelines for within-study comparison.Acknowledgements
No acknowledgement found.References
1. Seeley WW, et al (2007). The Journal of Neuroscience. 27 (9): 2349-2356
2. Carp J (2012). Frontiers in Neuroscience. 11;6:149
3. Murphy K, et al (2009). NeuroImage. 44: 893-905
4. Ciric R, et al (2016). arXiv:1608.03616 [q-bio.NC]
5. Siegel JS, et al (2016). PNAS. 113 (30): E4367-4376
6. Cottam WJ, et al (2016). Proceedings of the ISMRM conference meeting. Singapore.
7. Behzadi Y, et al (2007). NeuroImage. 37: 90-101
8. Chai XJ, et al (2012). NeuroImage. 59: 1420-1428
9. Friedman L & Glover GH (2006). Journal of Magnetic Resonance Imaging. 23: 827-839
Figures