1638
Comparison of fMRI analysis methods for heterogeneous BOLD responses in block design studies1Stanford University, Palo Alto, CA, United States
Synopsis
Improper selection of analysis methods can lead to significant errors when analyzing fMRI data with heterogeneous BOLD responses. Here, we used rodent optogenetic fMRI data and simulations to investigate different analysis methods’ detection and characterization performance. Our results show that, in the presence of heterogeneous BOLD responses, conventionally used GLM with a canonical basis set leads to considerable errors, while the gamma, finite impulse response, B-spline, and Fourier basis sets show robust performance.
Purpose
Accurate detection and characterization are challenging when BOLD responses exhibit a large variability in the temporal dynamics1-3. In some cases, commonly used general linear model (GLM) with a canonical HRF can cause substantial detection and characterization errors4-6. Nevertheless, it is currently not clear which methods are optimal in these scenarios. This is partially due to the large set of analysis approaches available, yet few comprehensive evaluations have been conducted, especially in block-design studies. Here, we address this issue by systematically evaluating a series of standard analysis methods against heterogeneous BOLD responses.Methods
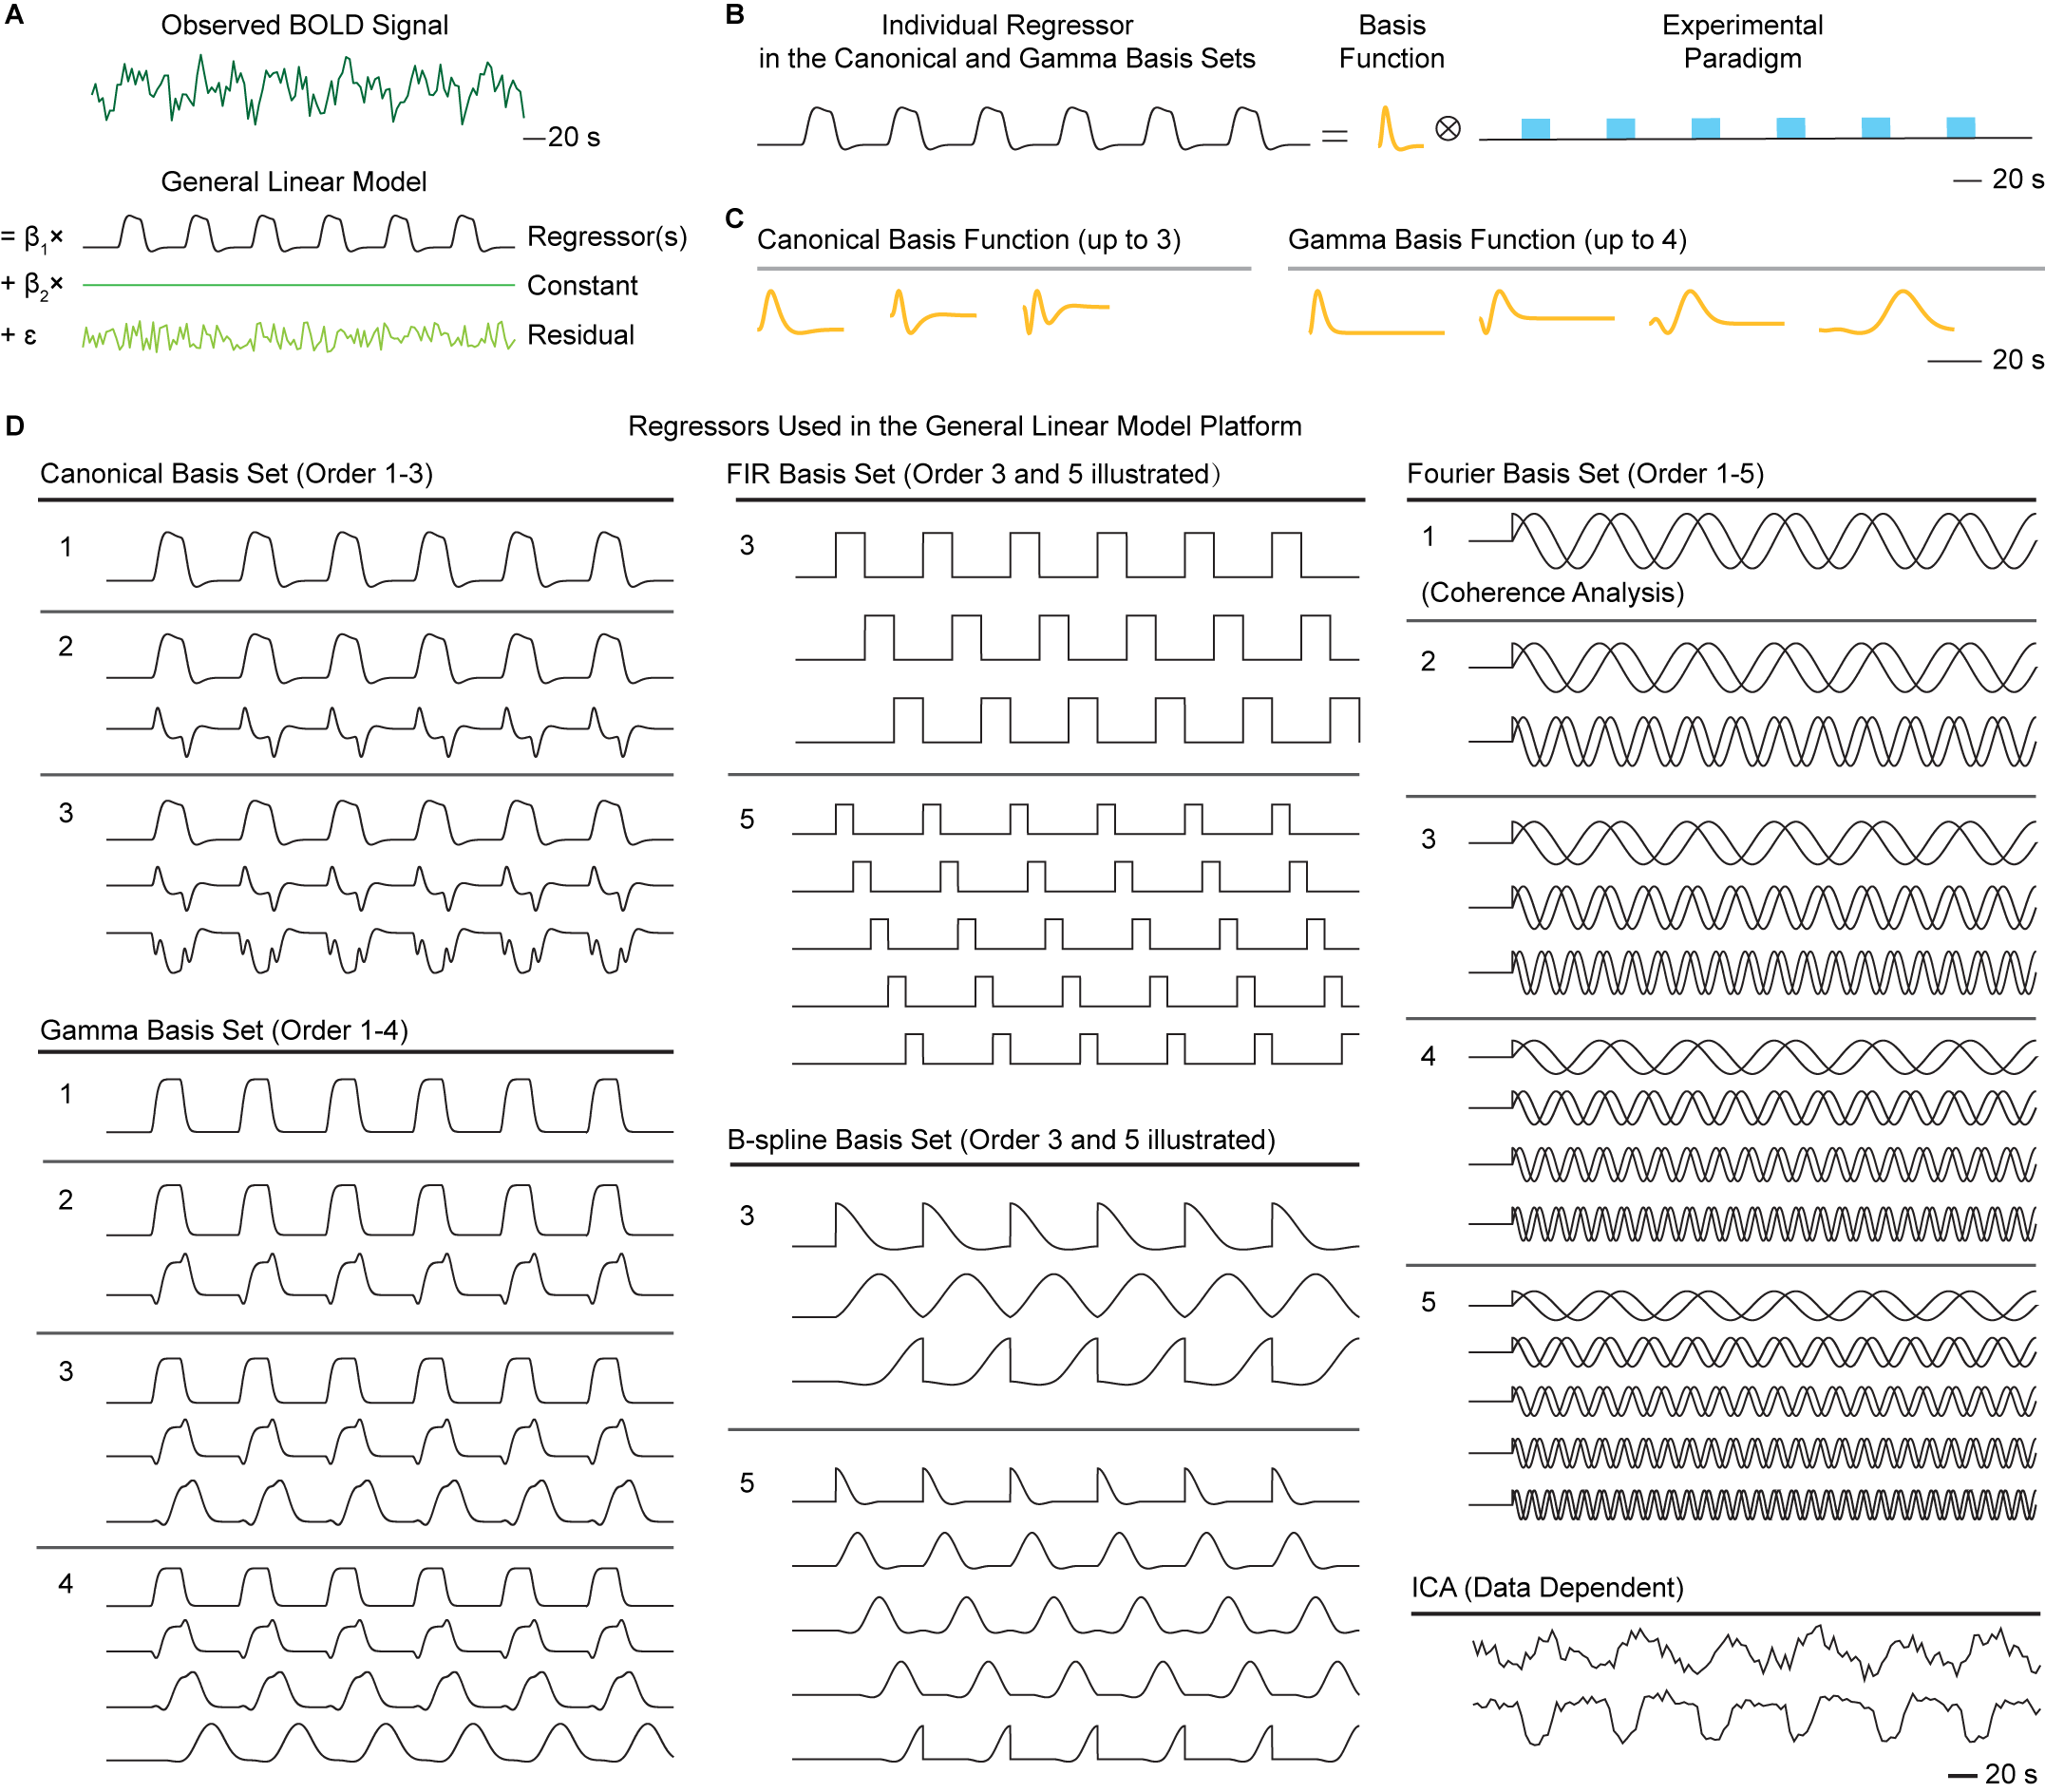
Six different approaches were evaluated, including model-based canonical7, gamma, finite impulse response (FIR), B-spline, and Fourier basis sets, as well as data-driven method, such as independent component analysis (ICA)8 (Fig. 1).
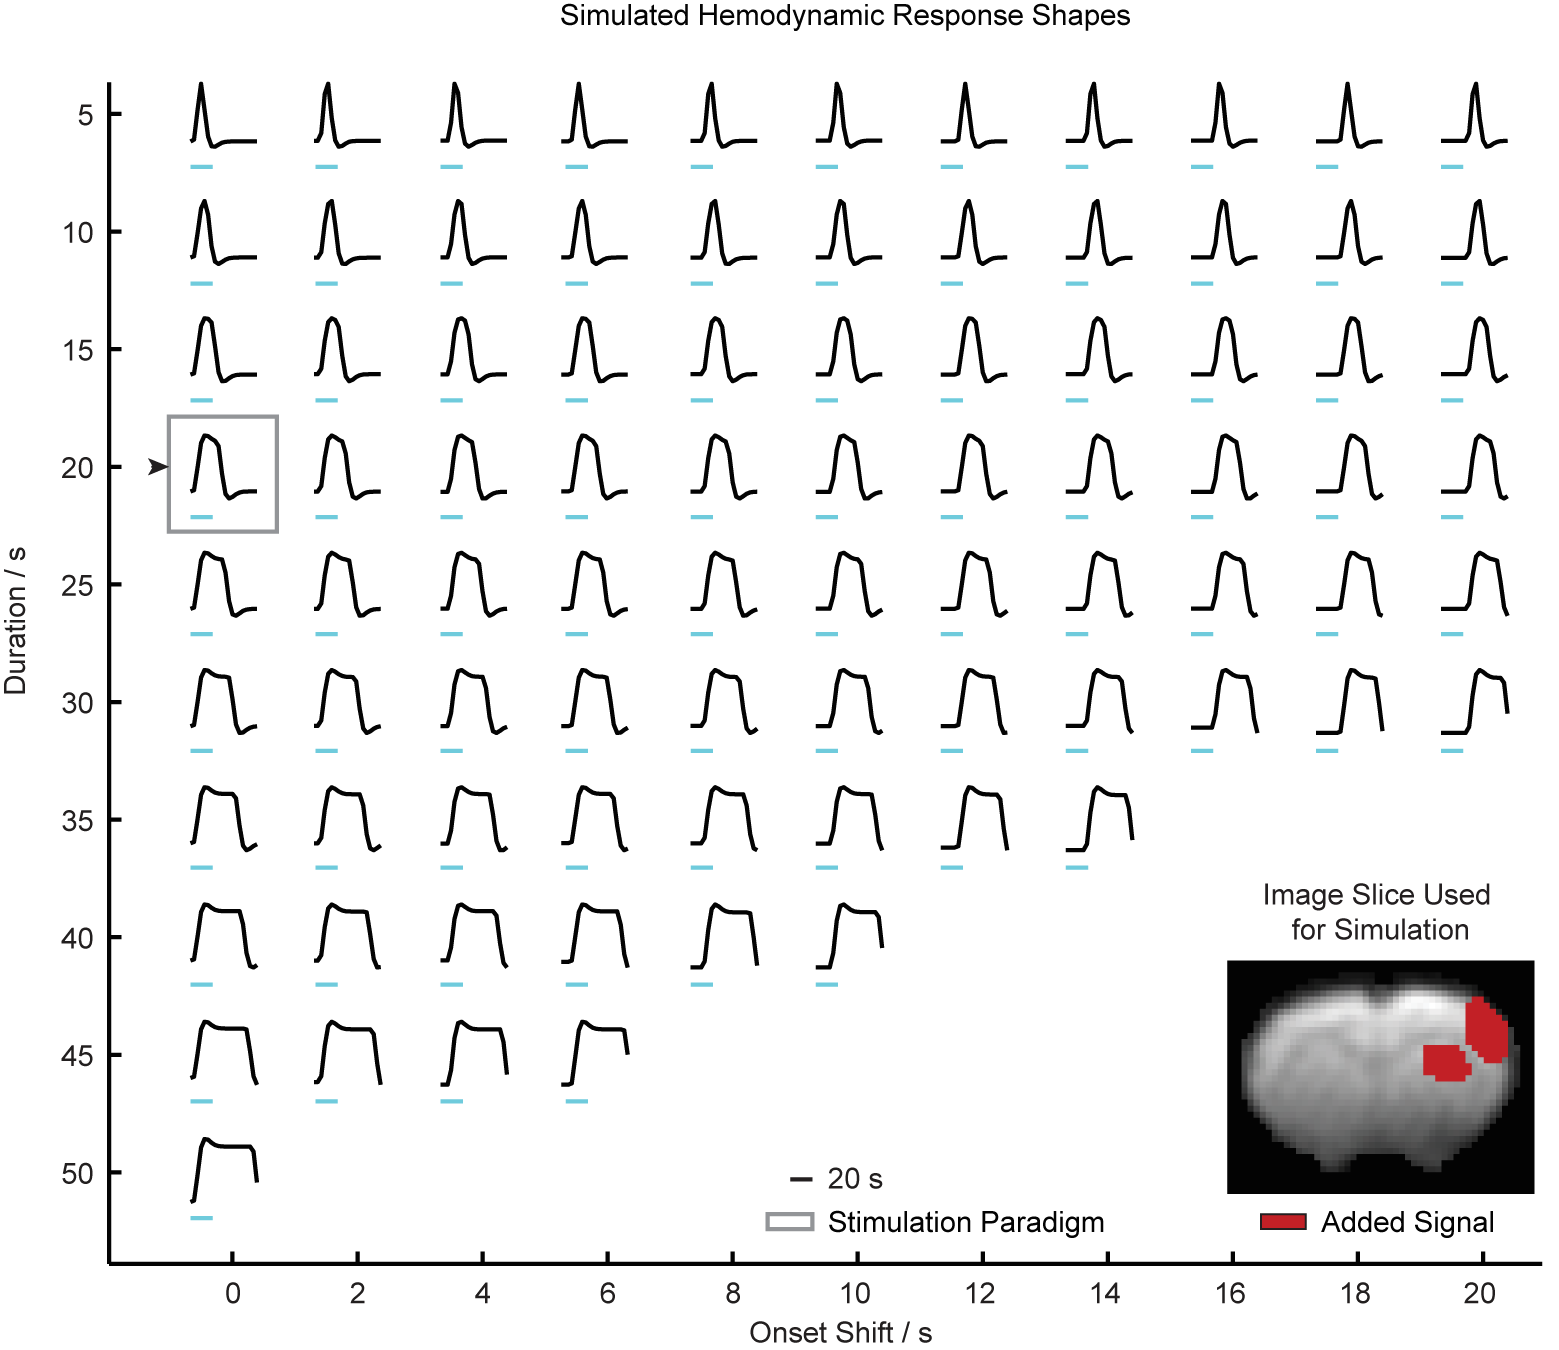
The evaluation was conducted using recently published optogenetic fMRI (ofMRI) data9 as well as simulated data. With the ofMRI data, 10 or 40 Hz optogenetic stimulation was delivered into the rat central thalamus. Gradient recalled echo BOLD (TR/TE = 750 ms/12 ms) with a four-interleave spiral readout was used to acquire 23 coronal slices at a 3 s temporal resolution. With the simulated data, the signal shapes were generated by convolving the canonical HRF in SPM with a boxcar function with a varying onset and duration (Fig. 2). Random, non-physiological system disturbances were modeled by additive Gaussian noise. Custom written software in MATLAB was used for data preprocessing. The linear regression platform in SPM was used to generate statistical parametric maps.
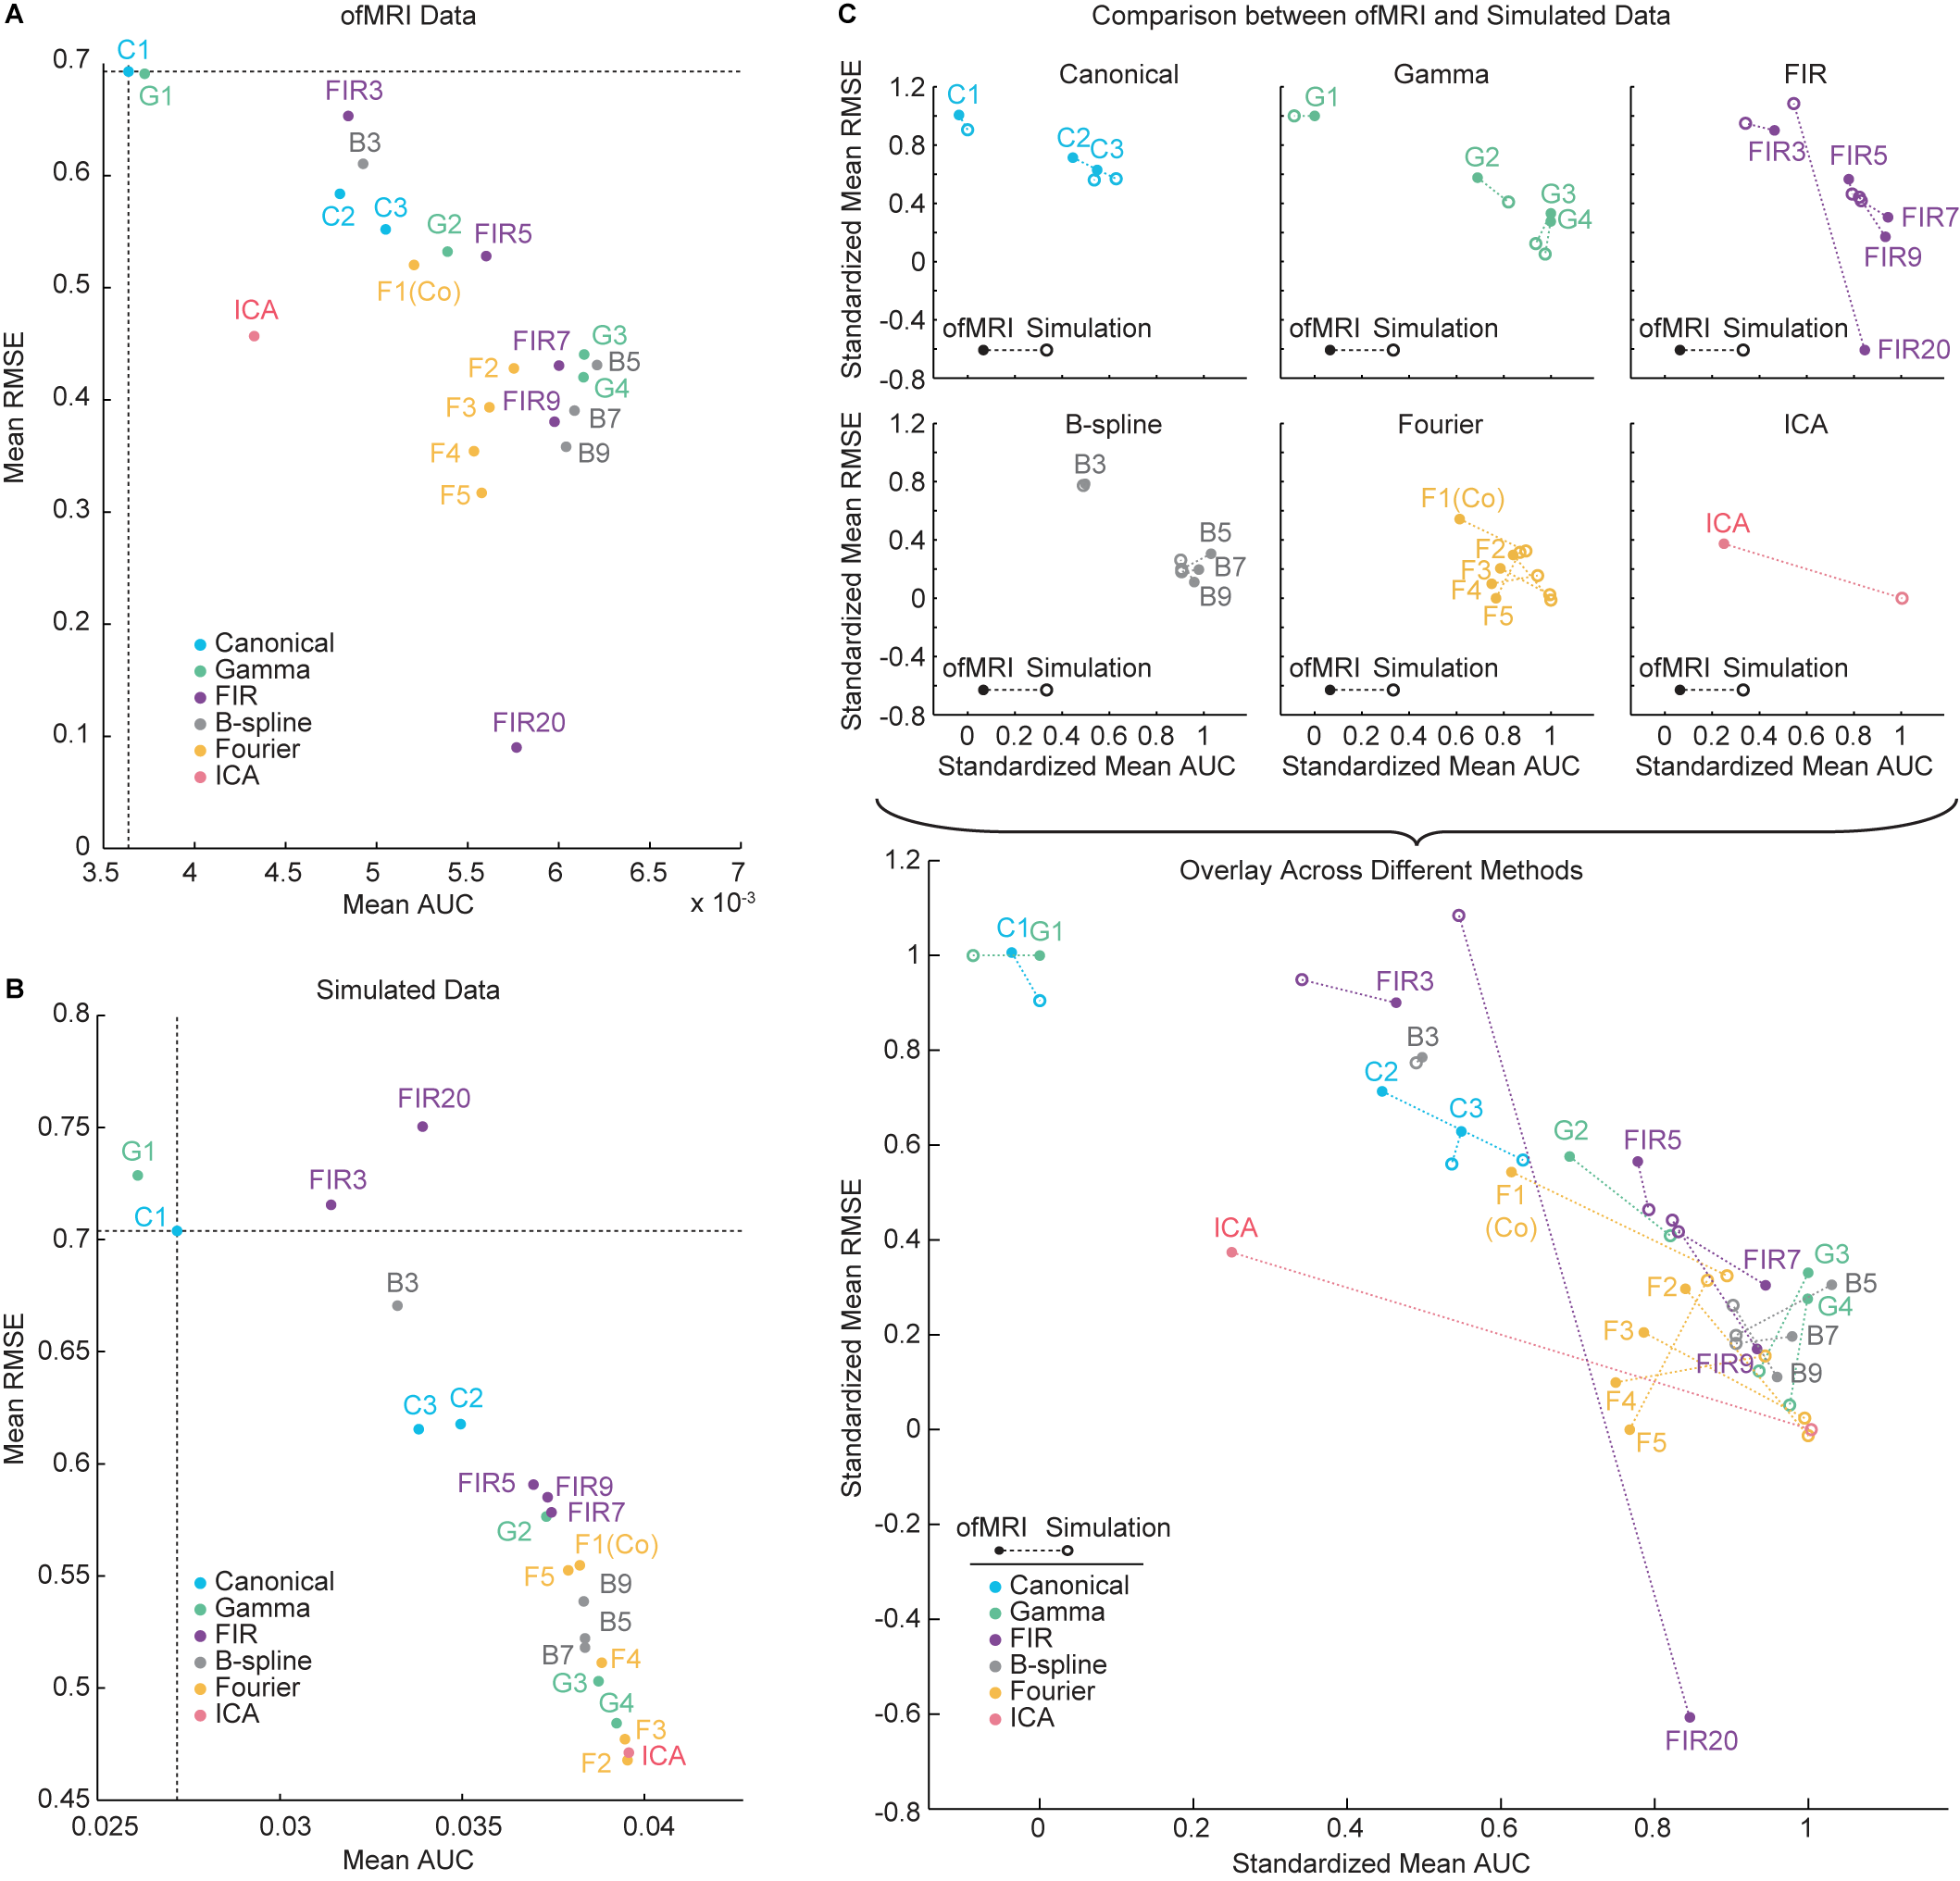
For detection capability assessment, detection volume and modified receiver operating characteristic (ROC) curves10 were used for ofMRI data, while true positive rate, false positive rate, and area under the ROC curve (AUC) were used for simulated data. For characterization capability assessment, onset and duration estimations, and root-mean-square error (RMSE) of fit were used. Onset was defined as the time to half-peak, and duration was defined as full-width at half-peak. RMSE was calculated relative to observed responses for ofMRI data, and relative to the ground truth for simulated data. To enable a direct comparison across ofMRI and simulated datasets, AUC and RMSE values were standardized to the same relative scale according to the following formula:
$$Standardized\cdot AUC_{i}=\frac{AUC_i-AUC_{second\cdot lowest}}{AUC_{second\cdot highest}-AUC_{second\cdot lowest}}$$
$$Standardized\cdot RMSE_{i}=\frac{RMSE_i-RMSE_{second\cdot lowest}}{RMSE_{second\cdot highest}-RMSE_{second\cdot lowest}}$$
Results
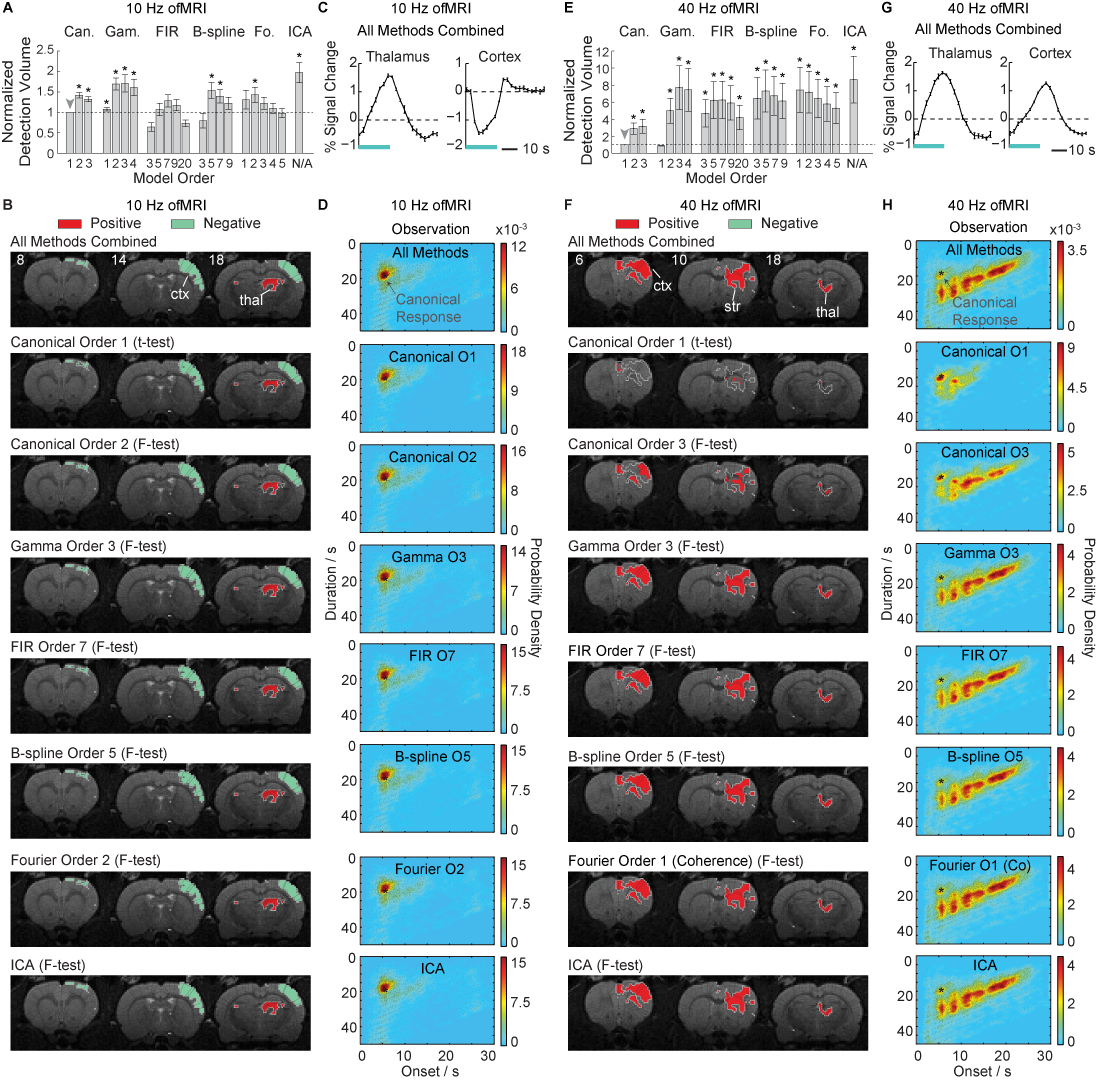
Figure 3 shows the detection performance assessment with ofMRI data. With the 10 Hz stimulation data, each method detects similar activations in the brain. With the 40 Hz stimulation data, the conventionally used 1st order canonical basis set detects a significantly smaller volume than the gamma, FIR, B-spline, Fourier basis sets and ICA.
Figure 4 summarizes each method’s detection and characterization performance with the ofMRI and simulated datasets. We find that, the 1st order canonical basis set underperforms in the presence of heterogeneous BOLD responses. The 3rd and 4th order gamma basis sets, the 7th to 9th order FIR basis sets, the 5th to 9th order B-spline basis sets, and the 2nd to 5th order Fourier basis sets exhibit robust detection and characterization performance against heterogeneous BOLD responses.
Discussion
The large number of existing analysis approaches necessitates a comprehensive assessment to ease the selection of methods in scenarios with heterogeneous BOLD responses, yet none have been performed thoroughly with a block-design paradigm. In the present work, we address this issue by systematically evaluating a series of standard analysis methods. We find that, conventionally used canonical basis set can lead to considerable detection and characterization errors. The 3rd and 4th order gamma basis sets, the 7th to 9th order FIR basis sets, the 5th to 9th order B-spline basis sets, and the 2nd to 5th order Fourier basis sets are the optimal methods as they offer good balance between detection and characterization. The 1st order Fourier basis set (coherence analysis) used in our earlier studies9 shows good detection capability.Conclusion
The present study demonstrates the limitation of the conventionally used canonical basis set, and identifies a set of methods that are robust against heterogeneous BOLD responses. Our results can be used to inform methods selection in both animal and human studies.Acknowledgements
This work was supported through funding from the NIH/NIBIB R00 Award (4R00EB008738), Okawa Foundation Research Grant Award, NIH Director’s New Innovator Award (1DP2OD007265), NSF CAREER Award (1056008), Alfred P. Sloan Foundation Research Fellowship, NIH/NINDS R01NS087159, NIH/NINDS R01NS091461, and NIH/NIA RF1AG047666. J.H.L. would like to thank Karl Deisseroth for providing the DNA plasmids used for the optogenetic experiments. The authors would also like to thank the entire Lee Lab members for their assistance with the ofMRI experiments.References
1 Aguirre, G. K., Zarahn, E. & D'Esposito, M. The variability of human, BOLD hemodynamic responses. NeuroImage 8, 360-369 (1998).
2 Gonzalez-Castillo, J. et al. Whole-brain, time-locked activation with simple tasks revealed using massive averaging and model-free analysis. Proceedings of the National Academy of Sciences 109, 5487-5492 (2012).
3 Handwerker, D. A., Ollinger, J. M. & D'Esposito, M. Variation of BOLD hemodynamic responses across subjects and brain regions and their effects on statistical analyses. NeuroImage 21, 1639-1651 (2004).
4 Amemiya, S., Kunimatsu, A., Saito, N. & Ohtomo, K. Impaired hemodynamic response in the ischemic brain assessed with BOLD fMRI. NeuroImage 61, 579-590 (2012).
5 Calhoun, V., Stevens, M., Pearlson, G. & Kiehl, K. fMRI analysis with the general linear model: removal of latency-induced amplitude bias by incorporation of hemodynamic derivative terms. NeuroImage 22, 252-257 (2004).
6 Lindquist, M. A., Meng Loh, J., Atlas, L. Y. & Wager, T. D. Modeling the hemodynamic response function in fMRI: efficiency, bias and mis-modeling. NeuroImage 45, S187-198 (2009).
7 Friston, K. J., Josephs, O., Rees, G. & Turner, R. Nonlinear event-related responses in fMRI. Magnetic resonance in medicine 39, 41-52 (1998).
8 McKeown, M. J. et al. Analysis of fMRI data by blind separation into independent spatial components. Human Brain Mapping 6, 160-188 (1998).
9 Liu, J. et al. Frequency-selective control of cortical and subcortical networks by central thalamus. eLife 4, e09215, doi:10.7554/eLife.09215 (2015).
10 Nandy, R. R. & Cordes, D. Novel ROC-type method for testing the efficiency of multivariate statistical methods in fMRI. Magnetic resonance in medicine 49, 1152-1162 (2003).
Figures