1637
Resting-state network patterns in extremely preterm born young adults1UCL, London, United Kingdom, 2Institute for Women's Health, University College Hospital
Synopsis
Rates of extreme-prematurity are increasing worldwide. Neuroimaging studies allow us to investigate the underlying tissue substrate of the broader neuropsychological differences observed in preterm cohorts; but the long-term neuroimaging phenotype of extremely-preterm adolescents is relatively unknown. Here we investigate resting-state functional MRI to establish if there is a variability in the pattern of functional networks in extremely-preterm born 19 year-olds relative to a group of their term-born peers.
PURPOSE
Extreme prematurity is a global health concern. Rates of prematurity are increasing worldwide and the long-term impacts of extreme prematurity are only recently beginning to be understood. Although several studies have been carried out analysing structural data, less is known about the long term neurophysical functional differences. These differences can be observed using resting-state functional MRI. Our work comprises a study of extremely preterm born 19 year olds and age-matched peers, social-economically matched at 6 years of age. This work investigates how functional brain networks differ in this group in early adulthood and whether long-term functional differences observed on neuroimaging might relate to the widely observed neuropsychological and visual processing differences seen in extremely preterm born cohorts [1,2].
METHODS
We investigate 142 subjects from a neuroimaging study of term-born and extremely-preterm born adolescents at 19 years of age. Imaging data were acquired on a 3T Philips Achieva. A 3D T1-weighted (TR/TE=$$$6.93s/3.14ms$$$) scan was acquired per subject with $$$1mm$$$ isotropic resolution. BOLD weighted fMRI scans were acquired with TR $$$3000ms$$$, $$$TE 30 ms$$$, flip angle $$$80^o$$$, voxel size $$$2.5×2.5×3mm^3$$$, field of view (FoV) $$$240 mm^2$$$, 50 slices acquired descending. Pulse oximetry records were available for each individual subject of this cohort but not synchronised to the MR data acquisition. We used a custom implementation of a data-driven Independent Component Analysis (ICA) artefact correction algorithm to identify and remove physiological slice artefacts. Preprocessing of BOLD-fMRI scans comprised motion-realignment and subsequent application of a General Linear Model (GLM) including band pass regressors, the 6 motion realignment parameters and ICA physiological noise components. We inspected all individual subject independent components (ICs) for pronounced MR artefacts. We compute a common spatial group template by non-linear registration and subsequently averaging all T1 scans. We compute an affine registration between BOLD-fMRI and T1 image space for each subject, and combine affine registration and non-linear to obtain the mapping into a subsampled fMRI group template obtained from the T1 group space. We exclude 35 subjects with severe MR artefacts prior to ICA. All preprocessed and spatially normalized BOLD-fMRI scans are temporally normalized to ensure zero mean and unit standard deviation. BOLD-fMRI scans are concatenated in time to estimate 40 ICs [3,4]. Subsequently, we use dual regression to obtain 40 individual time courses and corresponding spatial maps for each subject. Individual spatial maps are smoothed with a $$$6mm$$$ kernel to account for anatomical differences in the group comparison. We compare brain networks among the 40 spatial IC maps between 72 term-born and 67 preterm-born subjects. We also compare the correlation of the brain networks time courses within each subject between the different groups. We correct spatial difference maps for each IC for multiple comparison with the Benjamini-Hochberg procedure at $$$p<=0.05$$$.
RESULTS
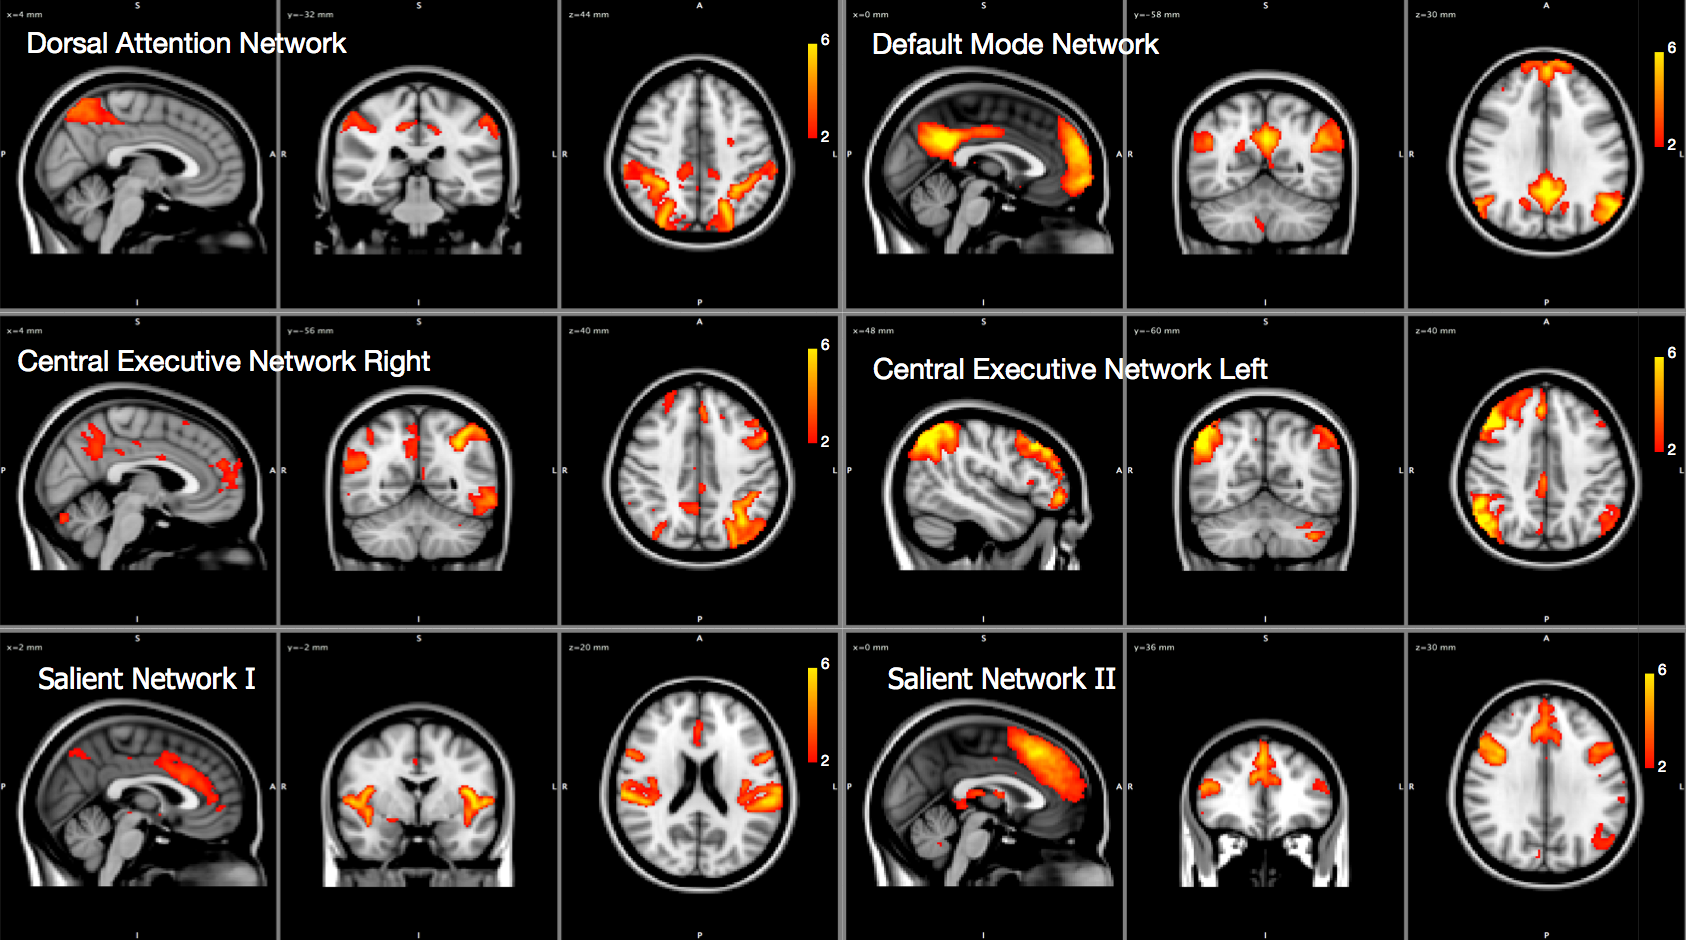
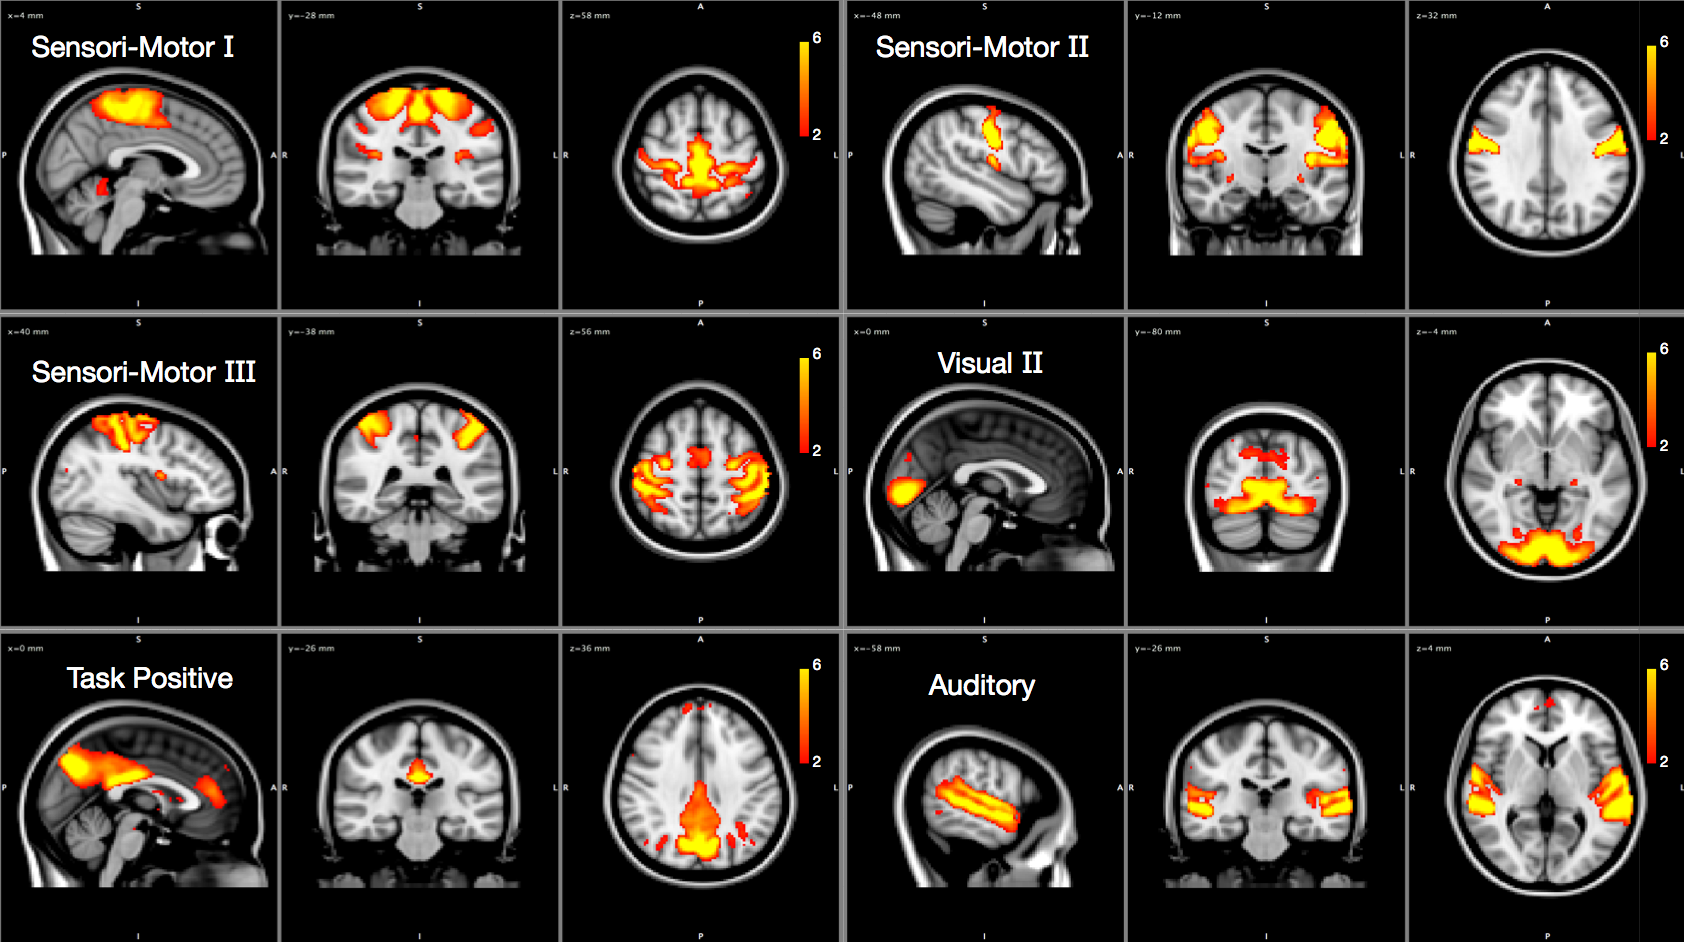
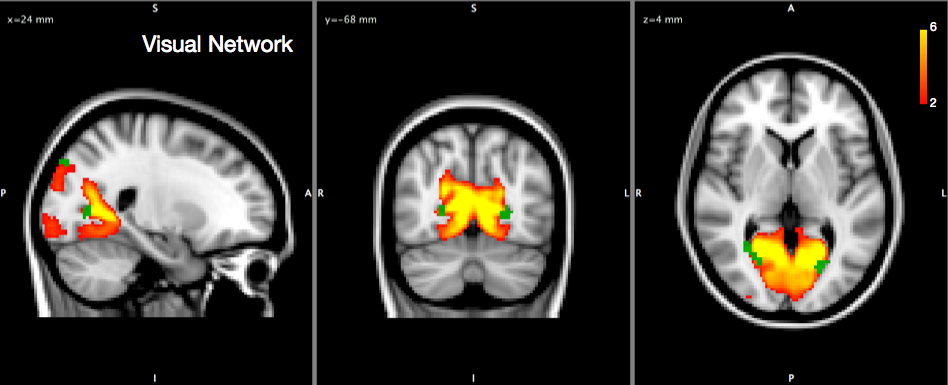
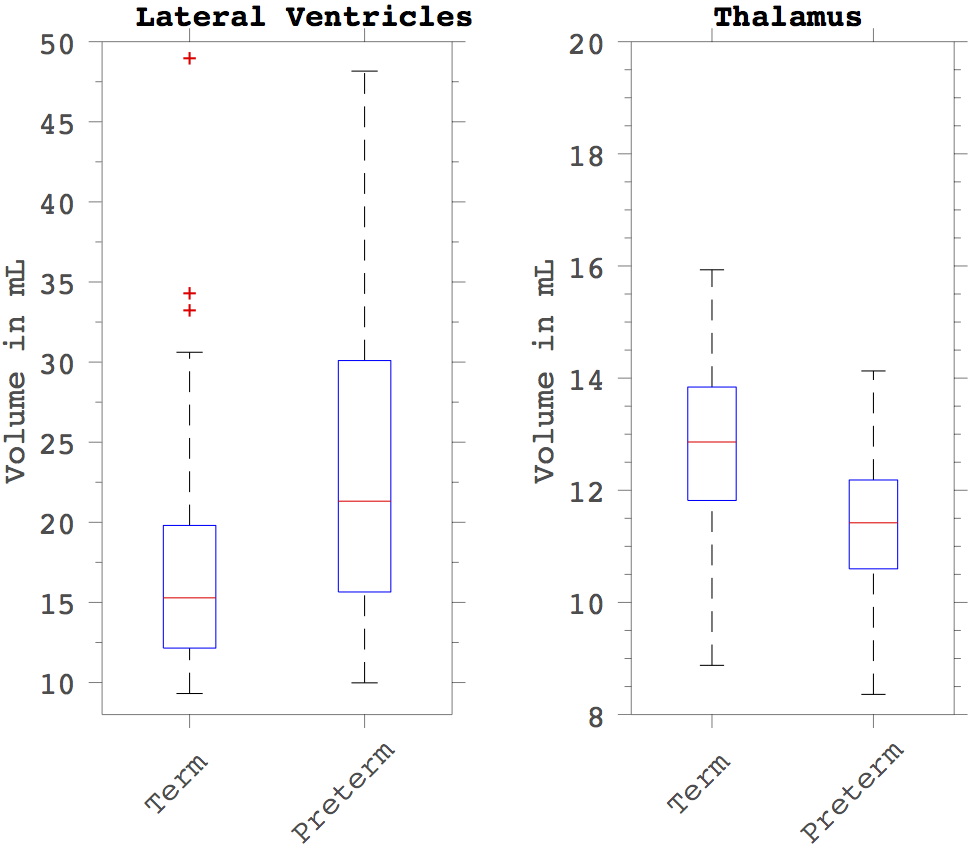
We found and investigated several brain networks in the group including the default-mode network, dorsal attention network, central executive network and visual network inherent in one or more ICs depicted in Figures 1 and 2. There was no difference in individual ICs with the exception of the visual cortex (Figure 3). We found a significant positive difference that presented symmetrically close to the lateral ventricles as well as a medial dorsal difference in the right brain hemisphere in the examined visual network. Nearby structural volumes are shown in Figure 4, the volume of the lateral ventricles in the extreme-preterm group is found to be larger, whilst the volume of the preterm thalamus is less than that in the term group [5]. The visual processing system has significant connections between the posterior region of the thalamus and visual cortex, so this volumetric result is consistent with the functional network result. We could not find any significant differences between brain network correlations, especially no changed network interactions between visual networks and other brain networks.DISCUSSION
Our results have established common resting state networks in the extremely-preterm 19 year old brain and compared these to those present in a cohort of term-born peers. Of note we do not observe any striking differences in the types of pattern obtained. The only network demonstrating strong difference between extreme-preterm and term groups is the visual network. It is well known that preterm cohorts are more susceptible to visual impairment, and our results may represent a neuroimaging manifestation of this impairment, which is believed to be more than a retinal pathology and extend to the visual processing regions of the cortex. Our future work will bridge the gap between network-based neuroimaging and objective functional impairment in this cohort by obtaining measurements in tasks assessing visual processing.
Acknowledgements
We would like to acknowledge the MRC (MR/J01107X/1), the National Institute for Health Research (NIHR), the EPSRC (EP/H046410/1) and the National Institute for Health Research University College London Hospitals Biomedical Research Centre (NIHR BRC UCLH/UCL High Impact Initiative BW.mn.BRC10269). This work is supported by the EPSRC-funded UCL Centre for Doctoral Training in Medical Imaging (EP/L016478/1).References
[1] Marlow N. et al. Neurologic and Developmental Disability at Six Years of Age after Extremely Preterm Birth. N Engl J Med 2005; 352:9-19.
[2] Blencowe et al. Preterm-associated visual impairment and estimates of retinopathy of prematurity at regional and global levels for 2010. Pediatr Res. 2013 Dec; 74(Suppl 1): 35–49.
[3] Cardoso et al.Geodesic Information Flows: Spatially-Variant Graphs and Their Application to Segmentation and Fusion. IEEE Trans Med Imaging. 2015 Sep;34(9):1976-88.
[4] Beckmann, C.F. and Smith, S.M., 2004. Probabilistic independent component analysis for functional magnetic resonance imaging. IEEE transactions on medical imaging, 23(2), pp.137-152.
[5] Beckmann, C.F., Mackay, C.E., Filippini, N. and Smith, S.M., 2009. Group comparison of resting-state FMRI data using multi-subject ICA and dual regression. Neuroimage, 47(Suppl 1), p.S148.
Figures