1635
Mu opioid receptor activation signatures on brain activity and connectivity by fMRI in mice1Department of Psychiatry, Douglas Mental Health University Institute, Montreal, QC, Canada, 2Center for Translational Neuro-Imaging, Northeastern University, Boston, MA, United States
Synopsis
Mu opioid receptors (MORs) mediate the strong analgesic and rewarding effects of morphine. We used non-invasive imaging fMRI in wild-type and MOR knockout mice to assess MOR-dependent effects at the scale of the whole brain. Here, we present striatum seed-based signatures identified by BOLD activation map, functional connectivity and directionality. We identified MOR-specific activation of the striatum between 2 and 7 minutes after morphine administration. Furthermore, during this time interval, the brain connectivity was altered by morphine in wild type but not mutant mice. This is the first reported on-target morphine activation signature in the striatum of live animals.
Target audience
Drug
addiction, analagesia,opioids, translational and clinical studies.
Purpose
In the area of psychiatric disorders, success in developing effective drugs from highly promising molecular targets has been limited. Although drug-induced molecular processes are well understood at the cellular level and behavioural effects have been characterized in animal models the overall impact of target activation and inhibition on neural network structure, neurochemistry and connectivity at the whole brain level remains largely unknown. Our goal is to develop a new platform to identify and screen novel drug signature in the area of psychiatric disorders using functional magnetic resonance neuroimaging (MRI). In humans, magnetic resonance neuroimaging has opened the era of connectome/imaging genetics, in order to elucidate how genetic factors affect brain organisation and connectivity in healthy individuals and disease. Here we present a proof-of-principle study based on mu opioid receptor (MOR) responding to opiate drug in the living mice. MOR is expressed in the brain areas belonging to pain and addiction circuits. Moreover, MORs contributes to reward effects of other drugs of abuse [1] and social reward [2-3]. Here, we tested whether functional MRI in live animals would reveal connectivity changes and BOLD activation map in MOR enriched regions after morphine injection.Methods
MRI was performed on 6 male C57BL/6J (Wild Type (WT)) and 6 MOR knockout (KO) under continuous dexmedetomidine (Dex, an α-2 adrenergic agonist) anesthesia sedation through a MRI compatible catheter (initial intraperitoneal injection of 0.3 mg Dex per kilogram body weight in 100 μL 0.9% NaCl-solution followed by subcutaneous infusion of 0.6 mg per kilogram body weight in 200 μL/h) [4]. Image acquisition: functional MRI images were acquired at 7 tesla MRI scanner with EPI sequence (TE=17ms; TR=1.6s) matrix 128×80, 12 axial slices, field of view 1.92×1.2 cm2 and 1800 volumes for total acquisition time of 50 minutes [4]. Morphine (10mg/kg) was injected inside the scanner after initial five minutes of resting state scan. BOLD activation map: We performed BOLD activation map following [5]. Image preprocessing: Image time series were denoised, motion corrected, spatially normalized, slice timing corrected, smoothed (FWHM of 0.3×0.3×1 mm3) and bandpass filtered (0.01-0.1Hz) [4]. Selected seeds were generated manually by following the standard atlas and extracted mean time series were used for the analysis. Directionality analysis: We applied conditional Granger causality(C-GC) [6-7] method using MVGC toolbox[6] with permutation test for dominant direction of information flow [7].Results
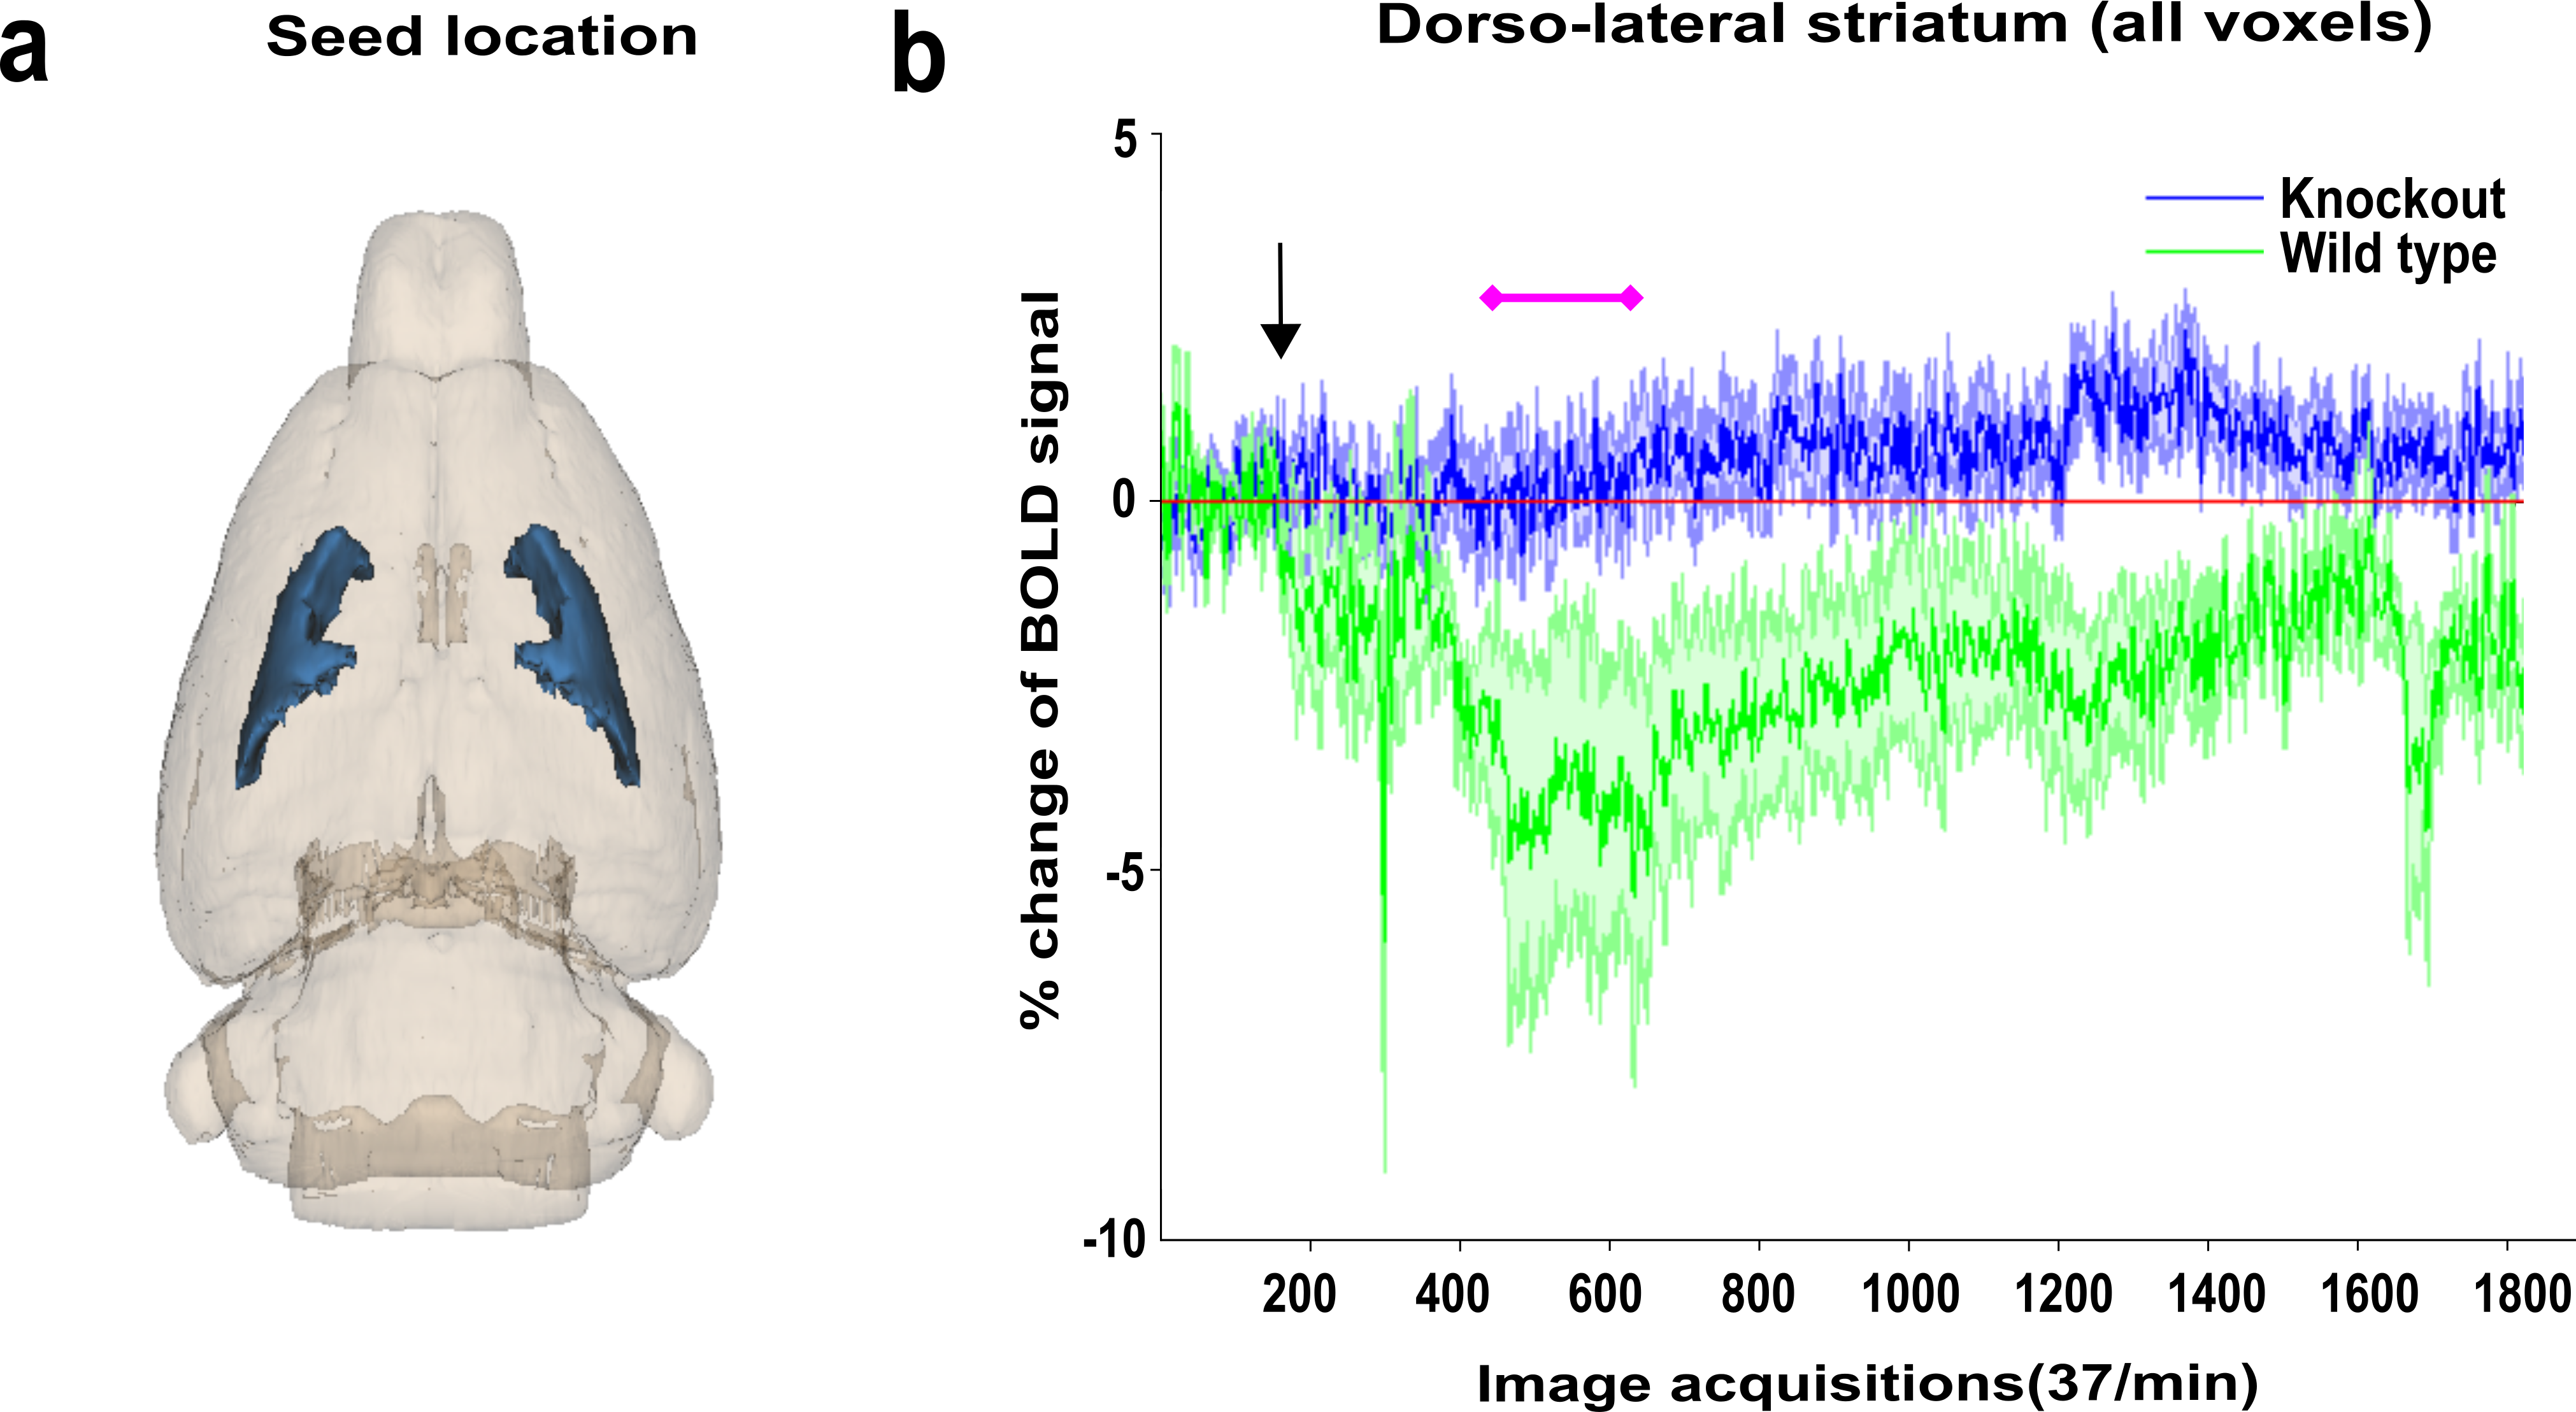
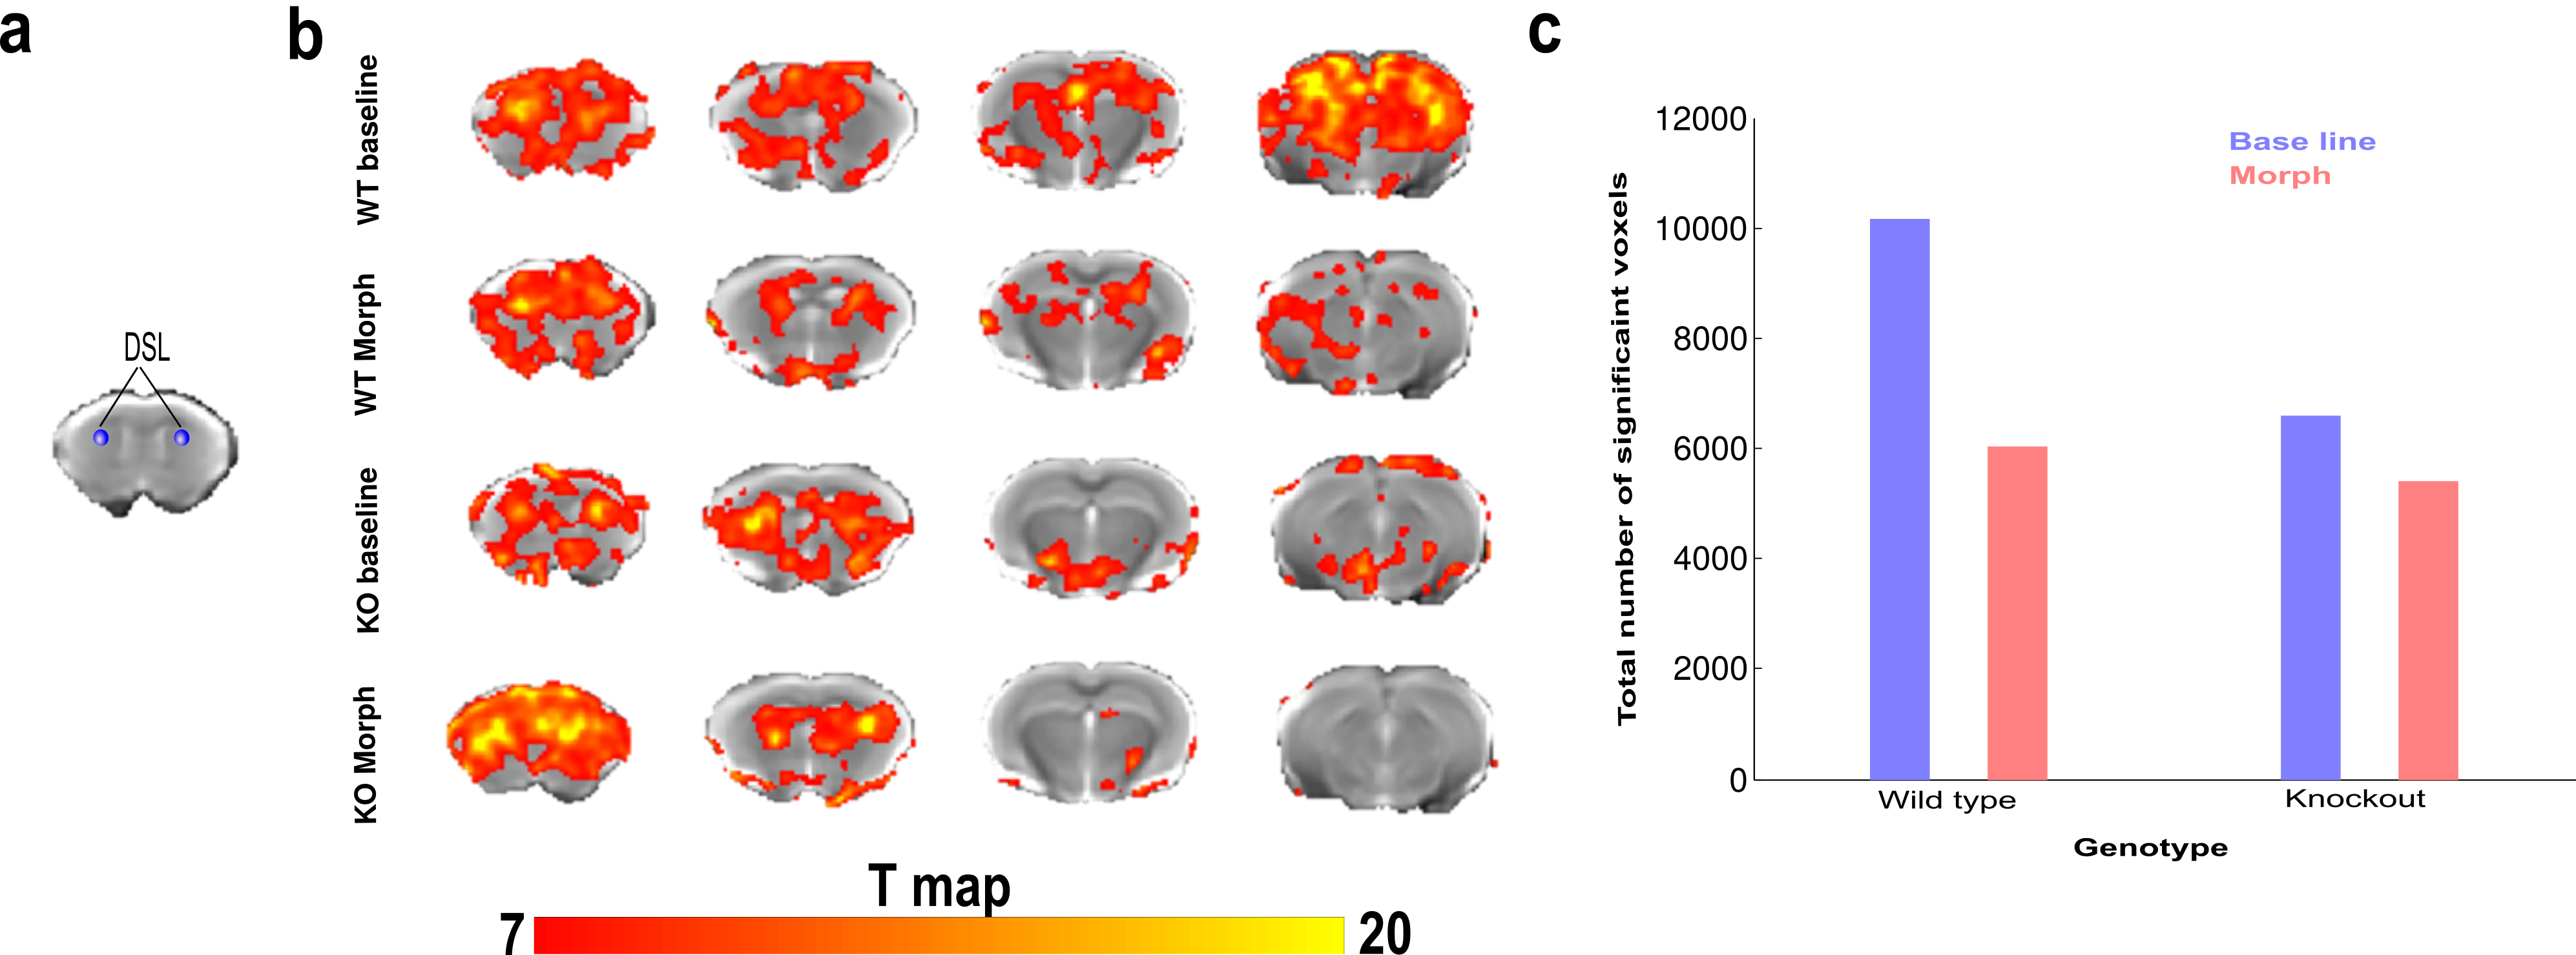
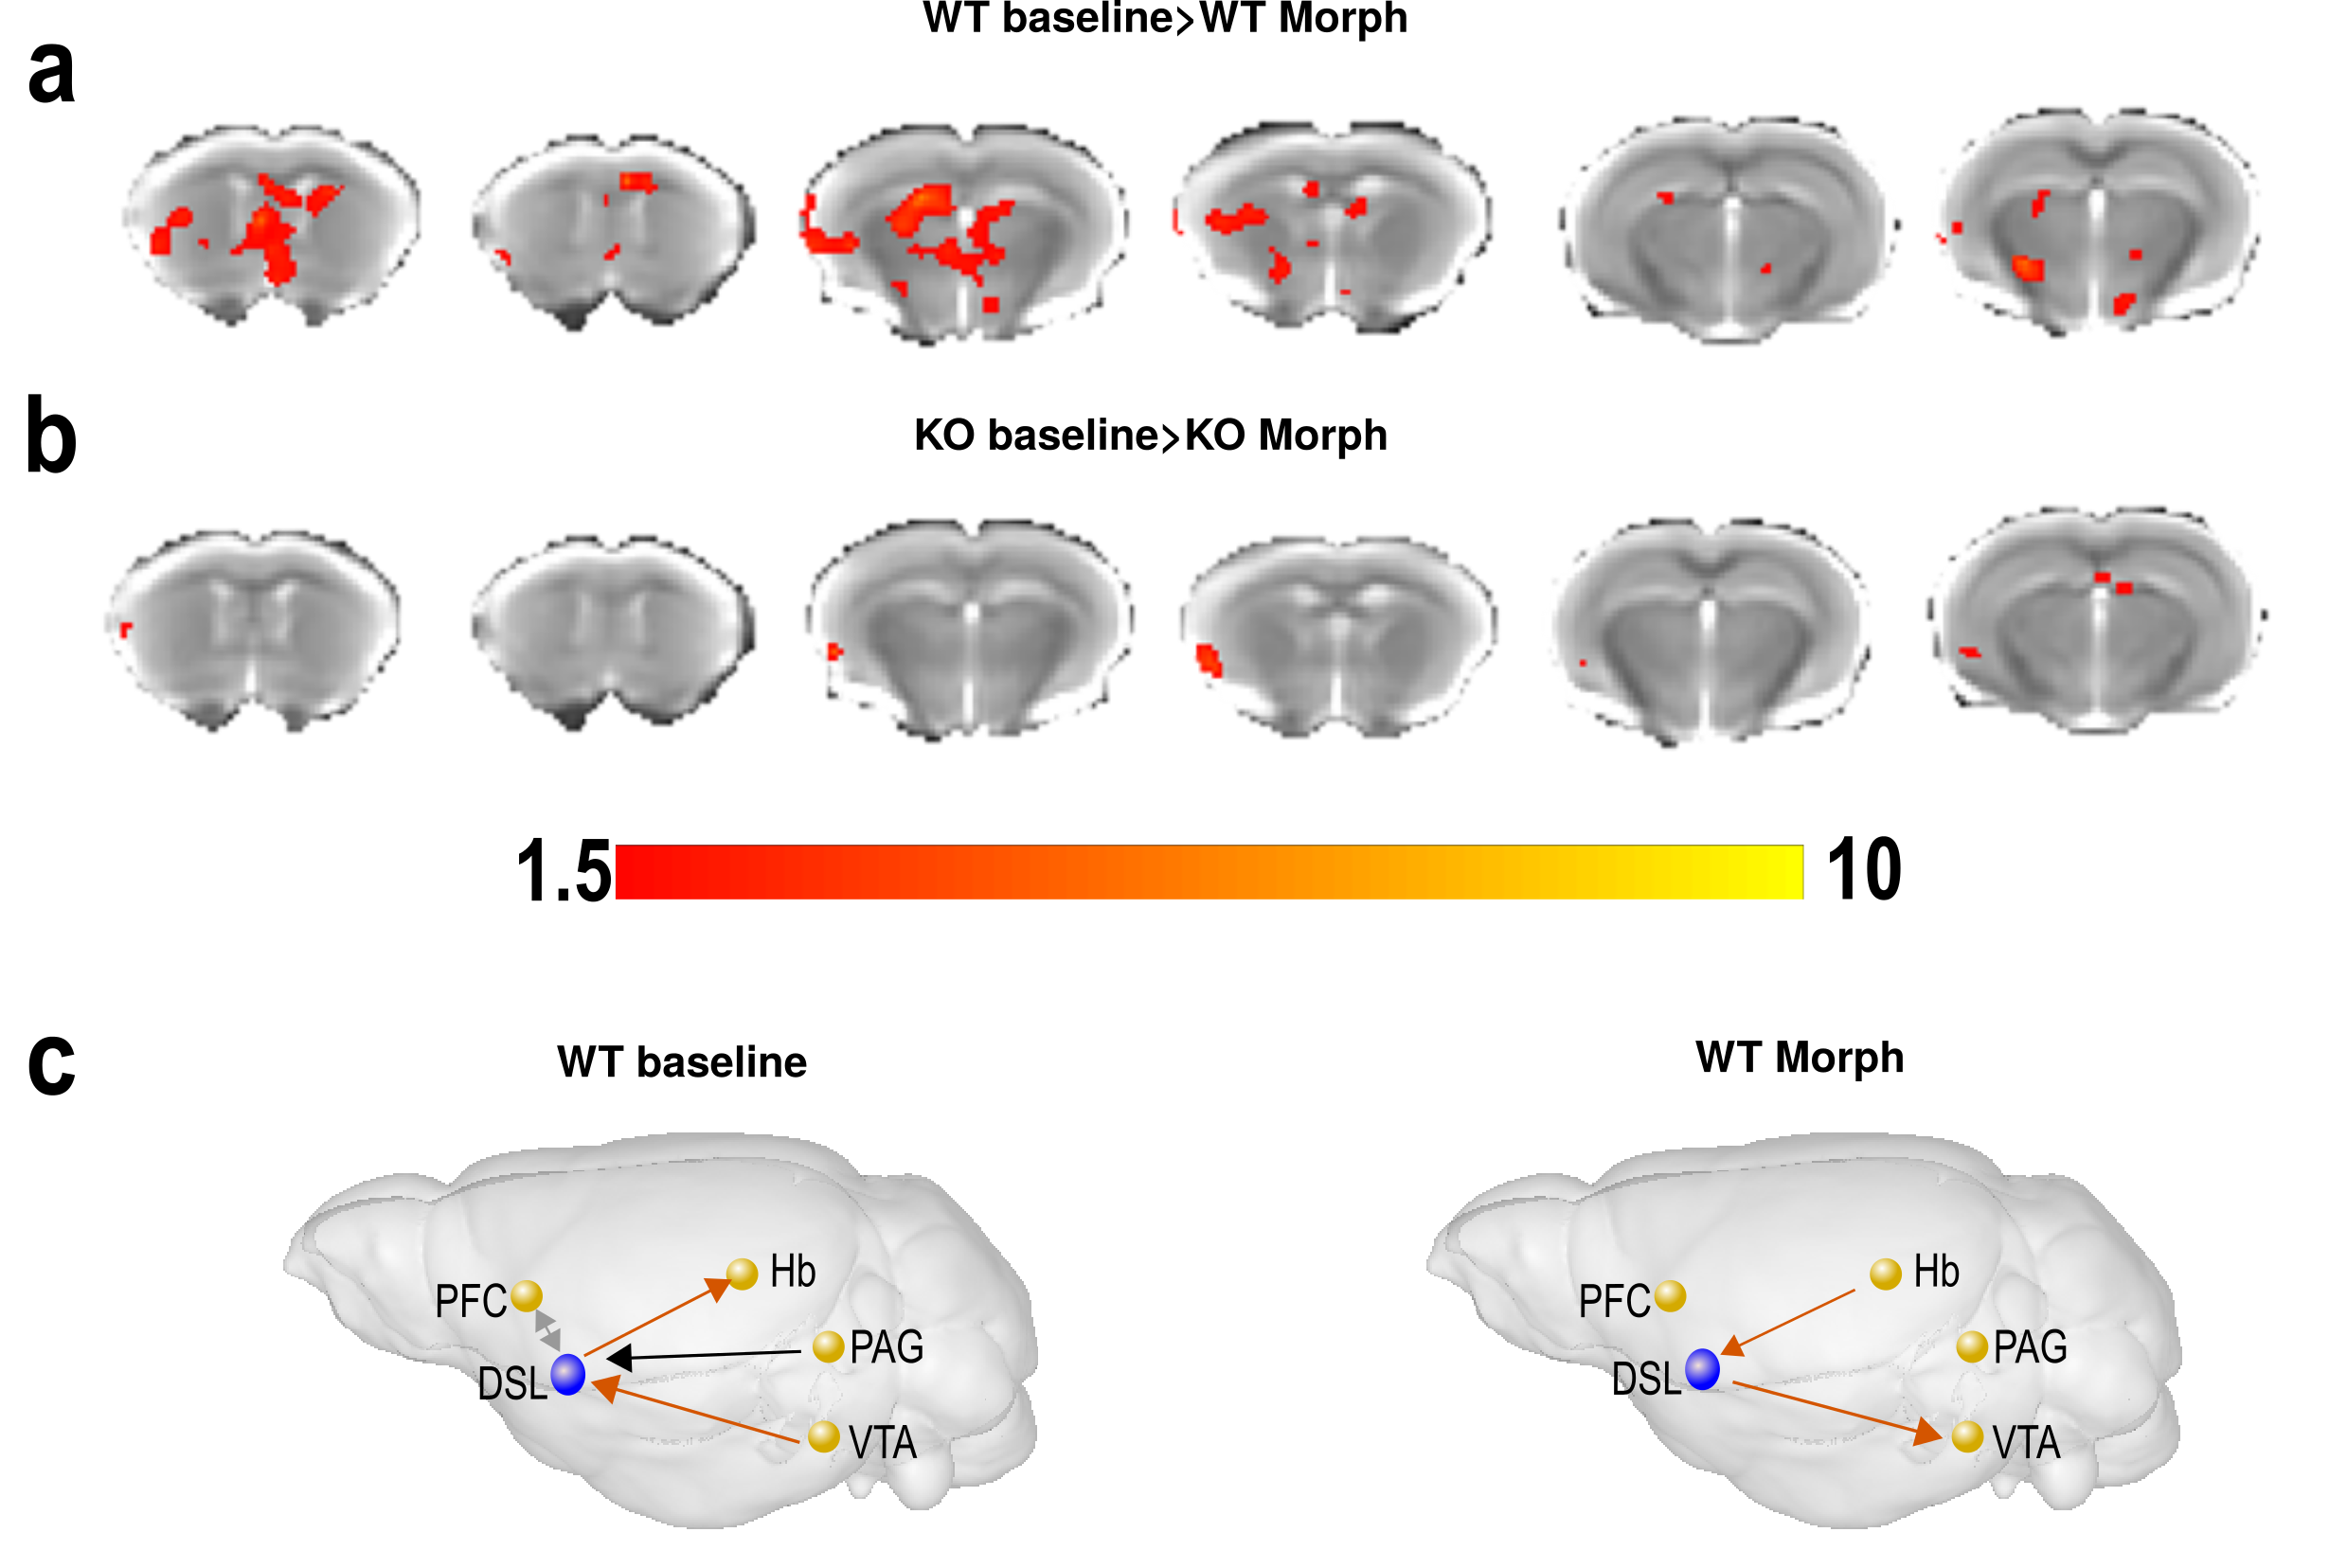
Analysis of the BOLD activation signal shows maximum morphine effect only in the WT group after 2 minutes of morphine injection. Result from a selected representative seed of dorso-lateral striatum (DSL) BOLD activation map for both WT and KO groups is reported in Fig. 1(b) showing decrease of BOLD signal continuing for almost 45 min acquisition time in WT mice. For functional connectivity, initial 5 minutes were considered as baseline and the 7 to 12 minutes (2-5 mins after morphine injection) time frame were considered for morphine effect following activation map. DSL seed-based voxelwise functional connectivity mapping highlighted significant decrease of connectivity after morphine injection in WT but not KO mice (Fig 2 (b,c)). Comparative group difference of functional connectivity data sets show significant change in four key regions associated to striatal function and/or expressing high levels of MOR such as prefrontal cortex (PFC), ventral tegmented area (VTA), habenula (Hab) and Periaqueductal grey (PAG) (results not shown) in WT mice (Fig 3 (a),(b)). For dominant/bi/no directionality analysis, a small network was considered in WT group considering the five previously mentioned regions. Remarkably, C-GC analysis produced largely consistent directional information flow before morphine injection for DSL-VTA and DSL-Hab connectivity but directionality disappeared (PFC-DSL-PAG) or was altered (DSL-VTA) after morphine injection.Discussion
Our analysis demonstrates robust morphine-induced BOLD activation and functional connectivity alterations in resting-state networks of the mouse brain, including converging dominant connectivity between dorsal striatal and other four regions. These morphine effects are not found in MOR KO mice, revealing on-target drug effects on brain functional networks. Collectively, our work therefore suggests that brain activity in the resting brain is characterized by intrinsic functional and BOLD activation signatures of morphine that are mediated by MORs and hierarchically guide functional changes in MOR-enriched areas, providing a novel interpretative framework to study intrinsic functional architecture of the mouse brain at the macroscale.Conclusion
Effects produced by the prototypic opiate drug provides a reference data-set and a drug signature to further test other mu opiates used in the clinic and under development. This novel analysis platform will pave the way to system-level analysis of drug activities for basic brain research and clinical developments.Acknowledgements
US National Institutes of Health (National Institute of Drug Addiction, grant #05010 and National Institute on Alcohol Abuse and Alcoholism, grant #16658), the Canada Fund for Innovation and the Canada Research Chairs for financial support.References
[1] Contet et al, Curr. Opin. Neurobiol 14, 370-378, 2004
[2] Moles et al, Science. 25, 304(5679):1983-6, 2004
[3] Becker et al, Neuropsychopharmacology 39(9), 2049-2060, 2014
[4] Mechling et al, PNAS Early Edition, 1-6, 2016
[5] Ferris et al, Front. Neurol. 5(94),1-14, 2014
[6] Barnett et al, J Neurosci Meth. 223, 50-68, 2014
[7] Roebroeck et al, Neuroimage 25:230-242, 2005
Figures