1629
Cortical Depth-Dependent Physiological Noise Cleaning in High-Resolution VASO ImagingAndrew Hall1, Laurentius Huber2, Daniel A Handwerker3, Javier Gonzales-Castillo3, Natasha Topolski3, and Peter A Bandettini3
1Section on Functional Imaging Methods, NIH/NIMH, Bethesda, MD, United States, 2section on functional imaging methods, NIH/NIMH, 3NIH/NIMH
Synopsis
As functional analyses move toward finer detail and higher resolution, sources of noise that were nuisances are now becoming more significant. While noise removal is well studied in lower-resolution, gradient echo BOLD-weighted imaging, it is not as well understood in high resolution VASO. We examine the efficacy of physiological noise cleaning methods that are commonly used in many fMRI studies.
Purpose
High-field, high-resolution fMRI is opening the door to non-invasive cortical depth-dependent connectivity analyses. However, the depth-dependent variations in baseline physiology [1] (e.g. blood volume, oxygenation) and their corresponding susceptibility to physiological noise [2] can hamper the interpretation of depth-dependent results, especially in resting-state data. The purpose of this study is to examine, quantify, and compare several common methods for physiological noise cleaning, including regression of cardiac and respiratory traces, blood vessel ROI time series, and specific ICA components. We discuss results of these noise cleaning methods with respect to the specific signature of physiological noise at high resolution. Doing so, we are focusing on the case of cortical depth-dependent blood volume signal in human motor cortex.Methods
Two healthy volunteers were scanned on a 7T Siemens scanner with a 32-channel NOVA Medical head coil at a resolution of 0.75x0.75 mm2 with 1.8 mm slice thickness, aligned perpendicular to the cortical surface [3]. Simultaneous physiological monitoring via pulse oximeter and pneumatic respiratory belt was employed. Physiological signals were sampled with a Biopac® system, synchronized with fMRI data acquisition. Respiratory and cardiac signals were sampled at each TR (3 seconds) and later used as regressors. Volunteers performed a 30 second on-off finger tapping task, for a 720 seconds. Motion corrected image time series were corrected for physiological noise by regressing out: (A) cardiac signal, (B) respiratory signal, (C) both cardiac and respiratory, similar to RETROICOR [4], (D) a time series, taken from a mask of large blood vessels within the field of view, (E) manually selected ICA-components, derived from FSL MELODIC ICA. These regressions were performed using the fsl_regfilt program (FSL 5.0). The efficacy of these methods was assessed by generating cross-cortex, depth-dependent profiles of statistical significance, quantified by a z-statistic generated by the FSL FEAT analysis tool. Each profile was compared to the original significance of activation, without any physiological remediation.Results
Fig. 1A depicts maps of desired tapping induced activity without any removal of physiological noise. In specific ICA components (Fig. 1B) and in maps of cardiac-induced signal changes (Fig. D-E) clear, locally confined structures can be identified (e.g., red arrows). Fig. 2 demonstrates the effect of regressing out the physiological noise as a function of cortical depth. In Fig. 2A, the variance explained from physiological noise is highly dependent on the position within the cortical depth. While respiration induced noise (orange in Fig. 2A) is dominant in CSF areas only, cardiac induced noise (blue in Fig. 2A) additionally affects middle cortical layers. Please note the scaling of the y-axis; cardiac and respiratory noise can only explain less than 1% of the variance.Discussion
The fact that the physiological regressors explain a limited portion of the overall variance is consistent with previous high-resolution studies investigating physiological fluctuations [2]. These observations are consistent with the interpretation that physiological noise is not the limiting factor at high resolution. It is possible that images are mainly dominated by thermal noise because of the smaller voxel size. This thermal sensitivity may be more significant in resting state analyses, as compared to task-oriented experiments. This non-physiological dominance may also be coming from the fact that the local structures of high physiological noise (shown in Fig. 1) are far from the ROI of the hand knob. Subjective, image based physiological noise cleaning can be difficult to implement effectively, as one may inadvertently remove task-related activity, along with noise. Hence, special care must be taken to ensure that the regressors used here are orthogonal to the tapping induced activity. Other factors that may be influencing these results include our lack of spatial smoothing, as when this is done, the randomly distributed thermal noise averages out, and physiological noise is left dominant.Conclusion
Our results suggest that in the thermal noise dominated regime of sub-millimeter voxels, depth-dependent physiological noise has a limited effect on fMRI signals. It is entirely possible that thermal variations may be the dominant source of noise, and under this assumption, it is essential to mediate it for effective high-resolution imaging.Acknowledgements
This research is supported by the NIH Intramural Research program, specifically the Section on Functional Imaging Methods.References
[1] Goense et al., Front Comp NeuroScience, 2016, 10:article 66
[2] Polimeni et al., ISMRM, 2015, #592
[3] Huber et al., NeuroImage, 2015, 107:23-33;
[4] Glover et al., MRM, 2000, 44:162-167
Figures
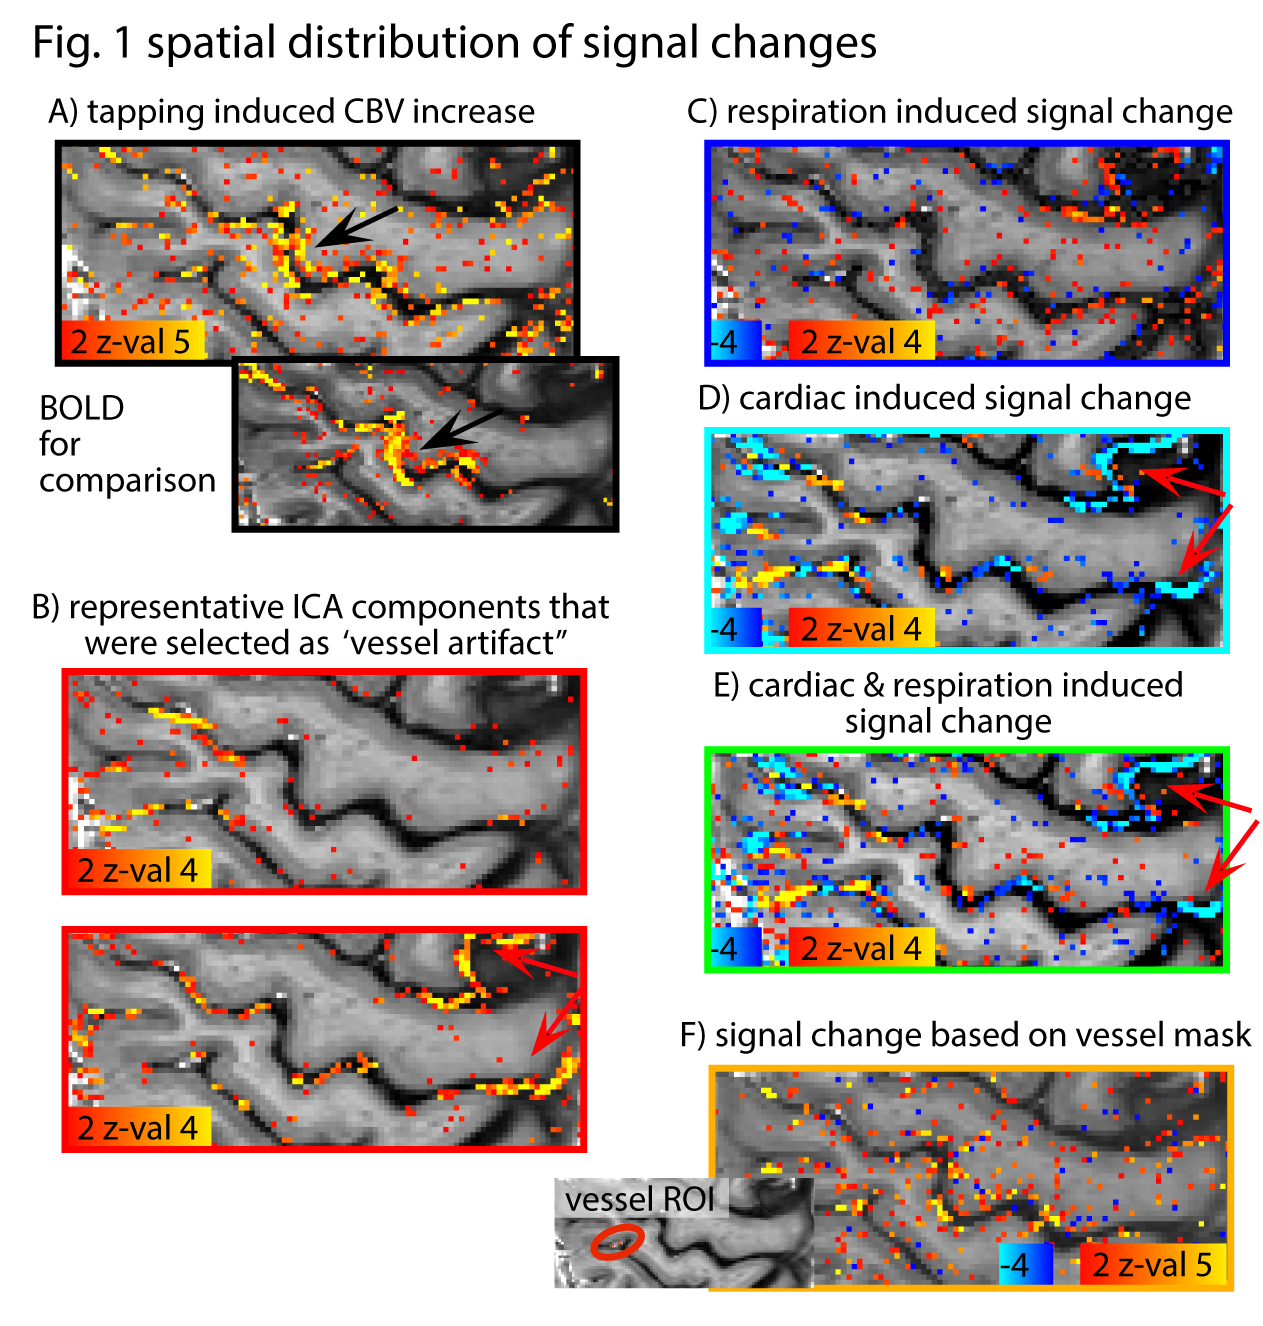
Fig. 1: Spatial distribution of different sources of
variance. (A) depicts the changes of blood volume weighted signal during finger
taping, predominately coming from the hand knob region (black arrow). (B)
depicts ICA components that are manually classified as ‘driven by physiological
noise.’ (C-E) depict maps of voxels that match the respiration and cardiac
traces, respectively. F) depicts regressors using the signal of manually
selected vessels. The variance distribution in selected ICA components and
regressors from pulse-oximter signal show clear vessel like structures (red
arrows), while regressors from respiration belt and from selected vessels have
a less specific effect.
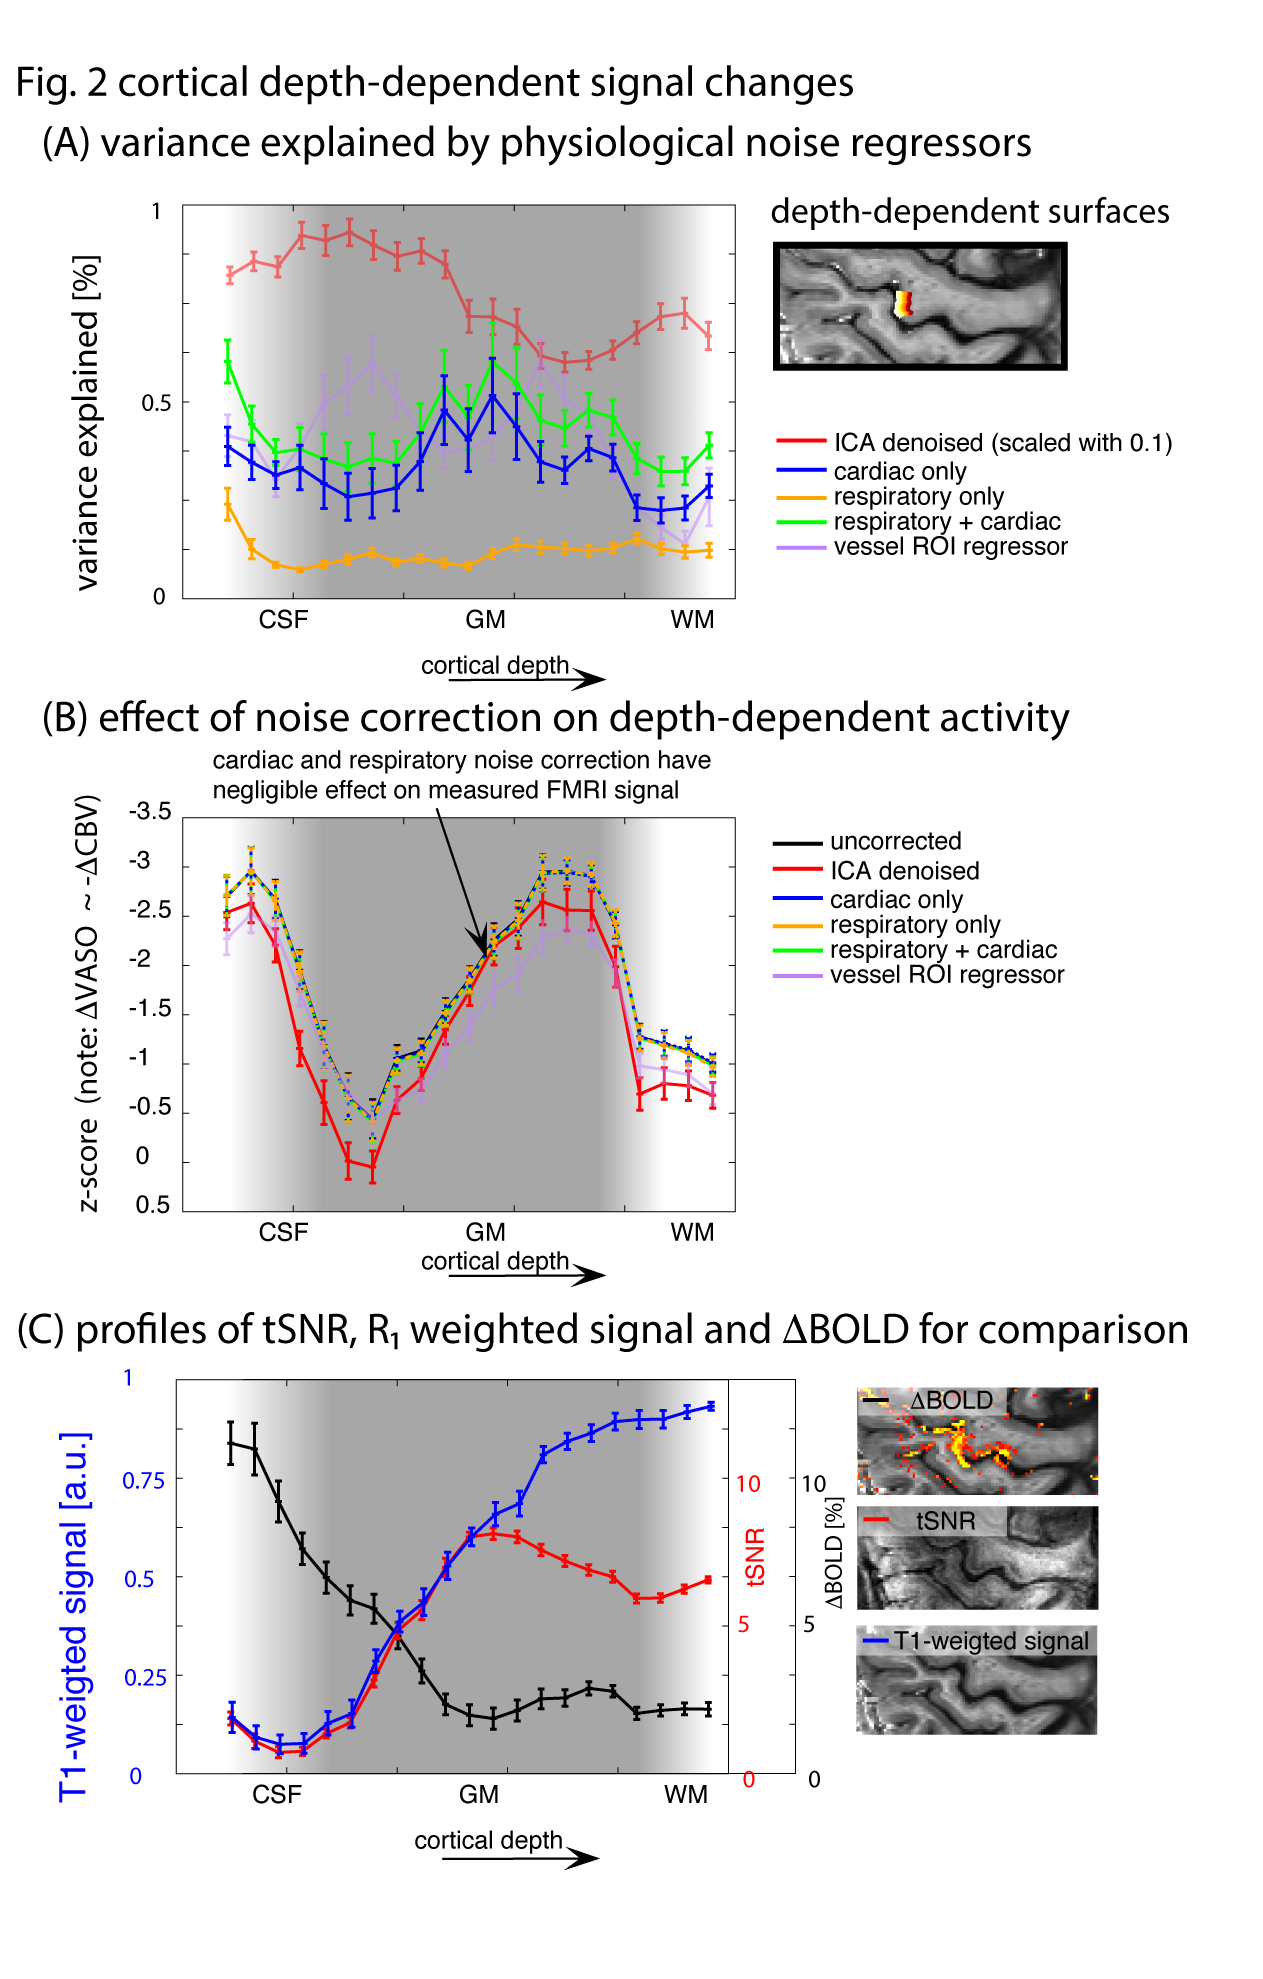
Fig 2: Cortical
depth-dependence of fMRI signal variance: (A) Depicts variance explained across
cortical layers of M1 by various physiological noise cleaning methods, where
explained variance is defined as VE=(Var(Uncorrected)-Var(Corrected))/(Var(Uncorrected)) * 100 (B) Depicts the effect of noise cleaning on
statistical CBV activity (note that the VASO signal varies inversely with CBV
changes) (C) Depicts, for the sake of comparison, BOLD signal change,
R1-weighted signal intensity, and tSNR across cortical depth in the same ROI.