1628
Less may be better: comparison of Multi-Echo-ICA de-noising for three and four echo EPI acquisitions in studies of seed-based functional connectivity1Centre for Neuroimaging Sciences, IoPPN, King's College London, London, United Kingdom
Synopsis
This work is a formal comparison between different echo acquisitions (3 and 4 echo) for the use with multi-echo independent component analysis de-noising of resting-state functional MRI data. We look to evaluate and determine the optimal acquisition required for de-noising of resting state data which is often plagued with artifacts and noise.
Introduction
The use of multi echo EPI acquisition for investigations of resting state brain activity is becoming more established1. This method can identify non-BOLD frequency components 1-3, by characterising how well the echo signals decay as a single exponential function2. Either three or four echoes per TR are commonly used4,3. Whilst 4 echoes offers obvious advantages in terms of model fitting; temporal and spatial resolution are compromised. As recently highlighted by Gonzalez et al, a thorough comparison of 3 and 4-echo acquisitions, has been lacking1. In this we work we formally investigate the advantages and disadvantages of both approaches.Methods
The study was approved by the KCL Research Ethics Committee. Scans were acquired in a GE 3T MR750 scanner in 8 healthy volunteers (2F). ME-EPI sequence parameters: FA = 80°, TR = 2500ms TE = 12, 28, 44, 60ms, voxel-size: 3.3x3.3x4mm. Participants observed a cross-hair on a dark screen for a total of 8mins (192) images. A 1mm isotropic T1-weighted MPRAGE image was acquired for co-registration and spatial normalisation.
Image processing
(a) The 1st echo was motion corrected and these motion parameters were applied to subsequent echoes (McFLIRT). (b) EPI images were co-registered to the anatomical T1W image using FSL (epi_reg), (c) normalised to MNI co-ordinates using ANTs (antsApplyTransforms) and (d) skull-stripped (Brain extraction tool, FSL). (e) Normalised images were smoothed with a 5mm Gaussian kernel using SPM. (f) The echo time series (3E and 4E) were concatenated along the z-axis, then fed into the ME-ICA pipeline2. Both 3E and 4E were also ran through the ME-ICA without any smoothing, to provide a total of 4 permutations.
Further de-noising and seed based connectivity analyses
All ME-ICA de-noised data was further filtered using standard filtering techniques: regression of motion, WM/CSF signal, data de-trending, band-pass filtering (>0.1Hz) prior to seed based connectivity analysis, with a supplementary motor area (SMA) seed. Connectivity maps were computed for each permutation using a customised SPM FC script and compared using a 2nd level analysis (SPM).
Summary statistics
ICA outputs were compared using student’s t-tests. We evaluated the number of BOLD components remaining in the de-noised data, and also the number of unidentified components (un-id, undistinguishable from BOLD and non-BOLD) that are kept within the data to examine classification ambiguity. Median tSNR was calculated and compared between 3E and 4E.
Results
3E vs 4E
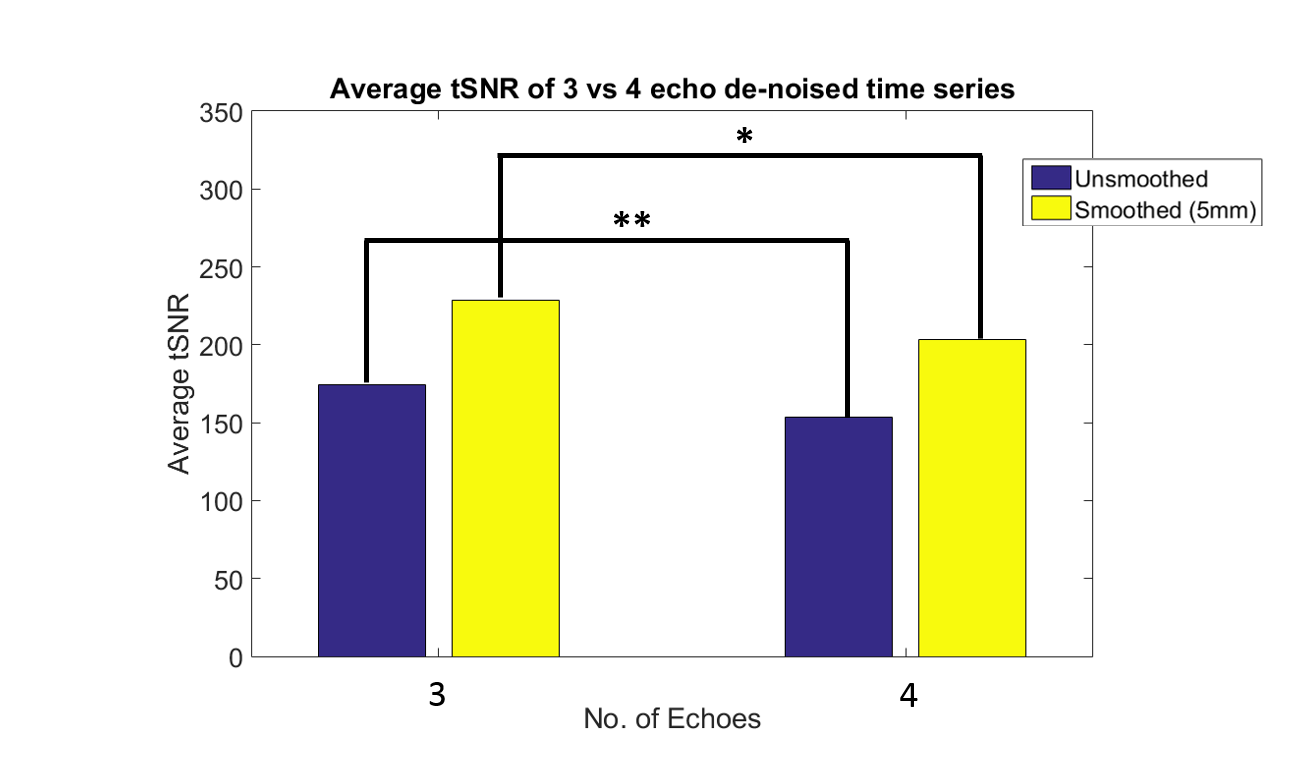
Median tSNR decreased with 4E compared to 3E for both unsmoothed and smoothed data (p<0.001, mean difference=20.4, and p<0.05, md=21.29, respectively) (Fig 1).
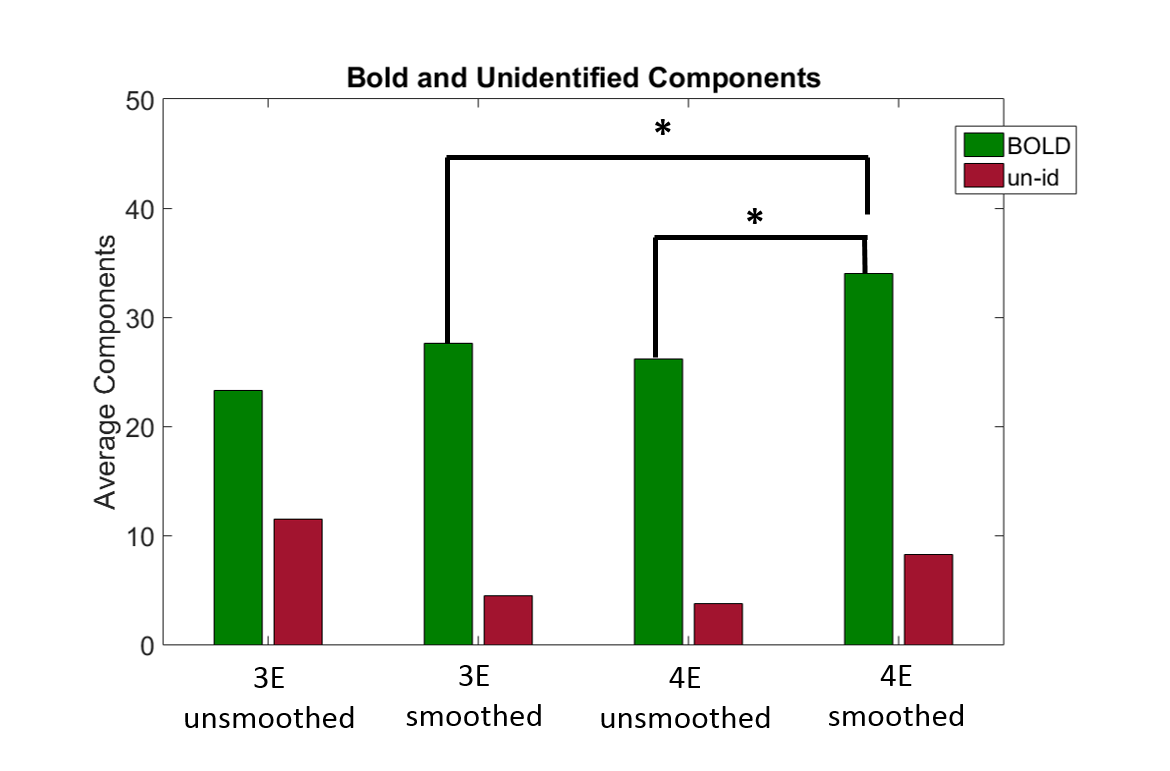
4E datasets classified a significantly larger number of BOLD components in smoothed datasets (p<0.05, md=6.375) vs 3E. There was no difference in the number of unidentified components selected between 3E (mean=4.5) and 4E (mean=8.25). Furthermore, there were no differences between BOLD and un-id components classified in the unsmoothed datasets (3E, mean-BOLD=23.23, mean-un-id=11.5 and 4E, mean-BOLD=26.43, mean-un-id=9.73) (Fig 2).
FC maps
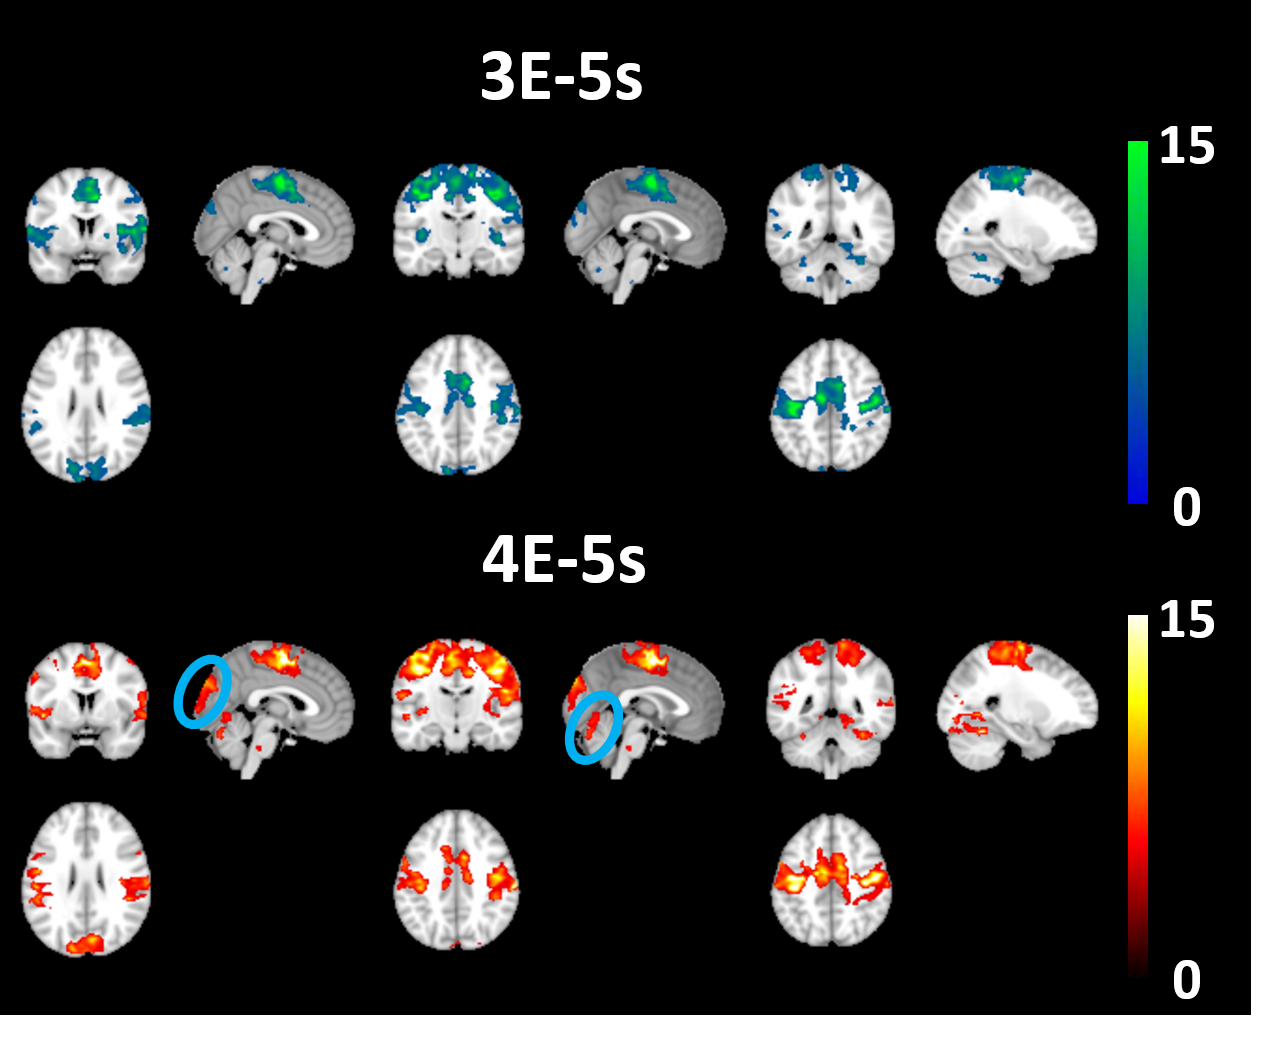
In spite of the above, there were no differences at the second level between any of the permutations, when assessing FC using a SMA seed region. However, minor differences can be visualised from the FC maps. For smoothed 4E FC t-maps (Fig 3) we see greater activation of the visual cortex in comparison to smoothed 3E (Fig 3), as well as a larger area of activation within the superior posterior cerebellum.
Smoothing
Smoothing had no effect on the amount of BOLD or unidentified components in the 3E configurations, (smoothed-BOLD=27.62, un-id=4.5 and unsmoothed-BOLD=23.23, un-id=11.5, respectively. However, we did observe a significant increase in BOLD components in the 4E data with smoothing (p<0.05, md=7.875) but no differences in un-id components (8.25, 9.73, respectively)(Fig 2).
No visual differences in FC maps were observed as a result of smoothing in either 3E or 4E combinations.
Discussion
We have shown that 4E data preserves more BOLD components in the de-noised output. Additional noise in the 4E acquisitions leads to mis-classification of non-BOLD components as BOLD. Spatial smoothing ameliorates this problem. As such the benefits of an extra echo, and importantly an extra point to fit to the de-noising model, did not prove advantageous in this context. This additional low signal echo (TE=60ms) introduced greater classification error and decreased overall tSNR compared to a 3 echo acquisition.Conclusion
As a result of increased tSNR and better de-noising, we recommend using 3E configurations over 4E for ME-ICA analysis of seed-based functional connectivity.Acknowledgements
No acknowledgement found.References
1. Gonzalez-Castillo, J. et al. Evaluation of multi-echo ICA denoising for task based fMRI studies: Block designs, rapid event-related designs, and cardiac-gated fMRI. NeuroImage 141, 452-468, doi:10.1016/j.neuroimage.2016.07.049 (2016).
2. Kundu, P., Inati, S. J., Evans, J. W., Luh, W. M. & Bandettini, P. A. Differentiating BOLD and non-BOLD signals in fMRI time series using multi-echo EPI. NeuroImage 60, 1759-1770, doi:10.1016/j.neuroimage.2011.12.028 (2012).
3. Lombardo, M. V. et al. Improving effect size estimation and statistical power with multi-echo fMRI and its impact on understanding the neural systems supporting mentalizing. NeuroImage, doi:10.1016/j.neuroimage.2016.07.022 (2016).
4. Kundu, P. et al. Integrated strategy for improving functional connectivity mapping using multiecho fMRI. Proceedings of the National Academy of Sciences 110, 16187-16192, doi:10.1073/pnas.1301725110 (2013).
Figures