1626
Echo-time optimization in Spin Echo EPI fMRI using BOLD-sensitivity models and hypercapnic manipulation at 3T1Dept. of Medical Biophysics, University of Toronto, Toronto, ON, Canada, 2Rotman Research Institute, Toronto, ON, Canada
Synopsis
The preferred echo-time (TE) used in most spin-echo EPI (SE-EPI) fMRI studies is approximately the tissue T2 value (65–100ms at 3 T). In this study, we use a hypercapnia paradigm with SE-EPI and three metrics of BOLD-sensitivity to model the TE that maximizes BOLD detection at 3 T. We concluded that while the maximal absolute BOLD contrast occurs near tissue T2 (~75ms), a TE of 55ms both maximizes tissue CNR and minimizes BOLD effects from non-neuronal sources.
Purpose
Compared to gradient-echo EPI (GE-EPI) technique, spin-echo EPI is much less susceptible to signal drop out, and potentially less sensitive to physiological1. However, due to lower BOLD signal sensitivity, SE-EPI is not widely used in fMRI studies. Predominantly, the optimal echo time (TE) for SE-EPI BOLD is assumed to be near the tissue T2 (65‑100ms)2. Previous SE fMRI studies have primarily focused on TE-dependence of blood effects, including micro/macrovascular BOLD contributions, and failed to include the effects of noise3-5. In our previous work6, we showed that the optimal SE-EPI TE may be shorter than the preferred tissue T2 due to increased temporal signal-to-noise ratio (tSNR) at lower TEs. The purpose of this work is to identify an optimal TE at 3T by systematically modeling BOLD sensitivity in SE-EPI using a multi-TE acquisition, for both grey and white matter.Methods
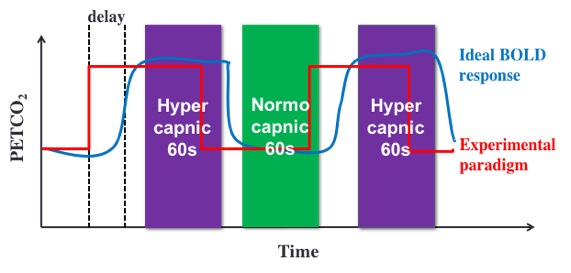
Seven healthy humans were scanned on a 3T Siemens Tim Trio scanner (Siemens Healthcare, Erlangen Germany). A total of five SE-EPI scans were performed on each subject at 5 different TEs: 35, 45, 55, 65 and 75ms using the following imaging parameters: TR = 2s, 192 time points, matrix size = 64 x 64 x 20 and voxel size = 3.4 X 3.4 X 5.8 mm3. Additional SE-EPI scans were performed using non-selective refocusing pulse on a subset of the subjects (5 subjects) to record BOLD signal at the sagittal sinus. A 3D T1-weighted MPRAGE scan was also acquired. During MR Imaging, hypercapnia was by administering mixtures of CO2 and O2 using the RespirAct™ breathing circuit (Thornhill Research, Toronto, Canada). Experimental paradigm shown in Fig. 1 was followed and hypercapnic condition was achieved by increasing end-tidal CO2 pressure (PETCO2) by 5 mmHg from the baseline.
The fMRI data were pre-processed using FSL (www.fmrib.ox.ac.uk/fsl), involving slice timing and motion correction, high pass filtering (<0.005 Hz) and spatial smoothing (5 mm FWHM). Lastly, fMRI images were registered to 3D anatomical images. Gray matter (GM), white matter (WM), cerebrospinal fluid (CSF) and sagittal sinus (SS) masks were created from the anatomical images using FreeSurfer. The latter two masks are used to compute unwanted CSF and large-vein contributions to BOLD. All masks were registered and down-sampled to fMRI native space. Absolute contrast (∆S), contrast-to-noise ratio (CNR) and relative CNR were used to determine BOLD sensitivity:
$$$\Delta S\ [mmHg^{-1}]=\frac{mean\ BOLD_{HiCO_{2}}-mean\ BOLD_{NormoCO_{2}}}{\Delta PETCO_2}$$$
$$$CNR\ [mmHg^{-1}]=\frac{\Delta S}{\sqrt{var\ BOLD_{HiCO_{2}}+var\ BOLD_{NormCO_{2}}}}$$$
$$$Rel. CNR\ [mmHg^{-1}] = CNR_{tissue}-\frac{CNR_{SS}+CNR_{CSF}}{2}$$$
To account for variable response, absolute contrast and CNR were normalized to ∆PETCO2.
Results
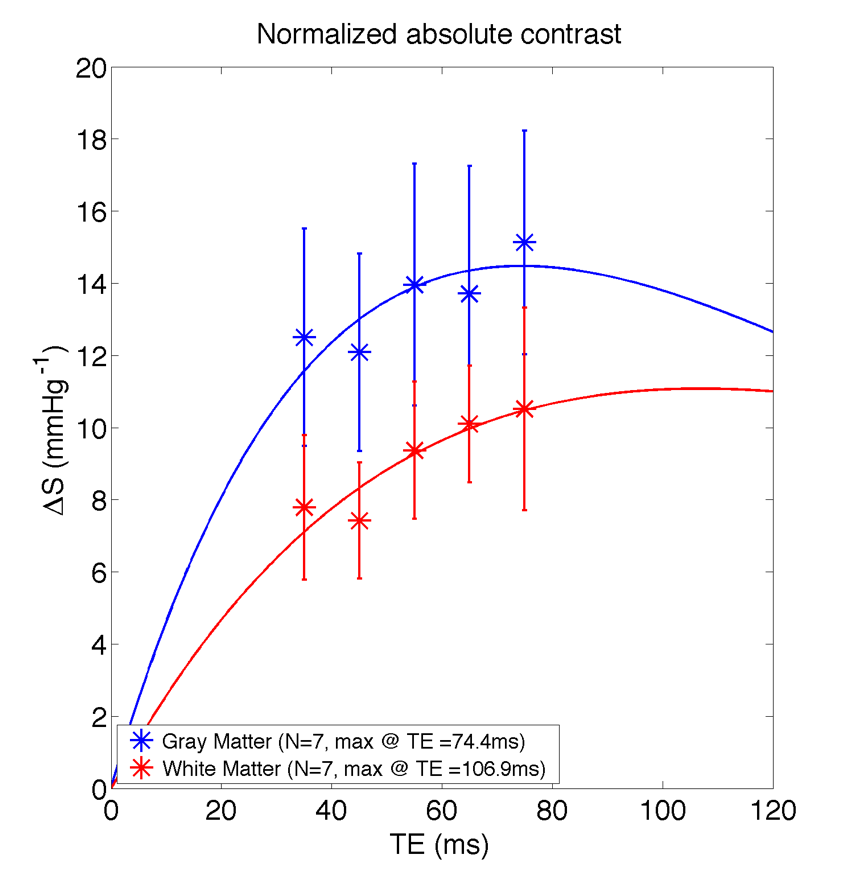
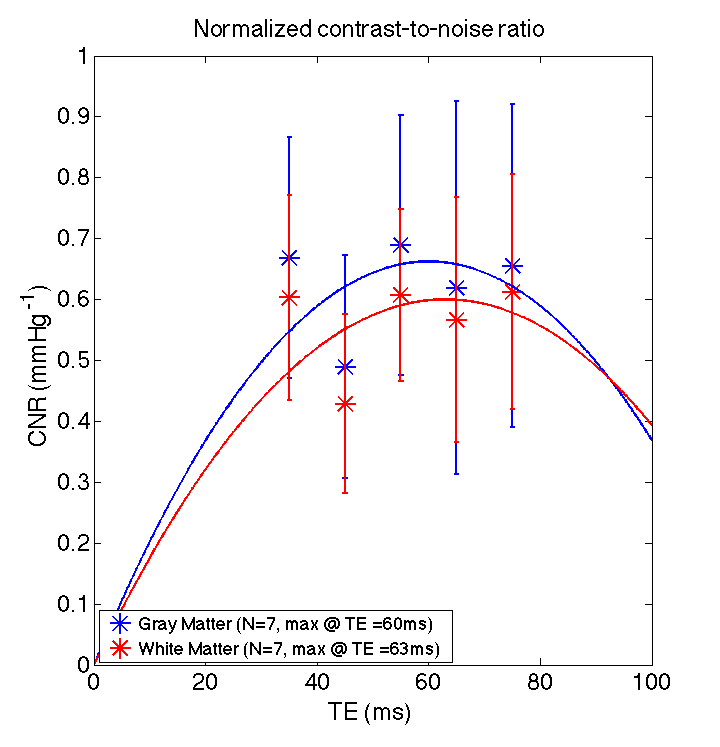
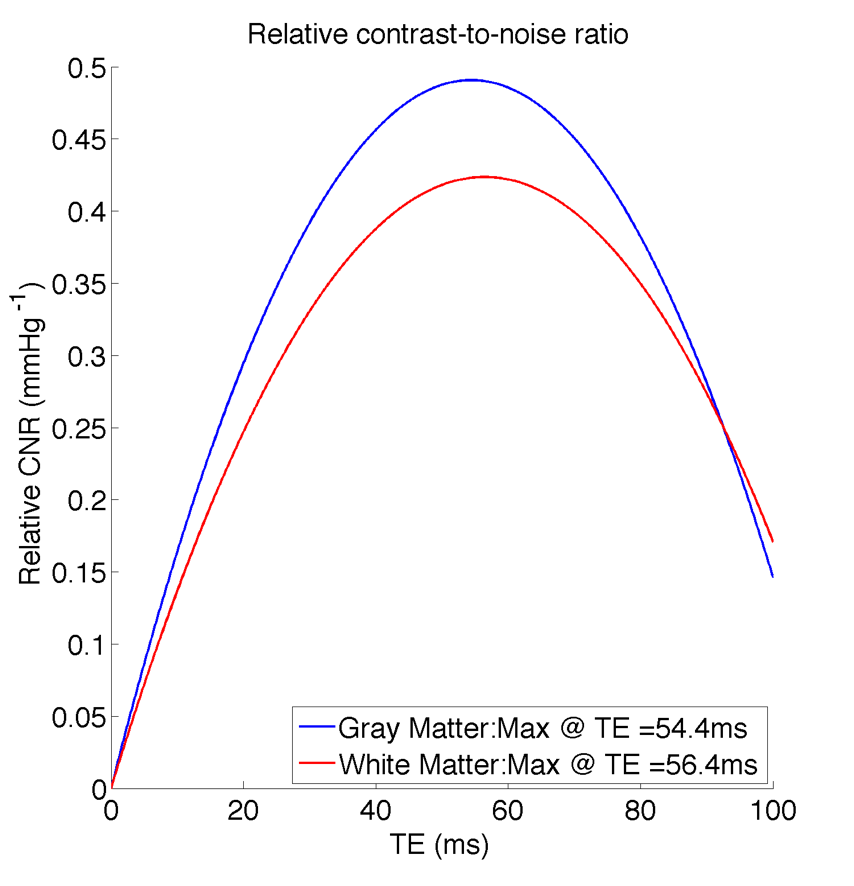
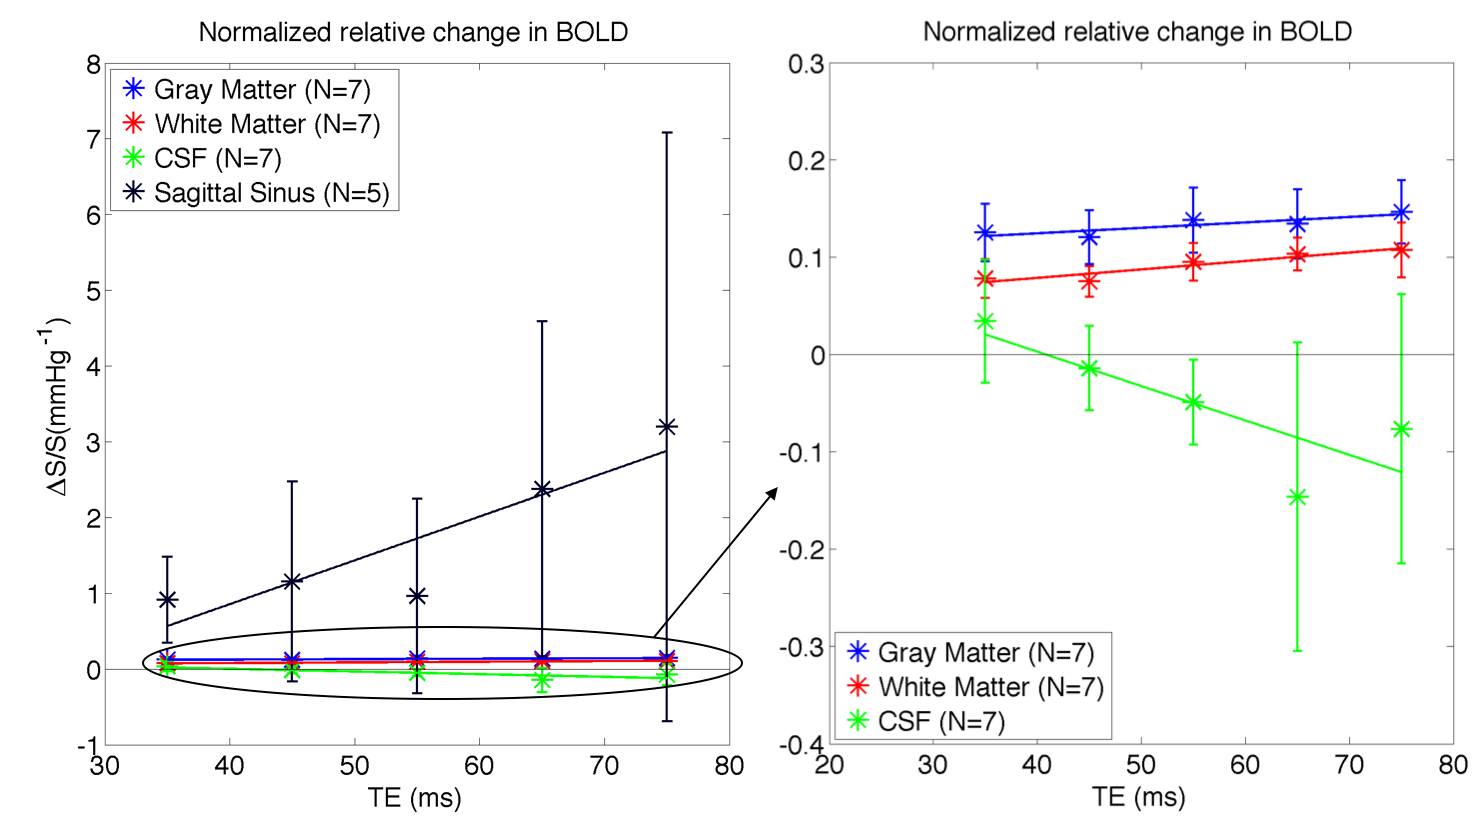
The absolute BOLD contrast of GM and WM is shown in Fig. 2 and modeled as A*TE*exp(-TE/B)7. The maximum absolute contrast occurs at TE= 74.4ms for GM (close to assumed tissue T2) and TE= 106.9ms. When considering the effect of noise, as noise contributions are not necessarily TE-independent, we modeled BOLD CNR as a general quadratic equation (A*TE2 + B*TE). This results in lower optimal TE values of 60ms for GM and 63ms for WM (Fig 3). Another consideration for maximizing BOLD sensitivity to neuronal sources is to minimize BOLD signal from non-neuronal sources like CSF and SS, i.e. by maximizing the relative CNR. This results in a lower optimal TE of 54.4ms and 56.4ms for GM and WM (Fig. 4). These results are likely due to higher BOLD% signal for CSF and SS at higher TEs (Fig. 5).Discussion
The tissues’ T2 value has always been assumed as the optimal TE for SE-EPI, but this assumption only holds if noise is TE independent. While we found that the maximum absolute contrast for GM occurs close to tissue T2 (~75ms), the presence of noise means that the maximum CNR may not occur at this TE. In fact, there is an increase in physiological noise, CSF and large veins contributions at higher TEs. Instead, a TE of 55ms offers a better trade-off between tissue CNR and non-neuronal BOLD effects. This is in agreement with the optimal TE determined in our previous work6 based on temporal SNR.Conclusion
Using a hypercapnia paradigm, we showed that instead of being equated to tissue T2, a TE in the range of 50 to 60 ms is optimal for GM and WM BOLD signal detection. This shorter TE minimizes non-neuronal BOLD signal contributions, thus increasing BOLD sensitivity from neuronal sources. The results of this study might be useful in improving BOLD signal detection for future fMRI studies at 3T.Acknowledgements
We are thankful to the technical support of Mr. Yasha Khatamian and Dr. Ali Golestani. We are also grateful to the Natural Science and Engineering Research Council of Canada and Baycrest for funding support.References
[1] J. L. Boxerman, L. M. Hamberg, B. R. Rosen, and R. M. Weisskoff, “MR contrast due to intravascular magnetic susceptibility perturbations,” Magn Reson Med, vol. 34, no. 4, pp. 555–566, Oct. 1995.
[2] J. P. Wansapura, S. K. Holland, R. S. Dunn, and W. S. Ball, “NMR relaxation times in the human brain at 3.0 tesla,” Journal of Magnetic Resonance Imaging, vol. 9, no. 4, pp. 531–538, Apr. 1999.
[3] T. Q. Duong, E. Yacoub, G. Adriany, X. Hu, K. U??urbil, and S.-G. Kim, “Microvascular BOLD contribution at 4 and 7 T in the human brain: Gradient-echo and spin-echo fMRI with suppression of blood effects,” Magnetic Resonance in Medicine, vol. 49, no. 6, pp. 1019–1027, Jun. 2003.
[4] T. Jin, P. Wang, M. Tasker, F. Zhao, and S.-G. Kim, “Source of nonlinearity in echo-time-dependent BOLD fMRI,” Magnetic Resonance in Medicine, vol. 55, no. 6, pp. 1281–1290, Jun. 2006.
[5] M. J. Silvennoinen, C. S. Clingman, X. Golay, R. A. Kauppinen, and P. C. M. van Zijl, “Comparison of the dependence of bloodR2 andR2* on oxygen saturation at 1.5 and 4.7 Tesla,” Magnetic Resonance in Medicine, vol. 49, no. 1, pp. 47–60, Jan. 2003.
[6] D. M. Ragot and J. J. Chen, “Echo-Time Optimization in Spin-Echo EPI in fMRI using Hypercapnic Manipulation at 3T,” presented at the Annual Meeting of the International Society for Magnetic Resonance in Medicine, Singapore, Singapore, 07-May-2016.
[7] R. S. Menon, S. Ogawa, D. W. Tank, and K. Ugurbil, “Tesla gradient recalled echo characteristics of photic stimulation-induced signal changes in the human primary visual cortex,” Magn Reson Med, vol. 30, no. 3, pp. 380–386, Sep. 1993.
Figures