1622
In vivo assessment of trabecular bone in the proximal femur1A*STAR-NUS Clinical Imaging Research Centre, Singapore, Singapore, 2Clinical Nutrition Research Centre, Singapore, Singapore, 3Institute of Materials Research and Engineering, Singapore, Singapore, 4School of Food and Nutrition, Massey Institute of Food Science and Nutrition, Massey University, New Zealand, 5Diagnostic Radiology, A-STAR-NUS Clinical Imaging Research Centre, Singapore, Singapore
Synopsis
Osteoporosis is a bone disease that predominately affects postmenopausal women. Routine screening of osteoporosis is performed by means of Dual X-ray Absorptiometry (DXA) which is limited by its inability to differentiate between cortical and trabecular bone, reduced accuracy due to overlying tissue and the use of ionising radiation. In this abstract, we investigate the use of MRI as an alternative, in a cohort of 95 Chinese-Singaporean postmenopausal women. Strong correlations with DXA measurements were observed, in addition to significant differences between the normal and osteopenic, normal and osteoporotic groups.
Purpose
Osteoporosis is a metabolic disease, characterized by loss of bone strength. It can lead to bone fractures and it mainly affects postmenopausal women1. The gold standard for osteoporosis screening is Dual X-ray Absorptiometry (DXA) of the proximal femur and the spine, which measures areal Bone Mineral Density (BMD). DXA is routinely used to classify subjects in the healthy, osteopenic or osteoporotic range, based on areal BMD2, but has several limitations. It can overestimate the BMD of larger subjects, or subjects with metabolic disease and aortic calcifications3 and is not a good predictor of fracture risk. Being a projection technique, DXA cannot differentiate between the two different components of bone (cortical and trabecular), which have different contributions to bone strength. Moreover, BMD is not the only factor contributing to bone strength: other properties of bone that are not assessed with BMD are defined as bone quality4,5. 3D imaging techniques, like Quantitative Computer Tomography (QCT), offer volumetric information on the condition of the bone and can differentiate between cortical and trabecular bone. Lack of ionizing radiation makes MRI an appealing alternative method for serial measurements, particularly because other MRI measurements of metabolism and body composition can also be made using MRI. In this abstract, we present a method that assesses the trabecular bone density in the proximal femur of postmenopausal Chinese-Singaporean (C-S) women.Methods
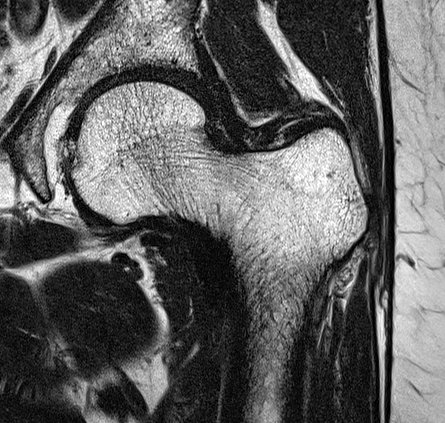
Data from 95 postmenopausal C-S women (average age 60.7±4.2 years) were analysed for this study. All subjects underwent whole body DXA (Hologic Discovery QDR 4500) and MRI (3T Siemens Prisma) using an 18-channel body array coil (Siemens). A proton density (PD, TR=929ms, TE=54ms, 32 averages, acquisition time ~19min) sequence was used to acquire 6 coronal slices in the middle section of the proximal femur of the non-dominant leg (voxel size 0.26x0.26x1.5mm). An example of an acquired slice is shown in Fig. 1. Subjects were classified as healthy, osteopenic or osteoporotic, based on the DXA BMD in the femoral neck. 23 women were found to be in the normal range, 57 in the osteopenic range and 15 in the osteoporotic range.
Bias field correction was performed on the MR images6 and DXA equivalent volumes of interest (VOIs) of trabecular bone were manually selected on the proximal femur (femoral neck and total femur). The Bone Volume Fraction (BVF) of each voxel in the VOIs was calculated, using the method proposed by Vacilic and Wehlri7. Analysis was performed using in-house developed software (using MATLAB R2013b and ITK) as well as available software (ITK-Snap, Microsoft Excel).
Results
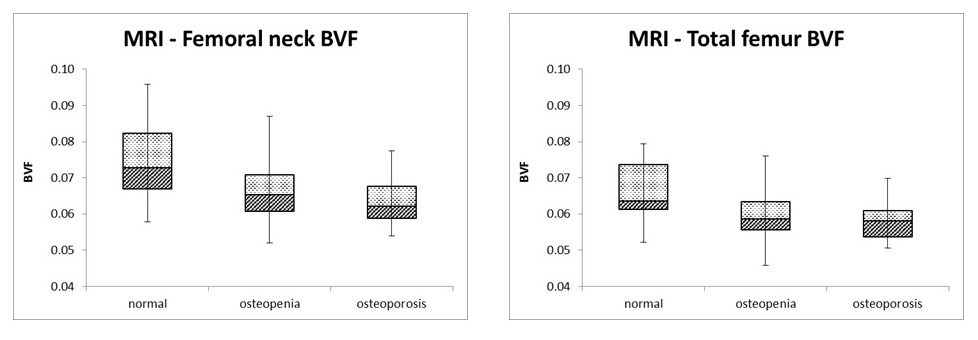
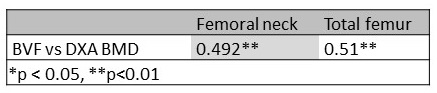
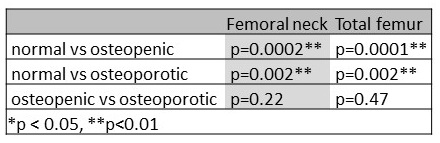
The average areal BMD as measured with DXA was 0.64±0.09g/cm2 for the femoral neck and 0.79±0.1g/cm2 for the total femur. Linear regression analysis showed strong correlation between the areal BMD and the trabecular BVF of respective VOIs (see Table 1). Moreover, two-sample t-Tests were performed between the three groups (healthy-osteoporotic, healthy-osteopenic and osteoporotic-osteopenic) for the femoral neck and the total femur. These tests showed significant differences in trabecular BVF values between healthy and osteoporotic, as well as healthy and osteopenic subjects in both VOIs, but no significant difference between the osteopenic and osteoporotic groups (see Figure 2 and Table 2).Discussion
In this abstract, we used the Bone Volume Fraction (BVF) of the trabecular bone in the proximal femur to assess the bone quality in DXA-equivalent volumes of interest. BVF values correlated strongly with DXA areal BMD values of the respective regions. Moreover, we found that trabecular BVF values of healthy subjects were significantly different to those of subjects with osteopenia and osteoporosis. These findings confirm our previous suggestion that BVF could be considered as a biomarker for assessment of bone strength8.Conclusion
Although trabecular BVF detected differences between subjects in the normal range and those in the osteopenic and osteoporotic range, further investigation is necessary in order to conclude whether it could be a reliable biomarker for bone strength.
Acknowledgements
This project is part funded by
- Singapore-New Zealand Foods for Health Grant (BMRC grant 14/1/16/24/008)
- NMRC NUHS Centre Grant – Medical Image Analysis Core (NMRC/CG/013/2013)
References
1 NIH Consensus Development Panel on Osteoporosis Prevention, Diagnosis and Therapy, Osteoporosis prevention, diagnosis, and therapy JAMA. 2001;285:785-95
2 World Health Organization. Technical report: Assessment of fracture risk and its application to screening for postmenopausal osteoporosis: a report of a WHO study group. Geneva, Switzerland: World Health Organization, 1994.
3 Burghardt AJ et al. High-Resolution Peripheral Quantitative Computed Tomographic Imaging of Cortical and Trabecular Bone Microarchitecture in Patients with Type 2 Diabetes Mellitus, J Clin Endocrinol Metab 2010; 95(11): 5045-5055
4 T. Link, Osteoporosis imaging: state of the art and advanced imaging , Radiology 2012; 263(1): 3-17
5 Griffith JF et al, Looking beyond bone mineral density: Imaging assessment of bone quality, Ann N Y Acad Sci. 2010;1192:45-56
6 N. J. Tustison et al, N4ITK: Improved N3 Bias Correction, IEEE Trans Med Imaging 2010; 29(6): 1310–1320
7 B. Vacilic and F.W.Wehrli, A Novel Local Thresholding Algorithm for Trabecular Bone Volume Fraction Mapping in the Limited Spatial Resolution Regime of In Vivo MRI, IEEE Trans Med Imaging 2006; 24(12): 1574-1585
8 Kalimeri M, Henry CJ, Su XD, Kruger MC, Totman JJ. Assessment of trabecular bone quality of the proximal femur in vivo: a preliminary study. Poster session (2259) presented at: 24th Annual Meeting & Exhibition of the International Society of Magnetic Resonance in Medicine; 2016 May 07-13; Singapore
Figures