1620
The use of quantitative perfusion metrics in evaluating the relationship between perfusion level and intervertebral disc degenerationjiao wang1, yun fei zha1, dong xing1, bing wu2, and hui lin2
1Department of Radiology,Renmin Hospital of Wuhan University, wu han, People's Republic of China, 2GE healthcare China
Synopsis
To explore the relationship between perfusion level and intervertebral disc degeneration.18 individuals underwent MRI exams including DCE-MRI, T2*mapping as well as conventional lumbar imaging. The cranial and caudal VSB and CEP perfusion parameters (Ktrans, Kep, Ve) as well as T2* values of discs were measured. it was found that T2* showed a negative correlation with the Pfirrmann grades, while showed no correlation with the perfusion parameters.
Purpose
Low back pain, which is induced by intervertebral disc degeneration in most cases, has seriously affected life quality of patients and the disc nutrient supply is closely related to intervertebral disc degeneration [1,2]. However, it is challenging to detect intervertebral disc generation in imaging, as the morphological changes usually take place at a very late stage. Endplates pathway was considered as a critical way for intervertebral disc main nutrition, and was believed to play an important role in intervertebral disc degeneration. In the past, contrast enhanced imaging has been used to assess the perfusion level of endplate, however only qualitative and semi-quantitative measurements were used [3,4]. In this work, quantitative metrics derived from dynamic susceptibility contrast (DSC) imaging are investigated in evaluating the relationship between endplate perfusion with intervertebral disc degeneration.Method
Results
Discussion
Conclusion
Hence based on this study, it can be concluded that intervertebral disc degeneration had no direct correlation with endplate perfusion level.
Acknowledgements
I would like to thank for my tutor professor zha ’s help.
References
1.Boubriak O A, Watson N, Sivan S S, et al. Factors regulating viable cell density in the intervertebral disc: blood supply in relation to disc height[J]. J Anat. 2013, 222(3): 341-348. 2. Grunhagen T, Shirazi-Adl A, Fairbank J C, et al. Intervertebral disk nutrition: a review of factors influencing concentrations of nutrients and metabolites[J]. Orthop Clin North Am. 2011, 42(4): 465-477.3.Arpinar V E, Rand S D, Klein A P, et al. Changes in perfusion and diffusion in the endplate regions of degenerating intervertebral discs: a DCE-MRI study[J]. Eur Spine J. 2015, 24(11): 2458-2467.4. Muftuler L T, Jarman J P, Yu H J, et al. Association between intervertebral disc degeneration and endplate perfusion studied by DCE-MRI[J]. Eur Spine J. 2015, 24(4): 679-685.5.Le Maitre C L, Pockert A, Buttle D J, et al. Matrix synthesis and degradation in human intervertebral disc degeneration[J]. Biochem Soc Trans. 2007, 35(Pt 4): 652-655.6. Wang F, Cai F, Shi R, et al. Aging and age related stresses: a senescence mechanism of intervertebral disc degeneration[J]. Osteoarthritis Cartilage. 2016, 24(3): 398-408.7.Rutges J P, Jagt V D O, Oner F C, et al. Micro-CT quantification of subchondral endplate changes in intervertebral disc degeneration[J]. Osteoarthritis Cartilage. 2011, 19(1): 89-95.Figures
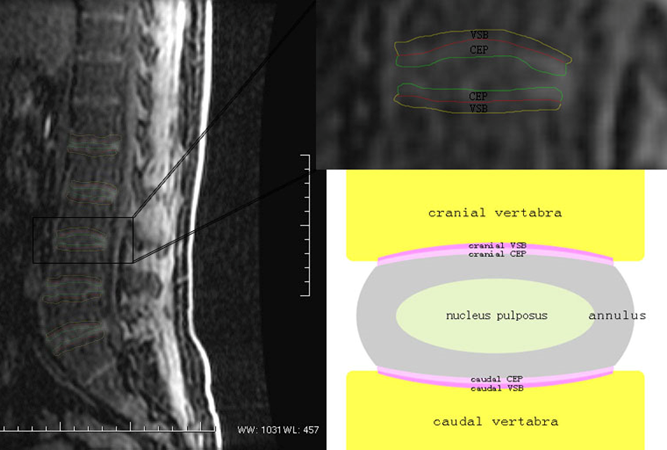
Fig 1:cranial and caudal
VSB and CEP region of interest (ROI). CEP, which covers the cranial and caudal
ends of the disc, VSB, that is located on both sides of the CEP.
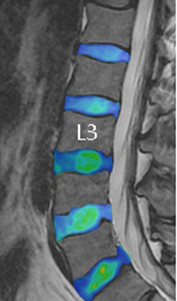
Fig 2: T2*mapping
of intervertebral disc.
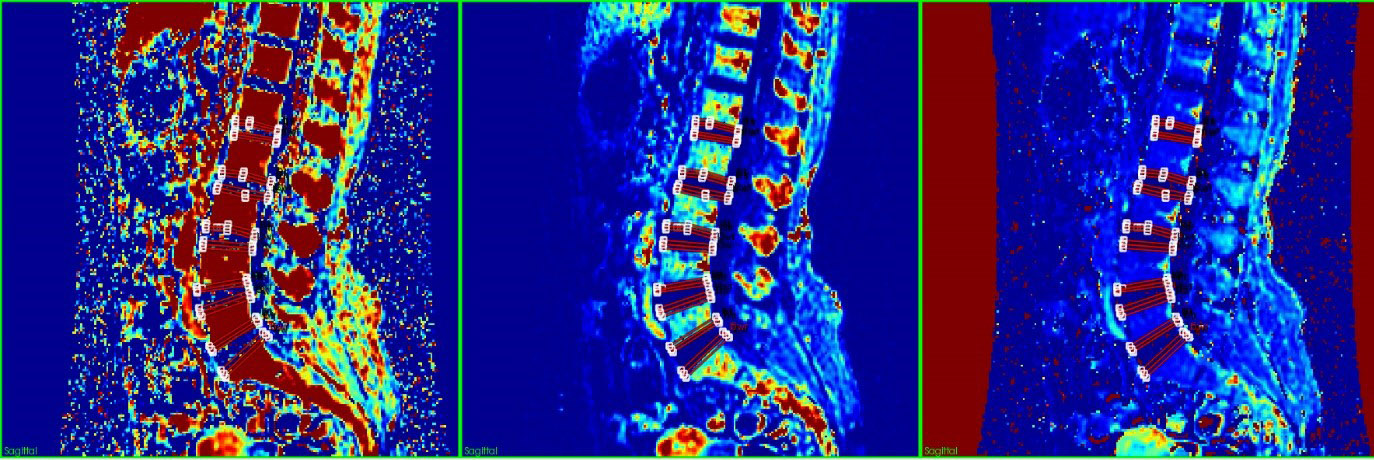
Fig 3: Quantitative
perfusion metrics maps of intervertebral disc. From left to right: Kep,
Ktrans,Ve.
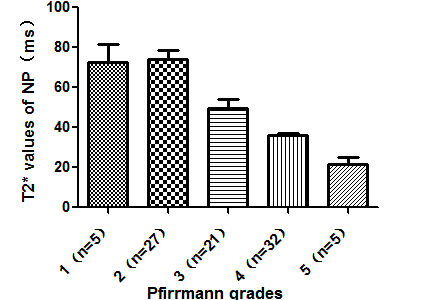
Fig 4: Comparison of T2*
value in different Pfirrmann grades.
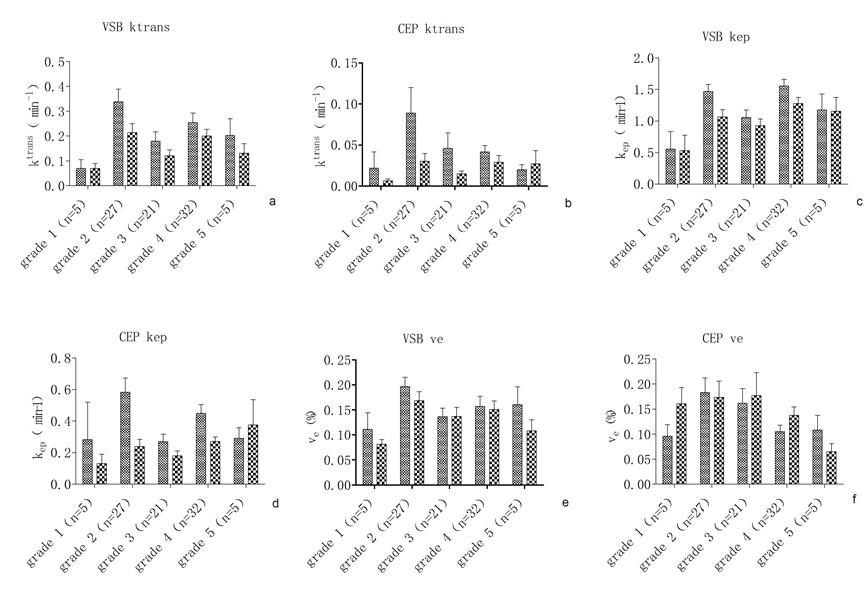
Fig 5: Comparison of
cranial and caudal VSB and CEP perfusion parameters in different Pfirrmann
grades, A-B: Ktrans;C-D:Kep;E-F:Ve.