1618
2D Adiabatic UTE T1rho Imaging: Reduced Sensitivity to the Magic Angle Effect1Radiology, University of California, San Diego, San Diego, CA, United States, 2Radiology Service, VA San Diego Healthcare System, San Diego, United States
Synopsis
Spin lattice relaxation in the rotating frame (T1rho) has been proposed as a biomarker to probe biochemical changes in cartilage. It reflects the slow interactions between motion-restricted water molecules and their local macromolecular environment, and provides unique biochemical information in the low frequency region ranging from a few hundred hertz to a few kilohertz. Changes to the extracellular matrix (ECM), such as proteoglycan (PG) loss, may be reflected in measurements of T1rho and T1rho dispersion. However, T1rho based on conventional continuous wave (CW) spin-locking preparation pulses demonstrate strong magic angle effects. Studies have shown an increase of over 100% in measured T1rho when the fibers were oriented from parallel to 54° relative to the B0 field. Adiabatic T1rho has been proposed to reduce the magic angle effect. However, many joint tissues such as the deep layers of articular cartilage, menisci, ligaments and tendons have short T2 relaxation and cannot be reliably imaged and quantified using the adiabatic T1rho sequence. In this study we aimed to develop a novel 2D adiabatic ultrashort echo time (UTE) T1rho sequence for magic angle insensitive imaging of both short and long T2 tissues in the joint.
Introduction
Spin lattice relaxation in the rotating frame (T1rho) has been proposed as a biomarker to probe biochemical changes in cartilage (1-3). It reflects the slow interactions between motion-restricted water molecules and their local macromolecular environment, and provides unique biochemical information in the low frequency region ranging from a few hundred hertz to a few kilohertz (4). Changes to the extracellular matrix (ECM), such as proteoglycan (PG) loss, may be reflected in measurements of T1rho and T1rho dispersion. However, T1rho based on conventional continuous wave (CW) spin-locking preparation pulses demonstrate strong magic angle effects. Studies have shown an increase of over 100% in measured T1rho when the fibers were oriented from parallel to 54° relative to the B0 field (5,6). Adiabatic T1rho has been proposed to reduce the magic angle effect (7,8). However, many joint tissues such as the deep layers of articular cartilage, menisci, ligaments and tendons have short T2 relaxation and cannot be reliably imaged and quantified using the adiabatic T1rho sequence. In this study we aimed to develop a novel 2D adiabatic ultrashort echo time (UTE) T1rho sequence for magic angle insensitive imaging of both short and long T2 tissues in the joint.Methods
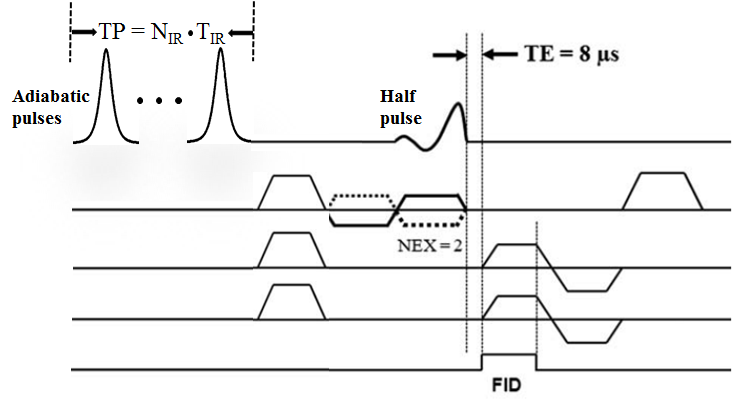
The 2D adiabatic UTE T1rho sequence (Figure 1) employs paired adiabatic inversion recovery (IR) preparation pulses followed by regular 2D UTE imaging, where half pulse excitation is followed by 2D radial ramp sampling. Each adiabatic inversion pulse has a duration of 8.64 ms and maximal B1 of 1.21 µT. Paired adiabatic inversion pulses are required to achieve adiabatic spin-locking. Up to four pairs were used for adiabatic UTE T1rho imaging. Other imaging parameters included: TR = 1 s, TE = 8 µs, FOV = 8 cm, slice thickness = 4 mm, flip angle = 10°, bandwidth = 125 kHz, matrix = 128×128, 127 projections, four spin-locking times (preparation time [TP] = 17.28, 34.56, 51.84, 69.12 ms), with 4 min per acquisition. The 2D adiabatic UTE-T1rho sequence was applied to four rotator cuff tendons (two supraspinatus and two infraspinatus tendons) harvested from two shoulder specimens (mean age 86 years old). In comparison, a clinical Carr-Purcell-Meiboom-Gill (CPMG) sequence was also applied to measure T2 of the rotator cuff tendons. The imaging protocol was applied to the samples five times, each with a different orientation (0°, 30°, 54°, 70° and 90° relative to B0). A single-component model was applied to fit T1rho and T2, and their angular dependences were analyzed.Results
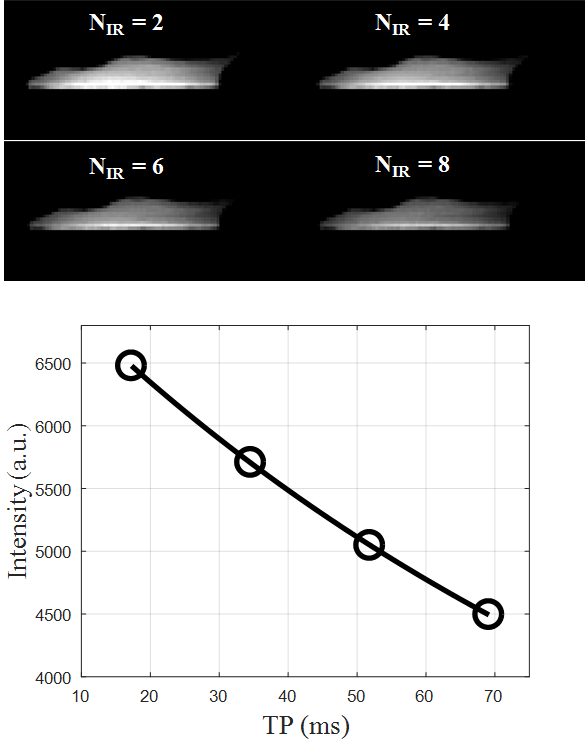
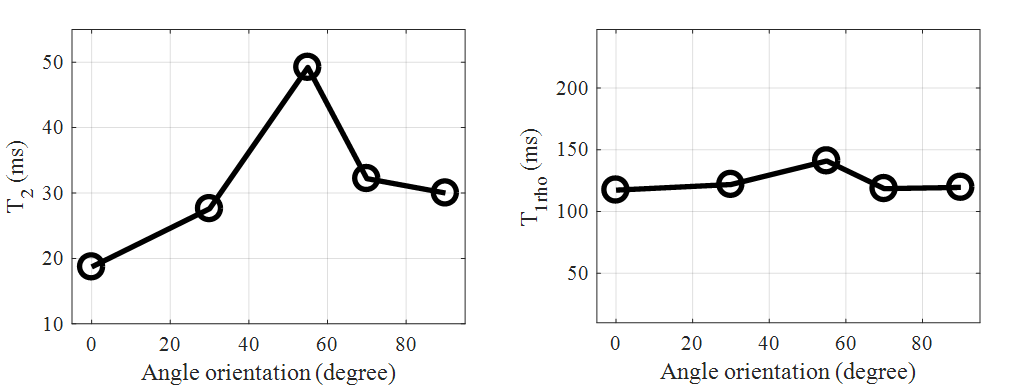
Figure 2 shows representative 2D adiabatic UTE T1rho images of a rotator cuff sample imaged with one to four pairs of adiabatic inversion pulse preparation. Signal from the rotator cuff showed an excellent mono-exponential decay, with a T1rho of 119.6 ms for this specimen. Figure 3 shows the angular dependence of CPMG T2 and adiabatic UTE T1rho values of the same region of interest (ROI) drawn in the rotator cuff. A strong magic angle effect was observed for CPMG T2, which increased by more than 100% when the fibers were oriented near the magic angle of 54° relative to the B0 field. This strong magic angle is due to the dipole-dipole interaction between the ordered collagen fibers in the rotator cuff. In contrast, the adiabatic UTE T1rho sequence showed nearly no magic angle effect, with less than 8% variation (standard deviation / mean value) when the sample was oriented from parallel to B0 to near the magic angle and further to 90° relative to the B0 field.Discussion and Conclusion
Our prior studies have demonstrated a strong magic angle effect using the regular UTE T1rho sequence (6, 9), while the adiabatic UTE T1rho imaging technique is nearly magic angle independent. This is likely due to the adiabatic inversion pulses, which slowly rotate the proton magnetizations and thus act as a spin-locking pulse cluster. The use of paired adiabatic inversion pulses guarantees minimal interference to the longitudinal magnetization. Signal is preserved while achieving spin-locking, thus enabling T1rho relaxation. When the adiabatic condition is met, adiabatic spin-locking is likely to be achieved. Further research is needed to investigate the magic angle behavior of the adiabatic UTE T1rho sequence when imaging other tissues such as articular cartilage, menisci, ligaments and other tendons (9). In addition, the histological correlate of this measurement and clinical significance will also be investigated in future studies.Acknowledgements
The authors acknowledge grant support from NIH (1R01 AR062581-01A1, 1 R01 AR068987-01) and VA Clinical Science R&D Service (Merit Award I01CX001388).References
1. Duvvuri U, Reddy R, Patel SD, Kaufman JH, Kneeland JB, Leigh JS. T1rho-relaxation in articular cartilage: effects of enzymatic degradation. Magn Reson Med 1997; 38:863-867.
2. Regatte RR, Akella SVS, Lonner JH, Kneeland JB, Reddy R. T1? relaxation mapping in human osteoarthritis (OA) cartilage: comparison of T1? with T2. J Magn Reson Imaging 2006; 23:547-553.
3. Li X, Han ET, Ma B, Link TM, Newitt DC, Majumdar S. In vivo 3T spiral imaging based multi-slice T1? mapping of knee cartilage in osteoarthritis. Magn Reson Med 2005; 54:929-936.
4. Knispel RR, Thompson RT, Pintar MM. Dispersion of proton spin-lattice relaxation in tissues. J Magn Reson 1974; 14:44-51.
5. Mlynarik V, Szomolanyi P, Toffanin R, Vittur F, Trattnig S. Transverse relaxation mechanisms in articular cartilage. J Magn Reson 2004; 300-307.
6. Du J, Statum S, Znamirowski R, Bydder GM, Chung CB. Ultrashort TE T1rho magic angle imaging. Magn Reson Med 2013;69(3):682-687.
7. Rautiainen J, Nissi MJ, Liimatainen T, Herzog W, Korhonen RK, Nieminen MT. Adiabatic rotating frame relaxation of MRI reveals early cartilage degeneration in a rabbit model of anterior cruciate ligament transection. Osteoarthritis and Cartilage 2014; 22:1444-1452.
8. Casula V, Autio J, Nissi MJ, Auerbach EJ, Ellermann J, Lammentausta E, Nieminen MT. Validation and optimization of adiabatic T1rho and T2rho for quantitative imaging of articular cartilage at 3T. Magn Reson Med 2016, March 4.
9. Du J, Carl M, Diaz E, Takahashi A, Han E, Szeverenyi NM, Chung CB, Bydder GM. Ultrashort TE T1rho (UTE T1rho) imaging of the Achilles tendon and meniscus. Magn Reson Med 2010;64(3):834-842.
Figures