1615
Application of lower extremity oxygenation imaging in animal model of microsphere-induced femoral artery embolization1Academy for Advanced Interdisciplinary Studies, Peking University, Beijing, People's Republic of China, 2interventional radiology and vascular surgery, Peking University First Hospital, Beijing, People's Republic of China, 3College of Engineering, Peking University, Beijing, People's Republic of China, 4Department of Radiology, Peking University First Hospital, Beijing, People's Republic of China
Synopsis
Embolization following percutaneous intervention is a universal problem occurring in all vascular beds, especially in lower extremities. This study assesses the performance of a noninvasive MRI based oxygenation imaging, in characterizing muscle oxygen extraction fraction (OEF) level after microsphere-induced lower extremity embolization in animal models. By comparison of the calculated muscle OEFs and R2’ before and after surgery, significantly increase could be found. The results show promise in the evaluation of early muscle ischemia in many clinical diseases such as acute lower limb embolism or peripheral artery disease.
Background
Embolization following percutaneous intervention is a universal problem occurring in all vascular beds, especially in lower extremities1. However, there is little literature about performing noninvasive imaging in the assessment of embolization-induced lower extremity ischemia.Purpose
The aim of this study is to assess the performance of a noninvasive MRI based oxygenation imaging, in characterizing muscle oxygen extraction fraction (OEF) level after microsphere-induced lower extremity embolization in animal models.Materials and Methods
Animal models
The study was performed in accordance with National Institutes of Health approved guidelines of the Animal Care and Use Institutional Committee. Ten New Zealand White rabbits (male; weight range 2.5-3.5 kg) were included in this study. Under anesthesia with sodium pentobarbital (30 mg/kg body weight), microspheres (acryl beads, 40 to 120 um in diameter) were injected slowly into the femoral artery through under the guidance of digital subtraction angiography (DSA) to make distal embolization.
DSA imaging
Abdominal aortography was performed using a 5F pigtail catheter using the Seldinger technique. DSA images were obtained in the anteroposterior projection at a rate of 2 frames/s. Additional projections to image the origin of the vessel without the overlying aorta were obtained when needed.
MR imaging
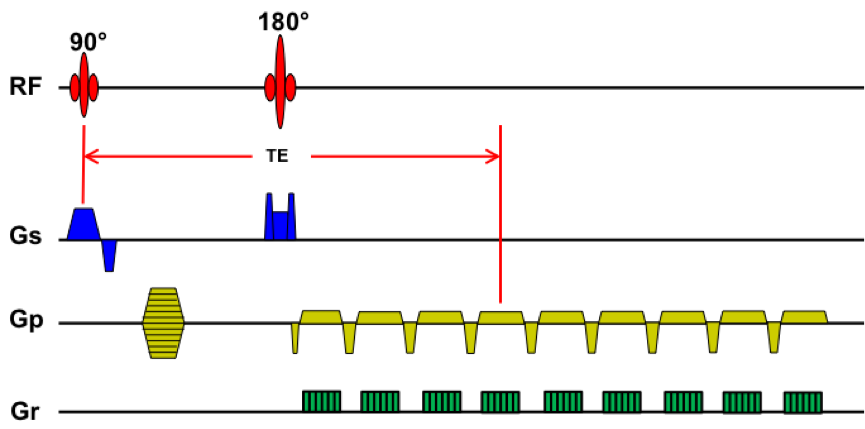
All images were obtained on a 3.0-T clinical MRI system (Signa ExciteTM; GE Medical Systems, Milwaukee, WI, USA) with maximal gradient strength of 20 mT/m. The gradient echo sampling spin echo (GESSE) sequence2 with 32 echoes was implemented to acquire the source images. Diagram of the GESSE sequence is shown in Fig 1. The imaging parameters were: TR = 1.5 s; TE = 56 ms, FOV = 150 × 150 mm2; matrix size = 128 × 128; slice thickness = 6 mm; total acquisition = 4 min. MEGSE sequence (Fig. 2) was used to acquire images and subsequently used to extract R2, R2’ and R2*.
Quantitative Analysis
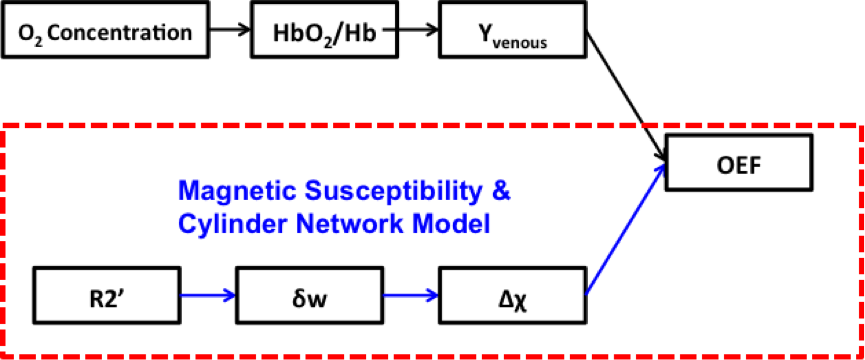
Muscle OEF maps were generated as reported previously2 using a home-built MATLAB (MathWorks Inc., Natick, MA, USA) program. The measurement of skeletal muscle OEF was derived with a model based on the magnetic susceptibility effect of deoxyhemoglobins3. The workflow of the skeletal muscle OEF estimation procedure is demonstrated in Fig 2. A nonlinear least-squares curve fitting function was used to fit this model. Regions of interest (ROIs) were defined in the spin echo image of the GESSE sequence. Results are expressed as means ± SD. The differences between groups were analyzed with the paired two-sided Student t-test. Statistically significant difference was indicated by a P value of less than .05.
Results
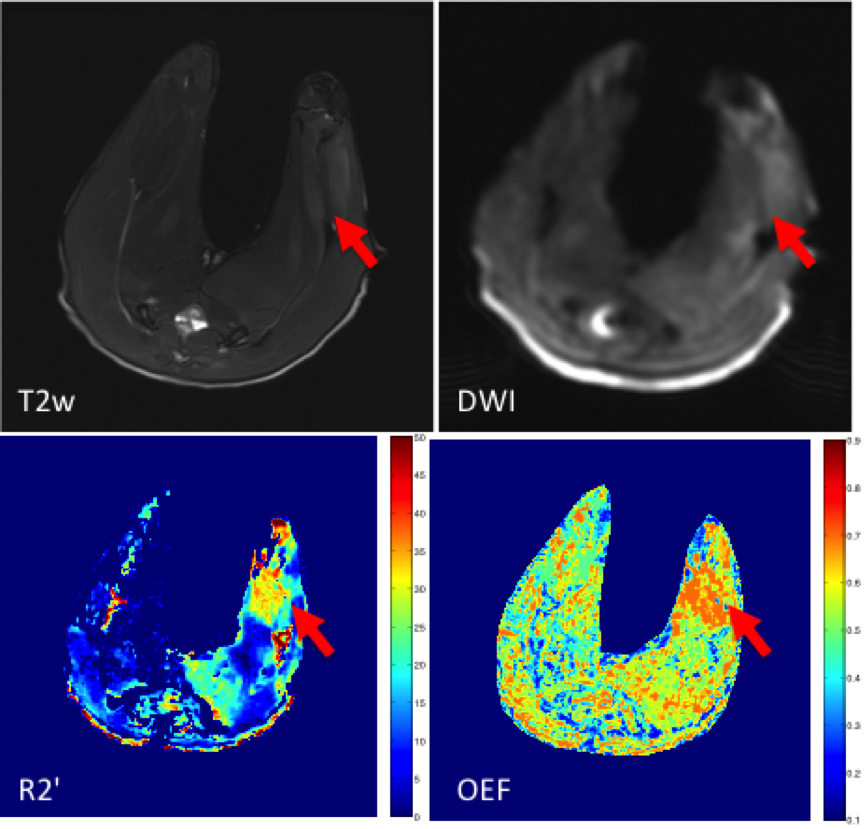
DSA and MRI data were successfully acquired in all the ten rabbits. Fig 3 shows the DSA images of the lower extremity vascular before (a) and after (b) microsphere injection. Representative anatomical T2w image, DWI, R2’ and OEF maps of the lower limb muscles after femoral artery embolization are displayed in Fig 4. It is clearly shown that the R2’ and OEF increases obviously in the affected calf muscle (red arrow).
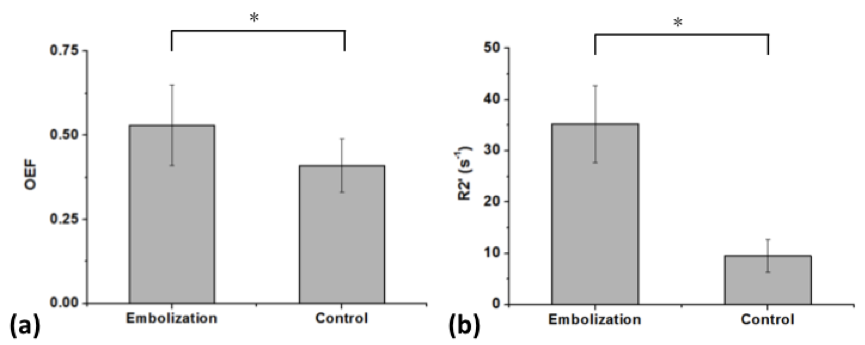
The average muscle OEF and R2’ of all rabbits are displayed in Fig 5. The OEF rises significantly from 0.41 ± 0.08 to 0.53 ± 0.12 (P < 0.05). And the muscle R2’ increases significantly from 9.5 ± 3.2 to 35.2 ± 7.5 (P < 0.05).
Discussion & Conclusion
This study demonstrates the feasibility of applying noninvasive measurements of regional skeletal muscle oxygenation in animal models with unilateral lower limb embolism. By comparison of the calculated muscle OEFs and R2’ before and after surgery, significantly increase could be found. The results show promise in the evaluation of early muscle ischemia in many clinical diseases such as acute lower limb embolism or peripheral artery disease.Acknowledgements
No acknowledgement found.References
1. Karnabatidis D, Katsanos K, Kagadis GC, et al. Distal embolism during percutaneous revascularization of infra-aortic arterial occlusive disease: An underestimated phenomenon. J Endovasc Ther 2006;13:269–280.
2. An H, Lin W. Quantitative measurements of cerebral blood oxygen saturation using magnetic resonance imaging[J]. Journal of Cerebral Blood Flow & Metabolism, 2000, 20(8): 1225-1236.
3. Yablonskiy D A, Haacke E M. Theory of NMR signal behavior in magnetically inhomogeneous tissues: the static dephasing regime[J]. Magnetic Resonance in Medicine, 1994, 32(6): 749-763.
Figures