1613
Fat Fraction and R2* as Measures of Bone Marrow Composition and Structure: Validation in Fat-Water-Bone Phantoms1Centre for Medical Imaging, University College London, London, United Kingdom, 2Centre for Adolescent Rheumatology, University College London, London, United Kingdom, 3Medical Physics, University College London Hospitals
Synopsis
MRI is becoming central to clinical decision-making in diseases involving the bone marrow, including spondyloarthritis and multiple myeloma. Both diseases cause alterations in marrow composition and structure, but there is currently no reliable method for quantifying these changes. Here, we describe a series of fat-water-bone phantoms enabling validation of proton density fat-fraction (PDFF) and R2* as measures of marrow composition and trabecular bone mineral density (BMD) respectively. Our data suggest that PDFF measurements can be achieved with excellent accuracy. Furthermore, there was a strong relationship between R2* and BMD, suggesting that R2* could be used to monitor BMD in vivo.
Introduction
MRI is becoming an important part of clinical decision making for diseases which involve the bone marrow. Both of these diseases can cause alterations in the trabecular structure of the marrow: new bone formation and bone destruction may both occur in spondyloarthritis 1, while lytic marrow lesions are a hallmark of multiple myeloma. However, at present there are no reliable methods available for assessing trabecular structure in these diseases. Furthermore, current imaging methods for assessing bone marrow composition (for example, an increase in water content in areas of inflammation) rely heavily on visual interpretation, which is subjective and depends on the specific sequence and imaging platform being used.
The aim of this study was to determine the extent to which proton density fat fraction (PDFF) and R2* could be used as quantitative measures of bone marrow composition and trabecular structure (specifically, trabecular bone mineral density), respectively, using a series of fat-water and fat-water-bone phantoms.
Methods
Fat-Water Phantom
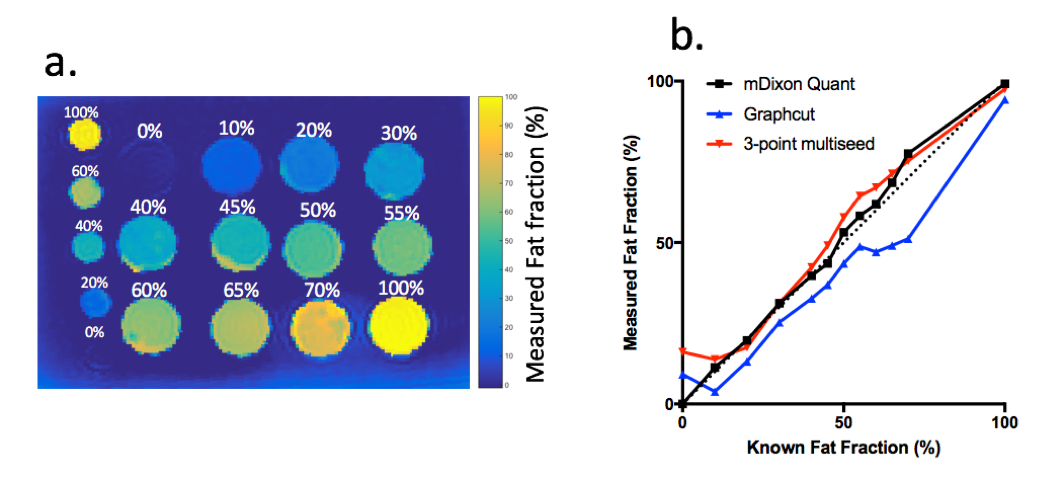
A fat-water phantom consisting of twelve 50ml centrifuge tubes with varying true fat volume percentages (Figure 1) was constructed based on previously-described phantoms 2. Fat percentages from 0-100% were chosen to reflect the range of fat fraction values observed in normal bone marrow (typically 40-60%) 3, whilst also allowing for increases and decreases in pathology. Each tube contained appropriate volumes of peanut oil and agar solution (3% w/v) which were emulsified using sodium dodecyl sulphate. After mixing, the tubes were allowed to cool and all formed a solid gel.
Fat-Water-Bone Phantom
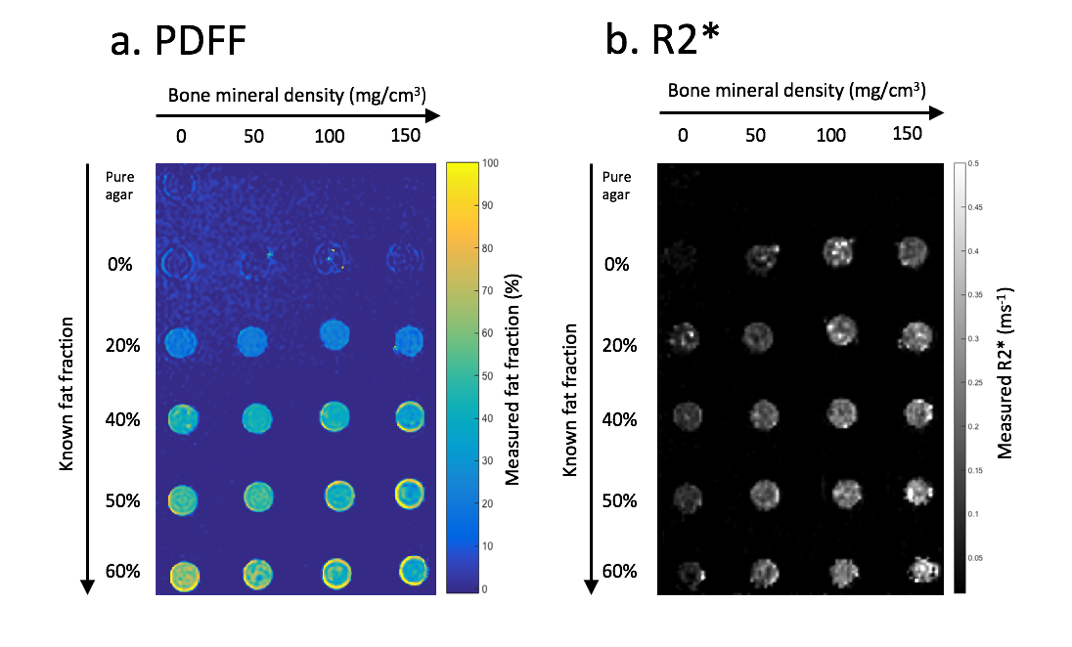
A fat-water-bone phantom (Figure 2) consisting of fat-water emulsions (as above) and granules of anorganic bovine trabecular bone matrix (NuOss, particle size 250-1000mm) was constructed as shown in Figure 2. The masses of bone matrix in the tubes were chosen to reflect the range of bone mineral densities occurring both in healthy subjects 4 and in disease.
Imaging
Chemical shift-encoded MRI (CSE-MRI) was performed on a 3.0T clinical system (Ingenia, Philips, Amsterdam, Netherlands) with integrated posterior and anterior surface coils using a six-echo 3D-spoiled gradient echo (SPGR) acquisition with flyback gradients. Imaging parameters included: first echo 1.17ms, echo spacing 1.6ms, repetition time 25ms, flip angle of 3°. Fat fraction maps were generated both in-line on the scanner (Philips mDixon Quant) and off-line using the raw complex image data and in-house MatLab code, which implemented previously described methods 5,6. Linear regression was used to compare measured with known fat fractions and to compare measured R2* values with known bone mineral densities. Two-sided t-tests determined whether there were statistically significant differences between obtained slope and values and 1.0, and obtained intercept values and 0.0.
Results
Fat-Water Phantom
PDFF maps from the fat-water phantom are shown in Figure 1a; in Figure 1b, measured PDFF values are compared with known values for each of the three methods tested. For all three algorithms, the slope and intercept did not significantly differ from 1 and 0 respectively (p>0.05). Measured fat fractions agreed best with known fat fractions using the mDixon Quant method: mean error measurements were 2.1% for mDixon Quant, 5.7% for three-point multiseed and 9.0% for the graph cut method.
Fat-Water-Bone Phantom
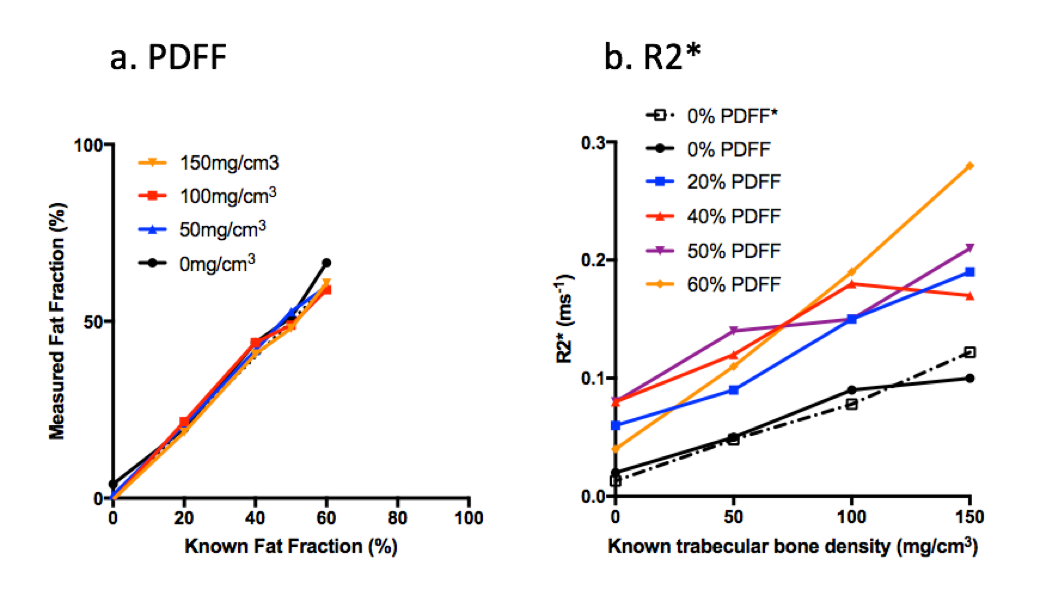
PDFF and R2* maps from the fat-water-bone phantom are shown in Figure 2. Figure 3a shows measured PDFF against known values for each bone mineral density, and Figure 3b shows measured R2* values against known bone mineral density for each fat fraction. PDFF measurements did not significantly deviate from known measurements for any of the four bone mineral densities (p>0.05 for both slope and intercept). R2* measurements did not significantly deviate from linearity for any of the five PDFF measurements (p>0.05), although there was a significant increase in slope over the five PDFF values (p<0.0005).
Discussion
Fat quantification in the bone marrow is challenging due to the specific range of PDFF values encountered (typically 40-60%) and the presence of bony trabeculae. Here, we describe a series of phantoms which enable validation of PDFF and R2* measurements over ranges typically encountered in both healthy and disease states. Our results suggest that PDFF measurements can be achieved with a high level of accuracy. Furthermore, there was a strong relationship between R2* and bone mineral density. Although R2* measurements were increased in phantoms containing fat compared to 0% PDFF, the relationship was approximately linear for each PDFF. The results suggest that R2* could be used in vivo to monitor changes in bone mineral density.Conclusion
FF and R2* measurements could be used as quantitative measures of bone marrow composition and structure respectively.Acknowledgements
We are grateful to Ania Radziszewska for her help with laboratory equipment and phantom preparation.References
1. Neidhart, M. et al. Expression of cathepsin K and matrix metalloproteinase 1 indicate persistent osteodestructive activity in long-standing ankylosing spondylitis. Ann. Rheum. Dis. 68, 1334–1339 (2009).
2. Hines, C. D. G. et al. T1 independent, T2* corrected MRI with accurate spectral modeling for quantification of fat: Validation in a fat-water-SPIO phantom. J. Magn. Reson. Imaging 30, 1215–1222 (2009).
3. Dieckmeyer, M. et al. The need for T2 correction on MRS-based vertebral bone marrow fat quantification: Implications for bone marrow fat fraction age dependence. NMR Biomed. 28, 432–439 (2015).
4. Majumdar, S. et al. Correlation of trabecular bone structure with age, bone mineral density, and osteoporotic status: in vivo studies in the distal radius using high resolution magnetic resonance imaging. J. Bone Miner. Res. 12, 111–118 (1997).
5. Hernando, D., Liang, Z. P. & Kellman, P. Chemical shift-based water/fat separation: A comparison of signal models. Magn. Reson. Med. 64, 811–822 (2010).
6. Berglund, J., Johansson, L., Ahlström, H. & Kullberg, J. Three-point Dixon method enables whole-body water and fat imaging of obese subjects. Magn. Reson. Med. 63, 1659–1668 (2010).
Figures