1610
Ultrashort Echo Time Chemical Shift Quantitative Susceptibility Mapping (UTE-CS-QSM) for Hemosiderin Assessment in Hemophilic Arthropathy1Department of Radiology, University of California, San Diego, CA, United States, 2Institute of Electrical Engineering, Chinese Academy of Science, Beijing, People's Republic of China, 3Department of Medicine, Division of Hematology/Oncology, University of California, San Diego, CA, United States, 4Department of Radiology, Weill Cornell Medical College, New York, NY, United States, 5Radiology Service, VA San Diego Healthcare System, San Diego, CA, United States
Synopsis
Hemosiderin deposition in hypertrophic synovium is a hallmark of progressive hemophilic arthropathy and accumulates with joint bleeding. . Conventional quantification of hemosiderin uses semi-quantitative MRI scores, assigning grades of small, moderate, or large to assess the burden of hemosiderin. To date, there is no known method to assess or quantify hemosiderin concentration within synovium due to the extremely short T2 values of this tissue. In this pilot study, we demonstrated that the clinically compatible IDEAL UTE-CS-QSM technique can be used to quantify hemosiderin depositions. We have shown that synovium in joints with hemophilic arthropathy demonstrates various susceptibility values, likely corresponding to different concentrations of hemosiderin.
Introduction
Hemophilia is an inherited bleeding disorder, which affects ~1:5,000 – 1:25,000 live male births. Abnormal bleeding results from a deficiency of either factor VIII or IX blood-clotting proteins. A debilitating and common manifestation is spontaneous joint bleeding, which results in the progressive accumulation of hemosiderin-laden synovium. When uncontrolled, this results in articular destruction necessitating joint replacement. Despite prophylactic dosing of clotting factor concentrates that greatly reduce overt joint bleeding, many patients’ joints continue to deteriorate partly due to continued subclinical bleeding. To optimize highly costly prophylactic treatment strategies (>$150,000/year/patient) it would be very desirable to develop a non-invasive method to quantify the burden of subclinical bleeding by interval measurements of increasing hemosiderin accumulation within the joint. Existing conventional techniques only permit semi-quantitative estimates of hemosiderin and preclude sensitive quantification due to the extremely short T2* of hemosiderin.Purpose
To utilize a 3D ultrashort echo time technique with cones readout combined with chemical shift quantitative susceptibility mapping (UTE-CS-QSM) on volunteers and patients with hemophilic arthropathy for assessment of hemosiderin-laden synovium.Methods
Subjects: Three healthy volunteers (mean age 31 ± 3.2 years) and three patients with hemophilic arthropathy ranging from mild to severe (mean age 50 ± 22.5 years) provided written informed consent for this IRB-approved, HIPAA-compliant study.
Protocol: Imaging was performed on a 3T clinical scanner (Signa HDx, GE Healthcare, Milwaukee, WI) using an 8-channel transmit-receive knee coil. In addition to conventional clinical sequences, UTE-CS-QSM imaging parameters included the following: two sets of four-echo UTE-Cones acquisitions (TEs=0.03/3/6/9 ms and 0.4/4/7/10 ms, TR=15.6, FA=14, FOV=19.2 cm, 1mm isotropic voxel size, imaging time 8 minutes).
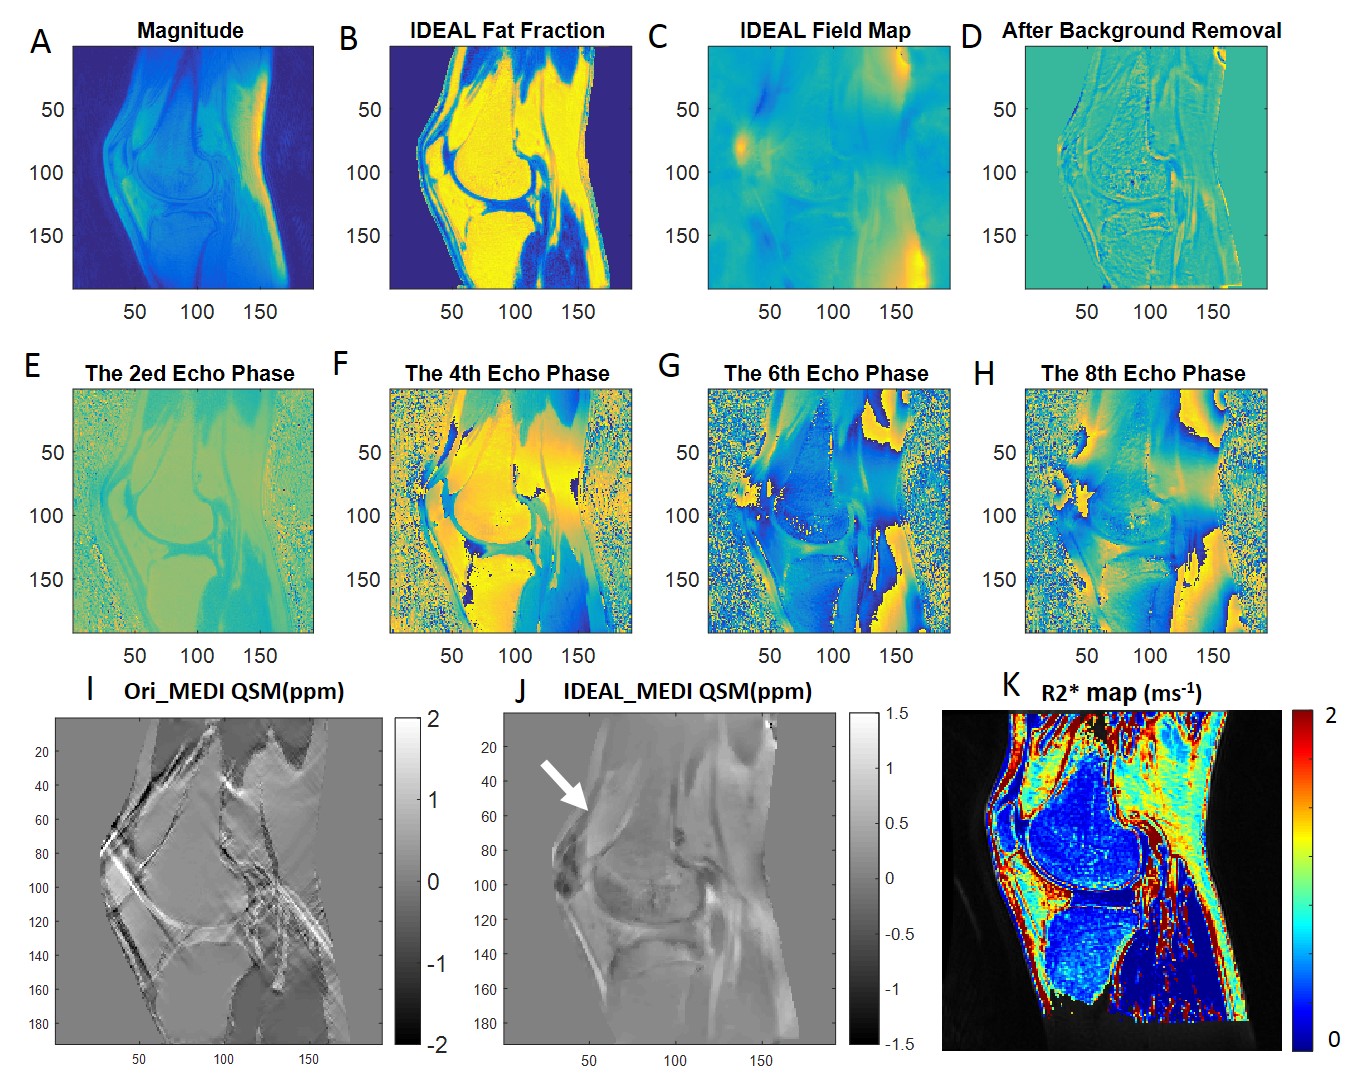
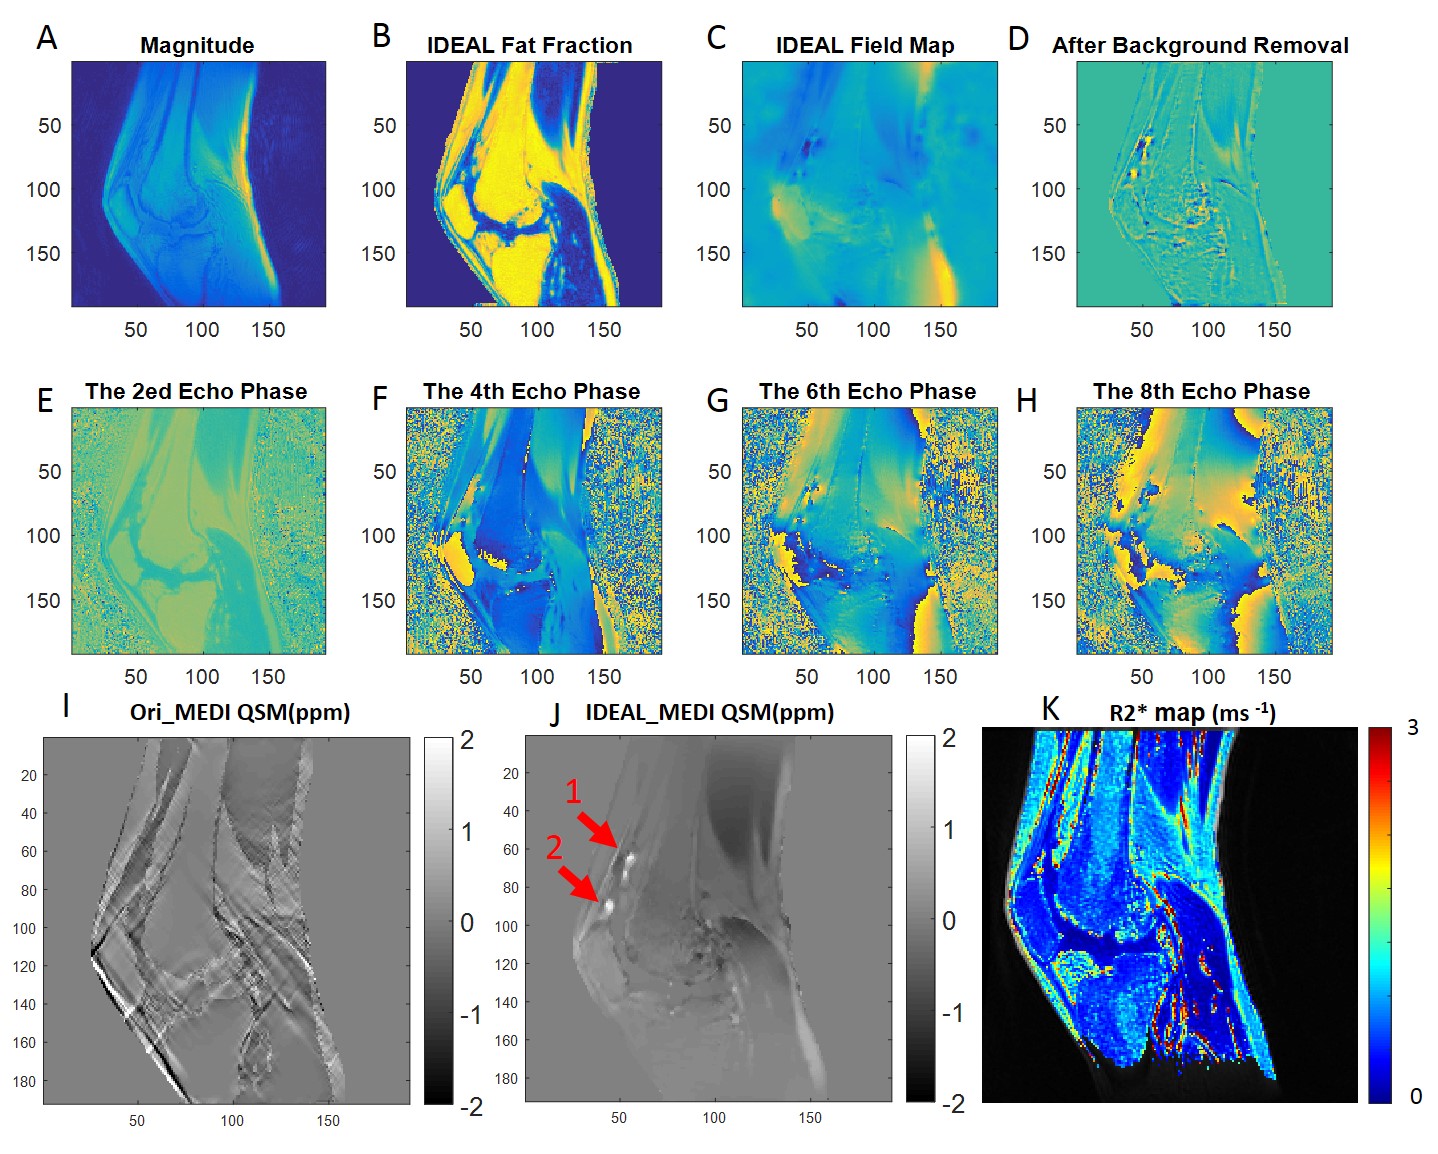
Image Processing and Analysis: Nonuniform fast Fourier transform (NUFFT) with the Kaiser-Bessel kernel and min-max interpolation was implemented1. Because of the non-uniform sampling density of our 3D UTE-Cones trajectory, density compensation was applied to the measured signal prior to regridding. Each data set was reconstructed on a coil-by-coil and echo-by-echo basis. Phase combination was applied by multiplying the conjugate of the first echo data of each coil. Water, fat, and field map were then obtained using IDEAL-based techniques. In the current work, field map estimation was carried out using a graph cut based method2-3. The resulting inhomogeneity field was then passed to the morphology enabled dipole inversion (MEDI) pipeline for susceptibility calculation4. T2* and R2* maps were calculated using the same dataset and a least square fitting method. Regions of interest (ROIs) were manually selected and mean values were compared.
Results
Excellent water, fat, and inhomogeneity maps were obtained using the IDEAL-based technique for all scans. Figures 1 and 2 are representative images for a healthy volunteer and a patient with severe hemophilic arthropathy, respectively. In the healthy volunteer, there is no joint effusion or synovial hypertrophy and the QSM map shows no distinct nodules of increased susceptibility in the collapsed suprapatellar recess (white arrow, Figure 1J). However, in the patient with severe hemophilic arthropathy, three distinct nodules of positive susceptibility are seen in the suprapatellar recess, measuring between 1.66 – 1.70 ppm, indicating paramagnetism related to hemosiderin-laden synovium (Figure 2J). UTE-CS-QSM maps can be used to detect and quantify hemosiderin deposits.Discussion
Hemosiderin deposition in hypertrophic synovium is a hallmark of progressive hemophilic arthropathy and accumulates with joint bleeding. Therefore, hemosiderin can be considered a biomarker, which, if quantifiable, could be critical to optimize joint bleeding prevention strategies. While hemosiderin can be detected with conventional MRI sequences, they are insensitive to quantification. Conventional quantification of hemosiderin uses semi-quantitative MRI scores, assigning grades of small, moderate, or large to assess the burden of hemosiderin5. To date, there is no known method to assess or quantify hemosiderin concentration within synovium due to the extremely short T2 values of this tissue. In this pilot study, we have demonstrated that the clinically compatible IDEAL UTE-CS-QSM technique can be used to quantify hemosiderin depositions. We have shown that synovium in joints with hemophilic arthropathy demonstrates various susceptibility values, likely corresponding to different concentrations of hemosiderin. Further refinement of these techniques for broad clinical application appears critical to further advance care by providing an imaging tool to gauge effectiveness of current treatment strategies to prevent the progression of hemophilic arthropathy, a debilitating comorbidity in hemophilia.Acknowledgements
The authors acknowledge grant funding from the VA Clinical Science R&D Service (Merit Award I01CX001388), Biogen, Health Resources and Services Administration, National Natural Science Foundation of China (NSFC 51607169) and Chinese Scholarship Council Grant (CSC 201504910174). We acknowledge the use of the Fat-Water Toolbox (http://ismrm.org/workshops/FatWater12/data.htm).References
1. Fessler JA. On NUFFT-based gridding for non-Cartesian MRI. J Magn Reson. 2007 Oct;188(2):191-5. 2. Hernando D, Kellman P, Haldar JP, Liang ZP. Robust water/fat separation in the presence of large field inhomogeneities using a graph cut algorithm. Magn Reson Med. 2010 Jan;63(1):79-90. 3. Dong J, Liu T, Chen F, Zhou D, Dimov A, Raj A, Cheng Q, Spincemaille P, Wang Y. Simultaneous phase unwrapping and removal of chemical shift (SPURS) using graph cuts: application in quantitative susceptibility mapping. IEEE Trans Med Imaging. 2015 Feb;34(2):531-40. 4. Liu J, Liu T, de Rochefort L, et al. Morphology enabled dipole inversion for quantitative susceptibility mapping using structural consistency between the magnitude image and the susceptibility map. Neuroimage. 2012 Feb 1;59(3):2560-8. 5. Keshava SN, Gibikote S, Doria AS. Imaging evaluation of hemophilia: musculoskeletal approach. Semin Thromb Hemost. 2015 Nov;41(8):880-93.Figures