1609
Iterative Denoising of Undersampled PROPELLER Diffusion-Weighted Imaging near Metal Implants1Medical College Wisconsin, Milwaukee, WI, United States, 2GE Healthcare
Synopsis
Diffusion weighted imaging is widely used in musculoskeletal MR imaging. Current implementations of diffusion-weighted imaging include the use of PROPELLER DUO imaging sequence and multi-spectral MRI imaging techniques. However, these implementations are restricted by long acquisition times. In this work we propose to an approach to undersample the blades in a uniform fashion and denoise the reconstructed image using total variation based denoising approach. This approach provides acceptable results up to an acceleration factor of 3 and reduces the scan time. This reduction in scan time can be used to acquire multiple slices within clinically feasible scan times.
Introduction
Diffusion weighted imaging near the metal suffers from severe susceptibility artifacts induced by metal implants. However, these artifacts can be removed using multi-spectral imaging approach. In this approach, several images are collected at different off-resonance frequencies [1,2].
The PROPELLER technique [3] is used to mitigate the CPMG stability issues introduced by diffusion weighting. The PROPELLER DUO technique encodes the spin and stimulated echoes in two separate readout gradients and these echoes are split into two separate orthogonal blades [4]. This approach requires fewer blades to be acquired and cuts the total scan time by half. This reduction in scan time is not sufficient to collect large numbers of slices in clinically feasible times.
The fully sampled data acquired has a significant amount of redundancy because of the overlapping blades. Here, we describe an approach to reduce the number of blades by reducing the overlap while maintaining Nyquist sampling for most of k-space. However, this reduction number of blades leads to noisy reconstructions, which is corrected by an iterative total variation (TV) based image denoising approach [5].
Methods
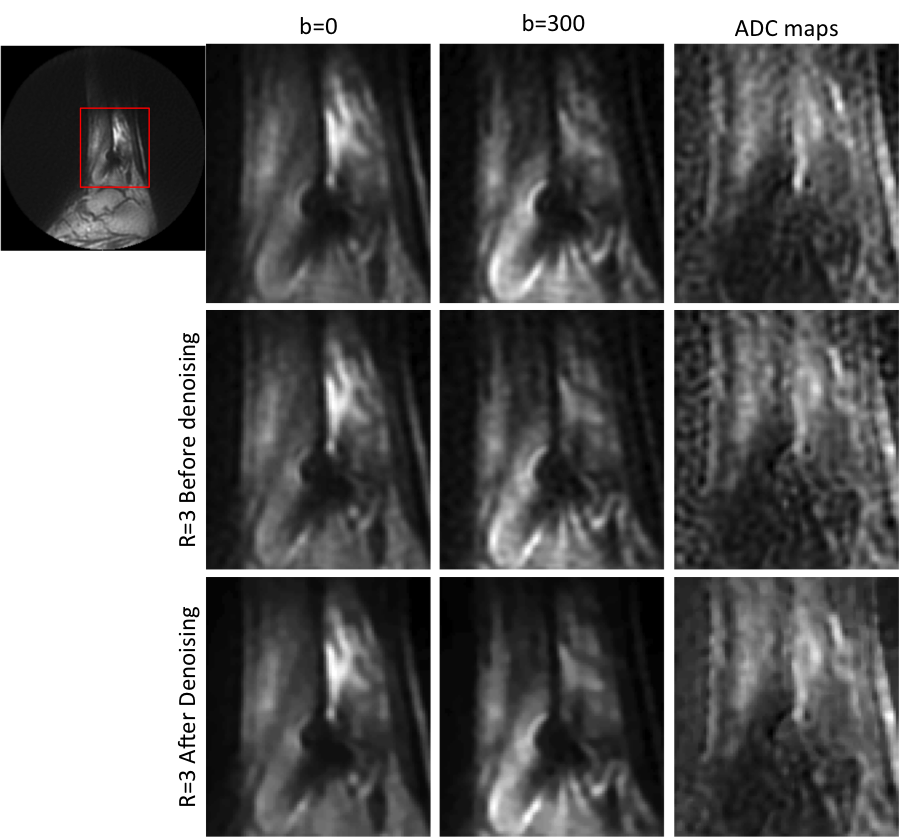
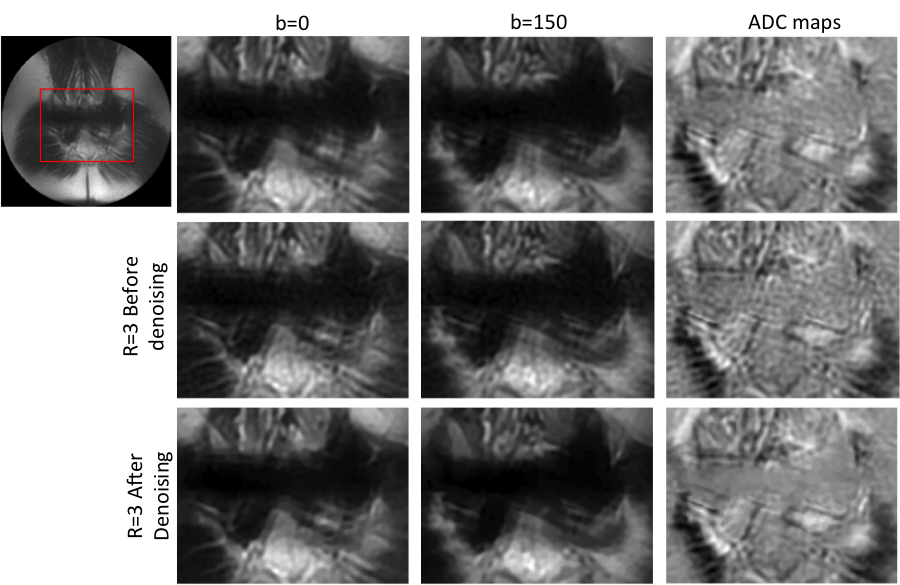
In-vivo data was acquired in subjects suspected with cancerous lesions in the proximity of metal implants. Two fully sampled datasets were acquired, one with ankle fixation screw and another with sacral interference screw in the pelvic region. The total number of blades and number of spectral bins for ankle dataset was 44 (ETL=24) and 8 and that for the pelvic dataset was 24 (ETL=32) and 10. Two sets of multi-spectral images were acquired with b=0 and b=150s/mm2 for the pelvic data and b=0 and b=300s/mm2 for the ankle data. The datasets were retrospectively undersampled by skipping every other pair blades for an acceleration factor (R) of 2 and by skipping 2 pairs of blades for R=3. Individual bins were reconstructed as detailed by Pipe et Al. in [3]. The bins were then combined in a sum of squares fashion to yield the artifact-minimized images. These images were then denoised by a denoising approach using total variation regularization. The regularization parameter was optimized to yield the least mean square error (MSE) when compared to the fully sampled data. Apparent diffusion coefficient (ADC) maps were calculated using a mono-exponential diffusion model.Results
Figures 1 and 2 demonstrate this approach for the ankle dataset and the pelvic dataset. We can see that the results for R=3 after denoising are comparable to the fully sampled dataset for both b values. Also the denoising approach reduces the noisy artifacts as seen from the ADC maps in the both the figures.
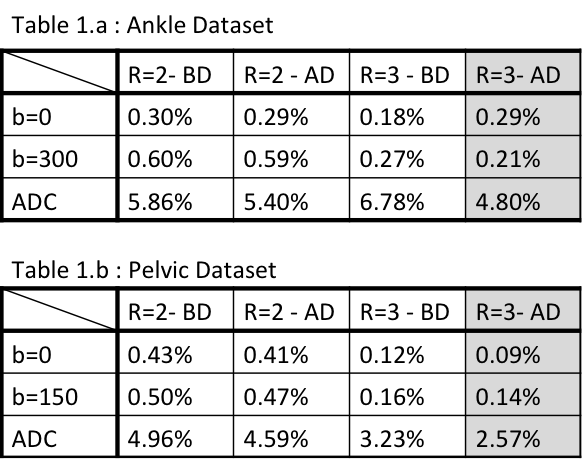
Table 1.a and 1.b show the MSE values calculated for b=0, b>0 and ADC maps at acceleration factors of 2 and 3 for ankle and pelvic datasets respectively. We observe that the results for R=3 after denoising (last column in grey) have the least MSE and thus the denoising approach yields comparable results. Although the difference in results for b values is minimal before and after denoising, denoising approach considerably improves the quality of ADC maps.
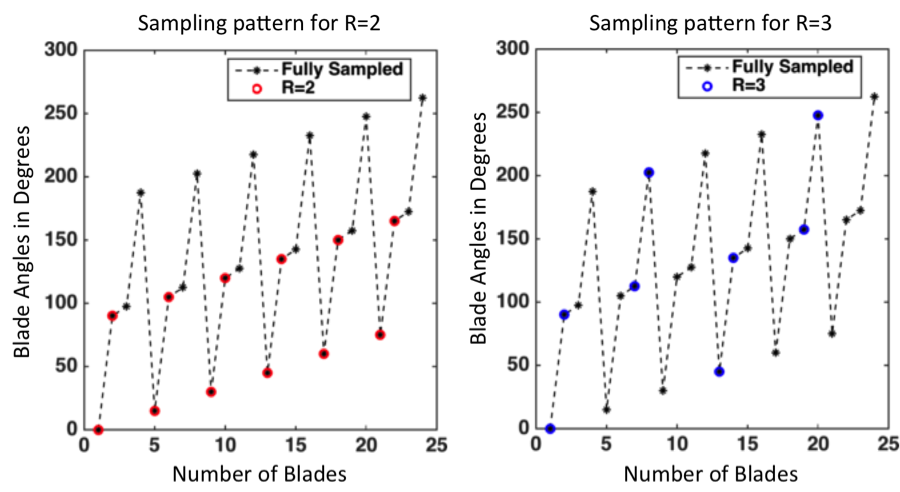
Figure 3 demonstrates the sampling pattern for R=2 and R=3 for the pelvic dataset. The total number of blades collected is 24 as represented in black. We can see the blades chosen are different for R=2 (red) and R=3(blue). Hence the corresponding angles are also different. R=3 samples the k- space more uniformly. This uniform sampling translates to lower MSE at R=3 as compared to that at R=2 for both datasets as seen in Table 1a and 1b. This reduction in error is also translated to the ADC maps.
Conclusion
The redundancy in the dataset due to heavily overlapping blades was exploited. The denoising approach enables accelerating the acquisition by a factor of 3. This will enable acquisition of multiple slices in the time gained by acceleration.Acknowledgements
This work was funded in part by grants from Advancing a Healthier Wisconsin and GE Healthcare.References
[1] Koch KM, Lorbiecki JE, Hinks RS, King KF. A multispectral three- dimensional acquisition technique for imaging near metal implants. Magn Reson Med 2009; 61:381–390.
[2] Lu W, Pauly KB, Gold GE, Pauly JM, Hargreaves BA. SEMAC: slice encoding for metal artifact correction in MRI. Magn Reson Med 2009; 62:66–76.
[3] Pipe JG, Farthing VG, Forbes KP. Multishot diffusion-weighted FSE using PROPELLER MRI. Magn. Reson. Med. 2002; 47:42–52. doi: 10.1002/mrm.10014.
[4] Zhao X, Li Z, Gaddipati A, PROPELLER DUO: Applied to Diffusion-Weighted Imaging. In: Proceedings of the 17th Annual Meeting of the ISMRM. Vol. 644. ; 2009. p. 3517.
[5] Rudin LI, Osher S, Fatemi E. Nonlinear total variation based noise removal algorithms. Phys D 1992; 60: 259–268
Figures