1605
The value of dynamic contrast-enhanced MRI quantitative parameters in evaluating the efficacy of neoadjuvant chemotherapy for osteosarcoma1Department of Radiology, The Third Affiliated Hospital of Kunming Medical University, KunMing, Yunnan Province, People's Republic of China, 2The Third Affiliated Hospital of Kunming Medical University, 3GE healthcare, china, KunMing, Yunnan Province, People's Republic of China
Synopsis
Osteosarcoma is
the most common bone sarcoma in children and adolescents 1. Response
of osteosarcoma to NAC should be assessed preoperatively, but conventional
imaging has limit, and histopathological examination cannot dynamically observe
the response of tumor to treatment. DCE-MRI can reflect the pathophysiology of
tumor at microvascular and cellular level. Currently, researchers have used
DCE-MRI qualitative and semi-quantitative method to analyze the response of
osteosarcoma to NAC, but studies on DCE-MRI quantitative analysis are rarely
reported. Therefore, we analyzed the quantitative parameter change of DCE-MRI
in 17 patients of osteosarcoma before and after NAC, and compared good response
and poor response to chemotherapy in order to explore the value of DCE-MRI
quantitative parameters in assessing the response of osteosarcoma to NAC.
Synopsis
Osteosarcoma is the most common bone sarcoma in children and adolescents 1. Response of osteosarcoma to NAC should be assessed preoperatively, but conventional imaging has limit, and histopathological examination cannot dynamically observe the response of tumor to treatment. DCE-MRI can reflect the pathophysiology of tumor at microvascular and cellular level. Currently, researchers have used DCE-MRI qualitative and semi-quantitative method to analyze the response of osteosarcoma to NAC, but studies on DCE-MRI quantitative analysis are rarely reported. Therefore, we analyzed the quantitative parameter change of DCE-MRI in 17 patients of osteosarcoma before and after NAC, and compared good response and poor response to chemotherapy in order to explore the value of DCE-MRI quantitative parameters in assessing the response of osteosarcoma to NAC.Objectives
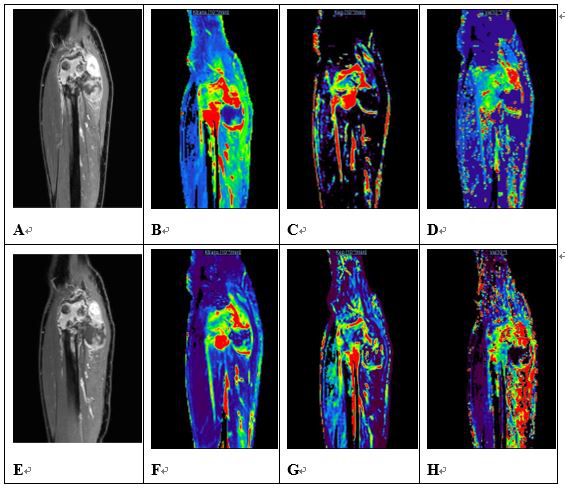
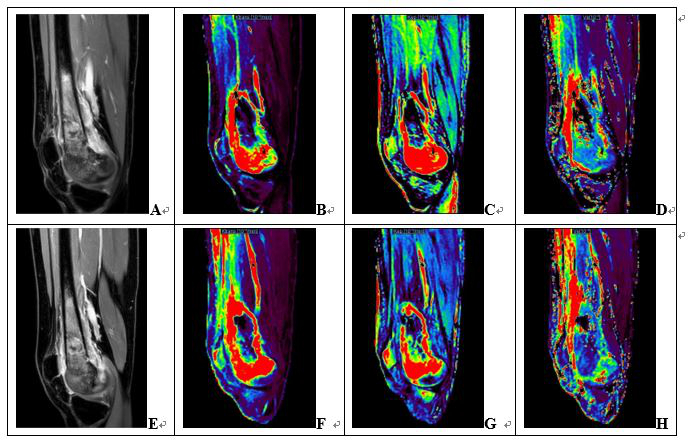
To investigate the change of quantitative parameters of dynamic contrast-enhanced magnetic resonance imaging (DCE-MRI) before and after neoadjuvant chemotherapy (NAC) in osteosarcoma and to explore the value of DCE-MRI for assessing the response to NAC.Methods
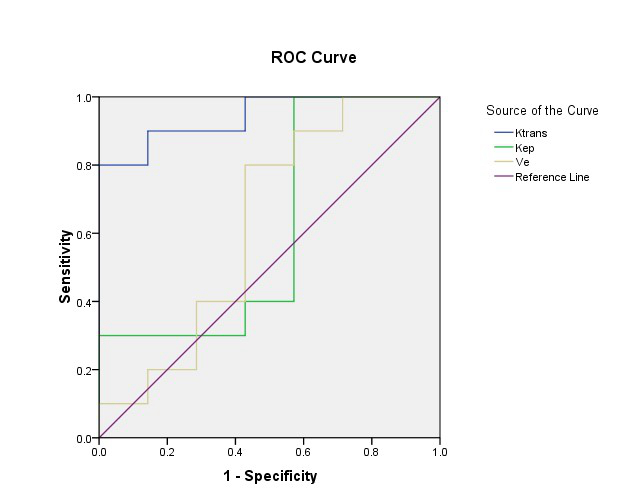
Seventeen patients with osteosarcoma were examined in this study. DCE and Magnetic resonance (MR) images were obtained from all patients before and after neoadjuvant chemotherapy. The quantitative pharmacokinetics parameters including Ktrans (volume transfer constant), Kep (reflux rate constant), and Ve (extravascular extracellular volume fraction) were calculated pre- and post-chemotherapy using two compartment Tofts Model by OmniKinetics software(GE Healthcare, China). The gross tumor volume was also calculated. The chemotherapeutic efficacy was been evaluated by using Holscher’s method. Accordingly, all lesions were divided into good response group and poor response group. Paired-samples T test was used to compare the perfusion parameters before and after chemotherapy. Independent-samples T test was applied to compare the perfusion parameters between the good and poor response group. Results There were ten cases with a good response to chemotherapy and seven cases with a poor response. For the good response group, MRI perfusion parameters (including Ktrans, Kep) were significantly decreased after neoadjuvant chemotherapy (P<0.05), but the Ve value has no statistical difference (P>0.05). There was no statistical difference (P>0.05) in Ktrans, Kep, and Ve pre- and post-chemotherapy for the poor response group. The grouping comparison before chemotherapy demonstrated that there was no statistical difference in all parameters between two groups (P>0.05). The grouping comparison after chemotherapy: Ktrans in the poor response group was higher than that of good response group (P<0.05); while Kep and Ve values between the two groups has no statistical difference (P>0.05). Ktrans demonstrated higher sensitivity (80%) and specificity (100%) in predicting chemotherapy response, with optimal threshold of 0.831min-1 and area under the curve (AUC) of 0.943 (P<0.05).Conclusion
The quantitative parameters of DCE-MRI change significantly before and after neoadjuvant chemotherapy in osteosarcoma lesion, which can be used to evaluate the effect of NAC in patients with osteosarcoma. Ktrans value showed higher sensitivity and specificity in predicting chemotherapy response.Acknowledgements
No acknowledgement found.References
[1] Niu X, Wang J, Sun Y, et al. Clinical practice guidelines for management of typical osteosarcoma[J]. Chin J Clin Tumor, 2012, 17(10):931-933.
[2] Holscher H C, Bloem J L, Woude H J V D, et al. Can MRI predict the histopathological response in patients with osteosarcoma after the first cycle of chemotherapy?[J]. Clin Radiol, 1995, 50(6):384-390.
[3] Bernstein J M, Homer J J, West C M. Dynamic contrast-enhanced magnetic resonance imaging biomarkers in head and neck cancer: Potential to guide treatment? A systematic review[J]. Oral Oncology, 2014, 50(10):963-970.
[4] Bergamino M, Bonzano L, Levrero F, et al. A review of technical aspects of T1-weighted dynamic contrast-enhanced magnetic resonance imaging (DCE-MRI) in human brain tumors[J]. Physica Medica, 2014, 30(6):635–643.
[5] Tofts P S. Modeling tracer kinetics in dynamic Gd-DTPA MR imaging[J]. J Magn Recon Imaging, 1997,7(1):91–101.
[6] Wu C, Jin J, Shi X, et al. Application of CT perfusion imaging in evaluating therapeutic efficacy for osteosarcoma [J]. Chin J Med Imaging Technol, 2011, 27(6):1272-1275.
[7] Zhen J, Wei X, Wang C, et al. Correlation of contrast-enhanced dynamic MRI imaging semi-quantitative parameters with tumor tissue hypoxia and intravascular generate [J]. Chin J Magn Reson Imaging, 2015. 6(8):613-617.
[8] Cho H, Ackerstaff E, Carlin S, et al. Noninvasive multimodality imaging of tumor microenvironment registered dynamic magnetic resonance imaging and positron emission tomography tudies of a preclinical tumor model of tumor hypoxia[J]. Neoplasia, 2009,11;247-259, 242p following 259.
[9] Pickles M D, Lowry M, Manton D J, et al. Prognostic value of DCE-MRI in breast cancer patients undergoing neoadjuvant chemotherapy: a comparison with traditional survival indicators[J]. Eur Radiol, 2014, 25(4):1097-1106.
[10] Li R, Gu Y, Peng W, et al. Role of the dynamic contrast-enhanced MRI in assessing the response to neoadjuvant chemotherapy of breast cancer [J]. China Oncol, 2016, 26(7):623-628.
[11] Ashraf A, Gaonkar B, Mies C, et al. Breast DCE-MRI Kinetic Heterogeneity Tumor Markers: Preliminary Associations With Neoadjuvant Chemotherapy Response[J]. Translational Oncology, 2015, 191(3):154-162.
[12] Alan J, O'Connor JPB, Parker GJM, et al. Imaging tumor vascular heterogeneity and angiogenesis using dynamic contrast-enhanced magnetic resonance imaging[J]. Clin Cancer Res, 2007, 13(12):3449-3459.
[13] Song Y, Ding S, Jia W. Experimental study on DCE-MRI evaluation of tumor angiogenesis[J]. Radiol Practice, 2014, 29(06):640-643.
[14] Kim S H, Lee J M, Gupta S N, et al. Dynamic contrast-enhanced MRI to evaluate the therapeutic response to neoadjuvant chemo-radiation therapy in locally advanced rectal cancer[J]. J Magn Recon Imaging g, 2014, 40(3):730-737.
[15] Tong MD, Yiqun Sun BS, Gollub MJ, et al. Dynamic contrast-enhanced MRI: Use in predicting pathological complete response to neoadjuvant chemoradiation in locally advanced rectal cancer[J]. J Magn Recon Imaging, 2015, 42(3):673–680.
[16] Kim J H, Chan K K, Park B K, et al. Dynamic contrast-enhanced 3-T MR imaging in cervical cancer before and after concurrent chemo-radiotherapy[J]. Eur Radiol, 2012, 22(11):2533-2539.
[17] Park J J, Kim C K, Park S Y, et al. Assessment of early response to concurrent chemo-radiotherapy in cervical cancer:value of diffusion-weighted and dynamic contrast-enhanced MR imaging[J]. J Magn Recon Imaging,2014,32(8):993-1000.
Figures