1603
Synthetic contrast optimization of bone metastases1SyntheticMR, Linköping, Sweden, 2Center for Medical Image Science and Visualization (CMIV), Linköping University Hospital, Linköping, Sweden
Synopsis
To achieve optimal contrast when imaging bone metastases, the patient would have to imaged multiple times at various contrast settings. This is not possible in practice, resulting in the use of standard contrasts that are often sub-optimal due to patient-specific variations in both healthy and metastatic tissue.
Using synthetic MRI, it is possible to synthesize a multitude of contrasts from a single scan. This makes it possible to determine optimal contrast weighing post-scan. Studying bone metastases, synthetic images where used to develop a mathematical model of perceived contrast, taking both tissue properties and the human visual system into account.
Purpose
To achieve optimal contrast when imaging bone metastases, the patient would have to imaged multiple times at various contrast settings. This is not possible in practice, resulting in the use of standard contrasts that are often sub-optimal due to patient-specific variations in both healthy and metastatic tissue.
The purpose of this study was to construct a mathematical model for synthetic contrast optimization of bone metastases. Since the optimization aims to improve perceived contrast, the properties of the human visual system must be considered. This model would provide optimal contrast for each individual subject without adding scan time, by determining the optimal echo time TE, repetition time TR and inversion time TI.
Methods
The synthetic images were created from quantitative MRI data of longitudinal R1 relaxation rate, transverse R2 relaxation rate and proton density PD. By determining these parameters for bone metastases and surrounding tissues it was possible to determine the signal, and thereby image intensities (color) of these tissues. The metastases were identified manually by placing ROI at the center of each lesion. The edges of the lesion were then automatically detected using the derivatives of the R1, R2 and PD for each slice. Up to 2 cm of the surrounding bone marrow was identified and its signal calculated based on R1, R2 and PD values. The optimization problem was created using the Massformel (Fechner), which is constructed based on the logarithmic properties of the human visual system. The Massformel is based on that the perceived size in image intensity is proportional to the logarithm of the numerical difference divided by the minimal perceivable numerical difference, which is usually 1-3 % of the initial stimuli. Normalized intensity differences, 0-1, were used so the minimal perceivable stimulus was set to 0.03. The optimization problem was constructed to contain visibility, how visible the metastasis is against the surrounding bone marrow, and detectability, how easy the lesion is to spot against the local image intensity.
Detectability: $$p_{d}(TE, TR, TI)=\ln\left( \frac{|S_{\text{mets}}(TE,TR,TI)-mean(Im(TE,TR,TI))|}{0.03 \times W(TE,TR,TI)}\right)$$
Visibility: $$p_{v}(TE,TR,TI)=\ln\left( \frac{|S_{\text{mets}}(TE,TR,TI)-S_{\text{marrow}}(TE,TR,TI)|}{0.03\times W(TE,TR,TI)}\right)$$
Cost function: $$C(TE,TR,TI)=\max_{p_d, p_v \in \mathbb{R}}A\times p_d+B\times p_v$$
W is window width, S is signal and A, B are constants.
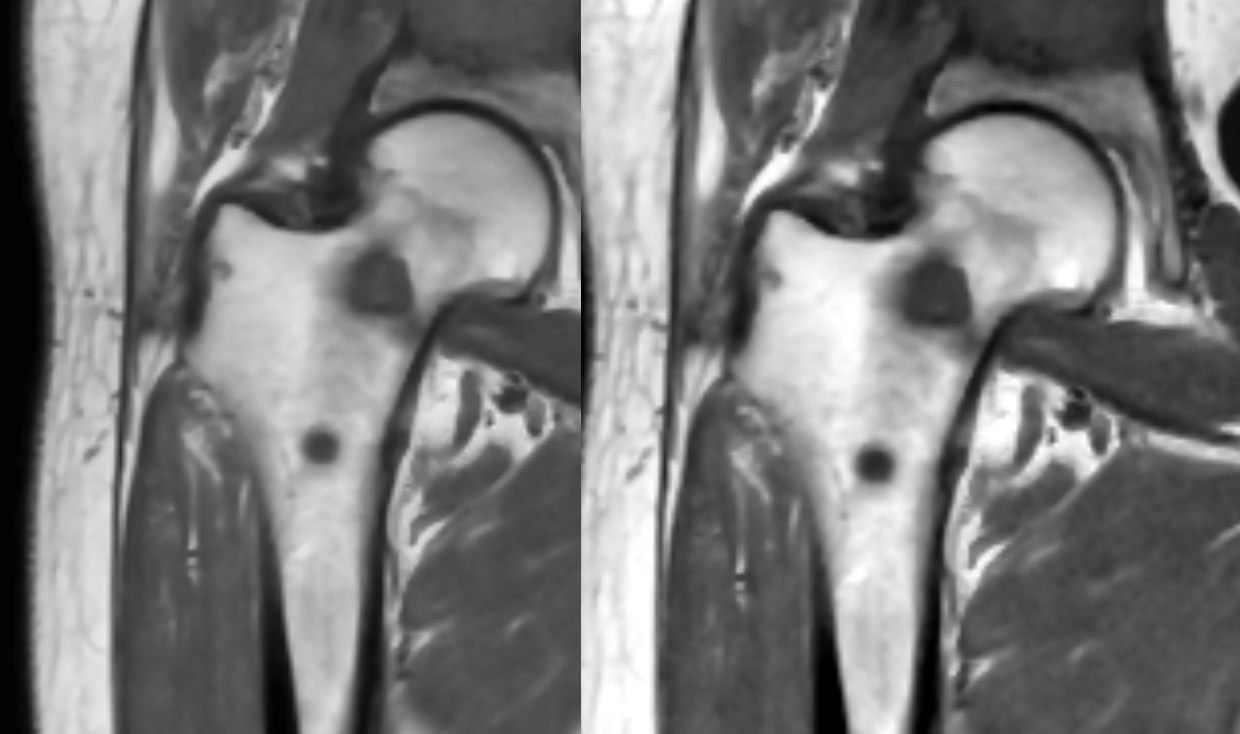
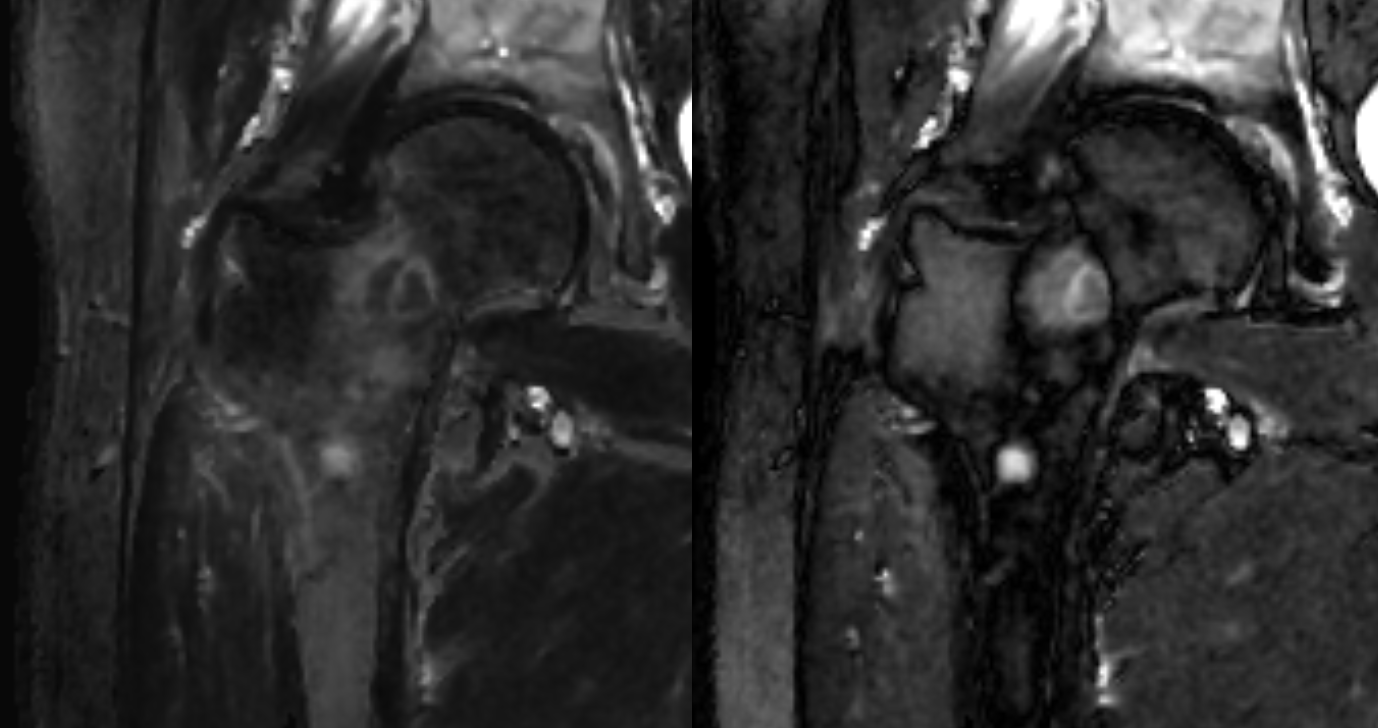
The contrasts considered were T1-weighted (T1W) and short tau inversion recovery (STIR). For STIR, TI was used to specifically cancel out the bone marrow next to the metastasis.
Results
The normalized contrast and between metastases and surrounding marrow:
$$$\begin{array}{lll} & T1W: & STIR: \\ \text{Standard settings}: &0.51 \pm 0.43 & 0.50 \pm 0.57 \\ \text{Optimal settings}: &0.74 \pm 0.23 & 0.71 \pm 0.39 \end{array}$$$
Using optimal settings improved the contrast by 82$$$\pm$$$85%. The improvement varied depending on how close the optimum was to the standard contrast. The optimal settings for T1W were similar but not identical between subjects. For STIR, some optima were T2-weighted while other where PD-weighted. Most notable influencing factors where the constitution of the metastases and the proton density of the surrounding bone, as well as the overall presence of fatty tissue and fluids in the image. The T1W optimum were found at TE = 5 ms and the STIR optimum were found at TR = 15 sec.
Discussion
Visibility is a subjective term. The preferred weighting of the cost function may vary between individuals. The window was placed to be wider than the difference between the two contrasts, so the maximal achievable contrast was smaller than 1. The contrast is highly dependent on window placement.
The optima where located at settings not commonly used conventional imaging. Using synthetic contrast, it was possible to examine a wider range of contrast.
This model was developed for bone metastases but the concept can be generalized to work for any pathology, as well as other contrast weightings, assuming conditions for visibility can be set.
Conclusion
Using synthetic MRI, it is possible to mathematically define visibility and optimize image contrast on a case-by-case basis.Acknowledgements
Prof. Taro Takahara is acknowledged for providing image material and valuable input to the analysis.References
1. West J, Blystad I, Engström M, Warntjes MJB. Application of Quantitative MRI for Brain Tissue Segmentation at 1.5 T and 3.0 T Field Strengths. United States: Public Library of Science, 2013;8(9).
2. Fechner G T. Elemente der Psychophysik band 2. Leipzig: Breitkopf und Härtel; 1860.
Figures