1602
Intervertebral disc heterogeneity decoded with MRI histogram analysis1Dept. of Medical Physics and Techniques, Sahlgrenska University Hospital, Gothenburg, Sweden, Sahlgrenska University Hospital, Gothenburg, Sweden, 2Institute of Clinical Sciences, Sahlgrenska Academy, University of Gothenburg, Gothenburg, Sweden, 3Dept of Radiology, Sahlgrenska University Hospital, Gothenburg, Sweden, 4Dept of Orthopaedics, Sahlgrenska University Hospital, Gothenburg, Sweden
Synopsis
Low back pain has major consequences for both the individual as well as for the society which often results in sick leave from work. Unfortunately, health care today lacks diagnostic techniques and procedures necessary to select and treat patients who would most benefit from treatment. Histogram analysis based on MRI imaging has the potential to display disc heterogeneity and possibly depict painful discs. A total of 98 histograms of 49 intervertebral discs were generated based on three mid-sagittal slices of high quality T2W MRI images and T2-maps. Using MATLAB, a two component Gaussian mixture distribution model was fitted to the histogram data in order to retrieve disc heterogeneity measures. Mann-Whitney U-test displayed a significant difference in disc heterogeneity measures with increased Pfirrmann grade.
Purpose
Intervertebral discs (IVDs) exhibit strong intra- and inter-patient heterogeneity. The IVD heterogeity can be displayed visually in T2-maps or T2-weighted (T2W) images as regional variation in the pixel grey scale. Histograms may be have the feasibility to display regional variations in IVD heterogeneity related to lumbar pain that are not directly visible in the T2-maps or in T2W images. This work examines the feasibility of histograms to decode IVD heterogeneity with purpose to find new markers of pain in patients with low back pain (LBP).Methods
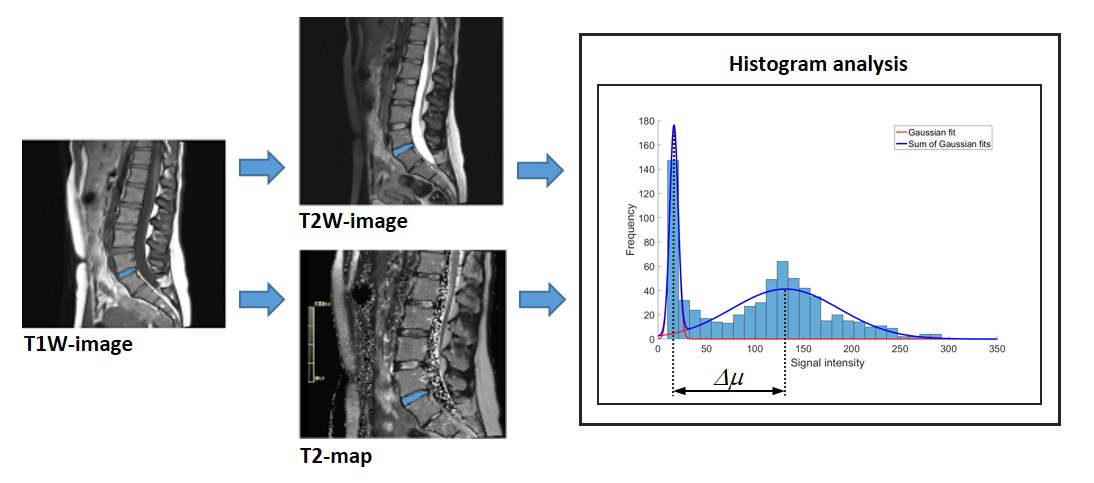
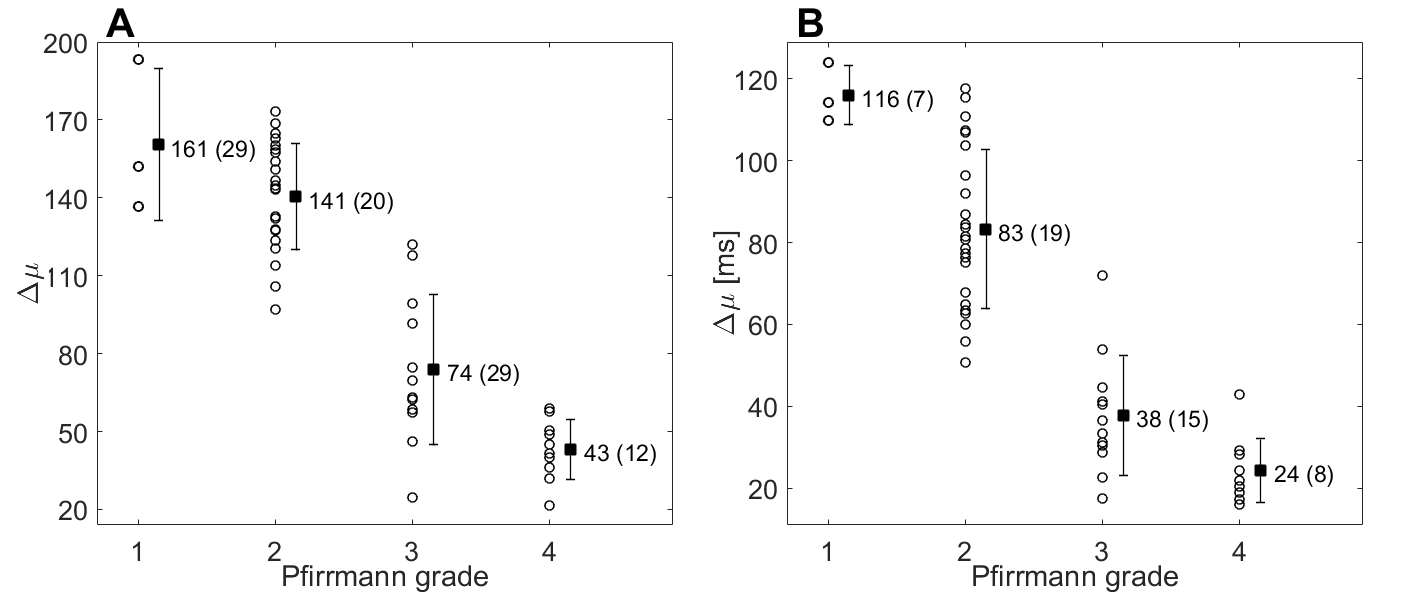
Ten LBP patients (6 males, 25-69y, 49 discs) were examined with T2-mapping, and with T1W and T2W MRI (sagittal, slice=3.5mm, pixel<1mm) on a 1.5T scanner. Post procession of the images was performed using MATLAB software R2016a (Mathworks®, Massachusetts, U.S.A.). Each IVD was semi-automatically segmented on three mid-sagittal morphological T1W-images (Figure 1). The segmented “regions of interest” (ROIs) were transferred and rescaled to match the corresponding T2W-image and T2-map to produce grey scale distributions, i.e. histograms, of the pixel values within the ROIs . A Gaussian mixture distribution model with two components was fitted to the data of each histogram find peak data within the histogram. Heterogeneity features of the IVDs, such as the histogram shape and the separation between the high and low histogram peaks, were then extracted from the histograms. The histogram peak separation was correlated with Pfirrmann grade to find continuous markers of IVD degeneration. Mann-Whitney U-test was performed to examine whether the correlation was statistically significant (p<0.05 was considered significant).Results
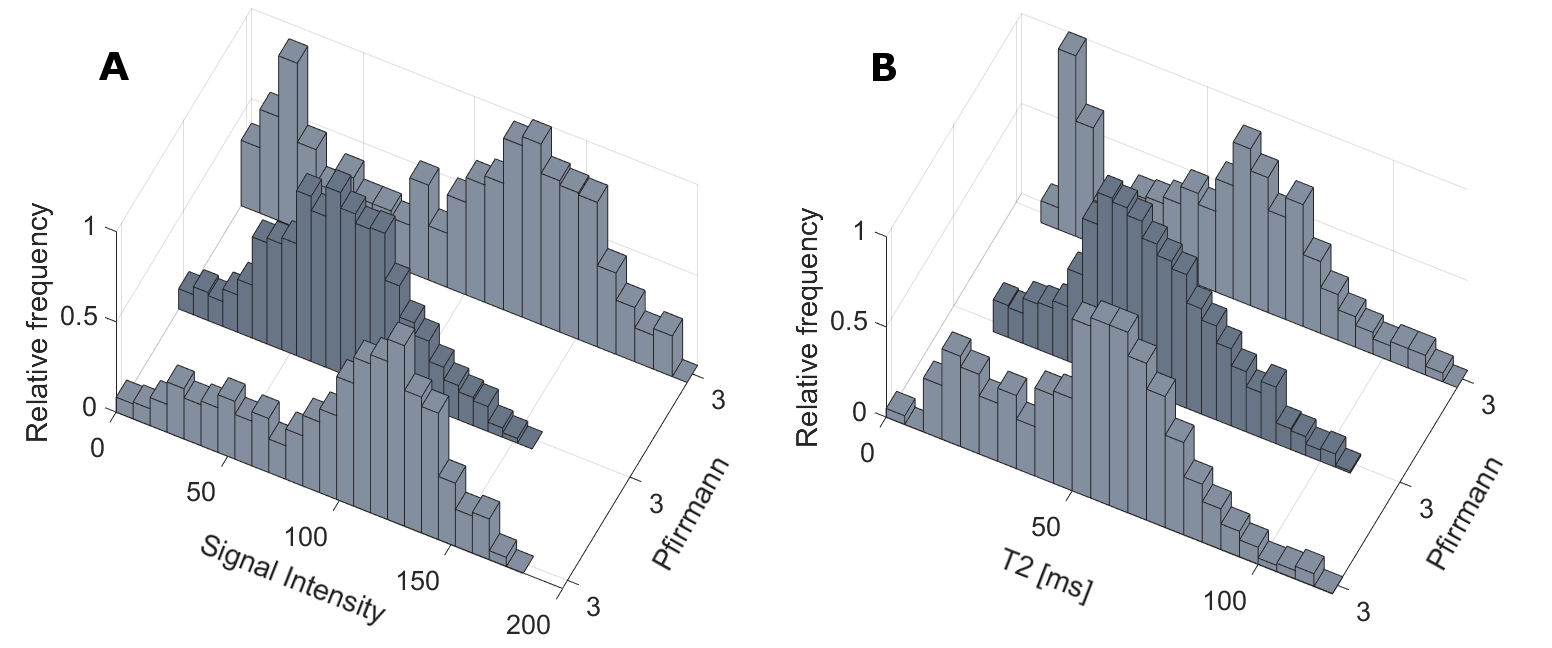
Both the T2-maps and T2W-images displayed similar histogram features (Figure 2). Histograms of well hydrated IVDs displayed two well separated peaks, one with low grey scale values from annulus fibrosis (AF) and one with high grey scale values from nucleus pulposus (NP). In histograms of degenerated IVDs, the distinction between AF and NP was reduced. This was displayed by incresed number of pixels with intermediate grey scale values and decresed peak separation. The histogram peak separation was shown to correlate strongly with Pfirrmann grade 2 to 4 (p<0.05 for all groups; Figure 3). In addition, some degenerated IVDs within the same Pfirrmann grade displayed diametrically different histogram appearances (Figure 4).Discussion
Decoding of the IVD heterogeneity with histogram analysis is feasible, not only with T2-mapping but also with conventional T2W-imaging. Since histogram features automatically display quantitative and continuous data that correlate well with IVD degeneration, it is a useful tool for detailed characterization of degenerative IVD changes. In contrast to Pfirrmann grading that includes IVDs with diametrically different heterogeneities in each grade, histogram analysis objectively can depict differences in IVD features, not only between different Pfirrmann grades but also within each grade. Thus, histogram analysis appears to be a sensitive tool for tissue characterization. To elucidate if histogram analysis can serve as a clinical tool depicting painful IVDs, larger studies correlating histogram features with LBP are warranted.Conclusion
This study shows that decoding disc heterogeneity is feasible with histogram analysis and that histogram analysis is a promising tool to find new markers of pain for patients with LBP. Further larger studies are warranted to indicate whether such heterogeneity markers can improve patient management.Acknowledgements
No acknowledgement found.References
No reference found.Figures