1601
Quantitative study of longitudinal distribution of fat fraction in the lumbar spine1Peking University Third Hospital, Beijing, People's Republic of China, 2GE Healthcare, MR Research China, People's Republic of China
Synopsis
The aim of this study was to explore the fat fraction(FF) variation of inter and intra vertebral bodies in the lumbar spine, by using water-fat imaging. In lumbar spine, L1 and L2 vertebras demonstrated lower FF level but with more common ‘margin higher’ FF distribution pattern comparing to other vertebras, which might be related to stress and activities of the vertebra. We suggested that FF distribution pattern indicate certain skeletal remodeling that affects bone strength, which may be a promising indicator in assessing prevalent fracture besides the increased average FF of the whole vertebral body.
Purpose
The fat fraction(FF) of vertebrae is known to vary according to age and anatomical site, however the spatial variability of fat distribution within individual vertebrae body(VB) remains unfolded due to the limitation of technology[1]. The aim of this study was to explore the FF variation of inter and intra VBs in the lumbar spine and its changes with age, by using water and fat separation method.Material and Methods
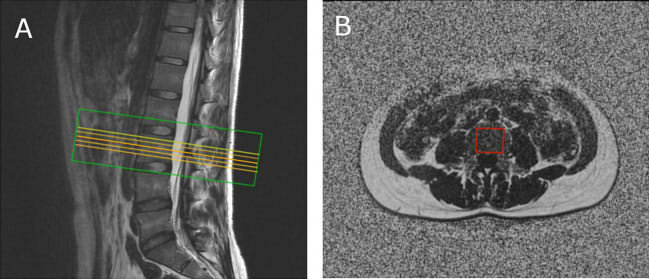
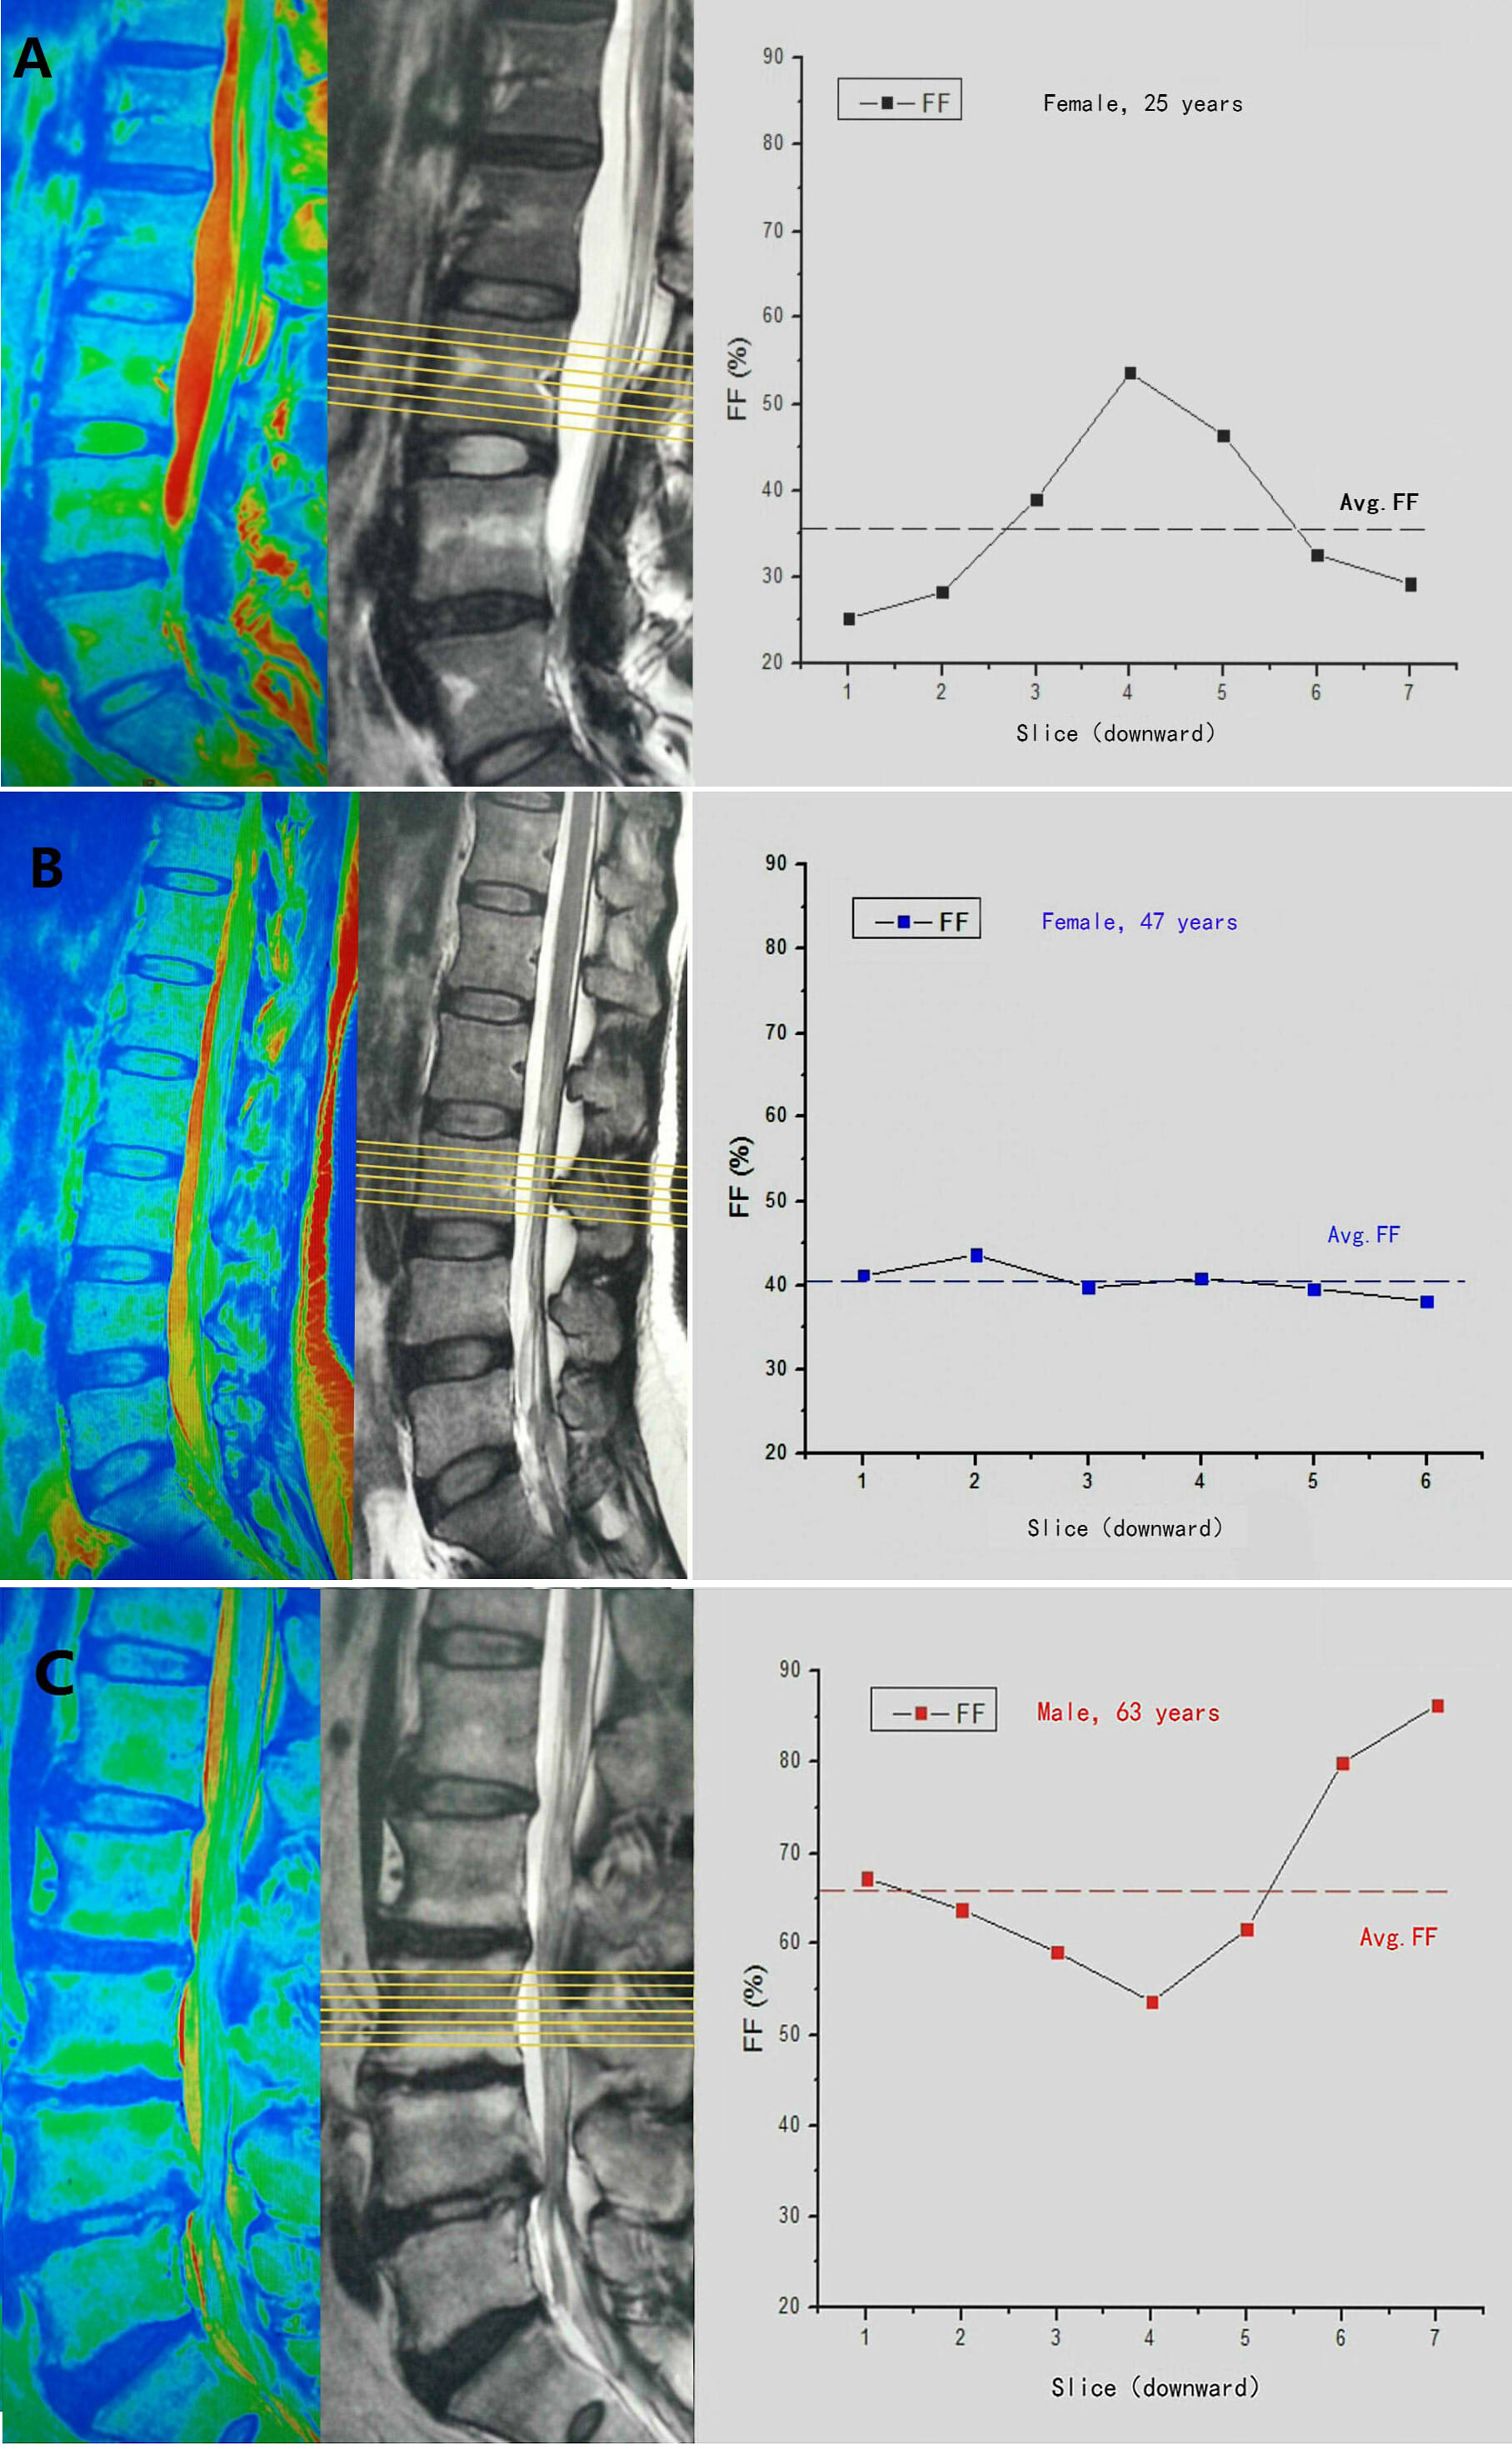
Ninety-seven healthy volunteers (51females and 46 males, age ranging from 22 to 69 years old) were recruited in the current study. All the subjects underwent IDEAL IQ acquisition for L1-L5 vertebras on a 3.0T MR scanner (MR750, GE Healthcare, US). The vertebras were scanned on the axial plane respectively with 3mm slice thickness. The original images were post-processed on GE workstation to achieve the maps of fat fraction. The two slices adjacent to the endplates of each VB were removed to avoid volume effect, and the FF of each remaining slice was obtained by drawing a 20×20mm2 region of interest (ROI, Figure.1). Therefore, the average FF (Avg.FF) of the left slices in each VB was calculated, where 5-7 slices were selected according to the effective height of VB. There were certain patterns observed for the distribution of FF in individual VB (Figure.2). Fat Fraction Variability Index(FFVI) was achieved from the data. FFVI is a novel parameter that was calculated on basis of the equation: FFcenter - FFedge, where FFcenter referred to the FF of the vertebral center, and FFedge referred to the average FF of two vertebral edges. Vertebral center was identified as the middle one slice in VB for odd slices left VBs or the middle two slices in VB with even slice left. Descriptive statistics analysis was conducted on the obtained Avg.FF and FFVI from different age groups. The univariate analysis of variance was performed with Avg.FF and FFVI set as the respective dependent variables, while the age groups (20-29, 30-39, 40-49, 50-59, and 60-69 years) and VB(L1 to L5) as the independent variables. P <0.05 was considered as statistical significance.Results
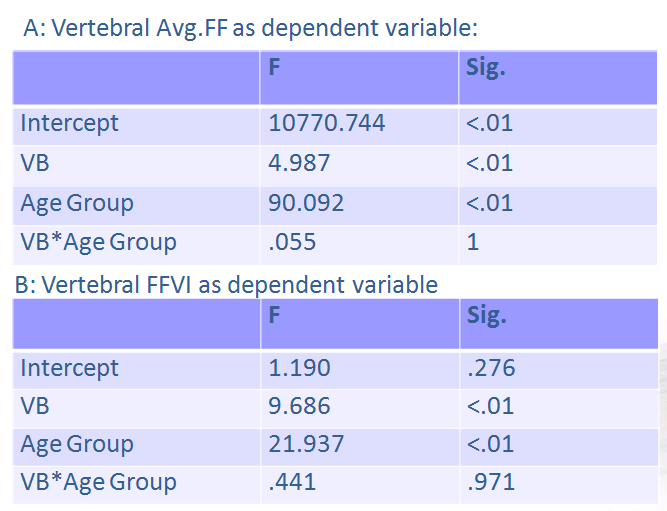
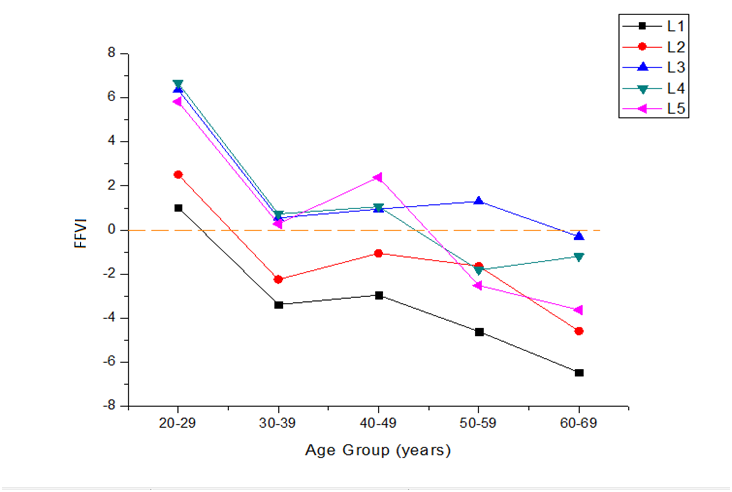
Both age and VB affected the dependent variables significantly (P<0.01), however, there was no interaction effect between VB and age (P>0.05, Table.1A and 1B). The Avg.FF of VB demonstrated a slight increase from L1(20%-60%) to L5(30%-70%) vertebrae. Inter-comparison of univariate test of vertebral Avg.FF depicted significant difference between L1 and L3, L4, L5 VBs, and between L2 and L5 VBs, respectively. The whole FF level increased with age from 20s (20%-40%) to 60s (50%-70%), while the slight gradient of FF from L1 to L5 VBs remained unaffected. Inter-comparison of univariate test of vertebral FFVI depicted significant difference between L1 and L3, L4, L5 VBs, and between L2 and L3, L4 VBs, respectively. FFVI of L1-5 VB commonly started with a positive value in 20s (1.0-5.95) and gradually converted to negative values with age (-6.48 to -0.47 in 60s), indicating the FF distribution pattern converted from ‘center higher’ to ‘margin higher’ with age growth. Such transformation initially started at L1 and L2, then L4 and L5, and eventually, L3( Figure.3).Discussion
Bone marrow fat fraction represents the radio of fat to water-plus-fat, inferring the proportion of hematopoietic (red) and fatty (yellow) marrow components. Marrow FF is considered to relate to the marrow quality and the remodeling capacity of the bone, both of which may implicate osteoporosis[1]. FF of the vertebral body has been recognized to vary with age and anatomical segment, which can also be affected by many other factors [2]. However, neither Avg.FF nor FFVI can reflect the vertebral FF distribution comprehensively. In lumbar spine, L1 and L2 vertebras demonstrated lower FF level but with more common ‘margin higher’ FF distribution pattern comparing to other vertebras, which might be related to stress and activities of the vertebra. Considering that compression fracture is also more commonly observed in L1, L2 vertebras, we suggested that FFVI indicate certain skeletal remodeling that affects bone strength. Hence, FFVI may be a promising indicator in assessing prevalent fracture besides the increased average FF of the whole vertebral body.Conclusion
There were observed variations in FF distribution along the longitudinal axis of the lumbar spine, which may relate to the stress and activities of the vertebra. The current study has provided significant information for further investigation on vertebral marrow health.Acknowledgements
No acknowledgement found.References
[1] Liney G P, et al. Journal of Magnetic Resonance Imaging, 2007, 26(3):787–793.
[2] M. Kawai, et al. Journal of Internal Medicine, 2012, 272(4):317–329.
Figures