1600
Bone marrow iron assessment using quantitative susceptibility mapping in iron overload rabbit model1Department of Radiology, Seoul St.Mary's Hospital, College of Medicine, The Catholic University of Korea, Seoul, Korea, Republic of
Synopsis
The aim of our study was to assess the feasibility of quantitative susceptibility mapping (QSM) as a tool to quantify bone marrow iron level non-invasively. Nine rabbits were scanned before and after iron accumulations, and bone marrow susceptibility values of these rabbits were evaluated from the reconstructed QSM images. The results showed a linear correlation between the measured susceptibility changes and the injected iron doses.
Purpose
Iron overload (hemochromatosis) is a serious medical condition that in which accumulated iron leads to toxic effects on vital organs.1,2 Therefore, surveillance of iron levels in patients predisposing to iron overload is crucial for timely initiating the chelating therapy. Despite the clinical use of serum ferritin level as an indirect marker of iron level, the direct quantification of iron overload is only possible with bone marrow biopsy. Recently, quantitative susceptibility mapping (QSM) has been suggested as a non-invasive iron assessment tool for several organs such as brain and liver.3,4 The aim of our study was to assess the feasibility of QSM as a tool to quantify bone marrow iron level non-invasively in an iron overload rabbit model.Methods
Nine male New Zealand White rabbits weighing 2.8 to 3.2 kg were used in this study. Anesthesia was induced by intramuscular injection of 0.3 mL/kg of zoletil (tiletamine hydrochloride plus zolazepam hydrochloride; Virbac) and 0.2 mL/kg of rompun (xylazine; Bayer). Then, a 24-gauge angio catheter was introduced into the marginal vein of the ear. Immediately after the baseline MR scan, iron accumulation was induced by using intravenous injection of Prolongal 100 mg Fe/mL (Ferric hydroxide-dextran;Beyer). A series of total iron was injected with doses of 50,150, 200, 250, 300, 500, 600 (mg Fe). A total iron doses higher than 300mg were separately injected with one week intervals. All the rabbits were scanned in one week after completion of iron injection. For QSM reconstruction, 3D multi-echo GRE was acquired at 3T clinical scanner (Verio, Siemens) with a 12 channel phase-arrayed coil. Imaging parameters were as follows: TR = 18 ms, number of echoes = 5, first TE = 2.6 ms, echo spacing = 2.6 ms, flip angle =10 °, R = 2 for GRAPPA, 0.75 mm isotropic voxel, NEX = 5, total scan time = 13 min.
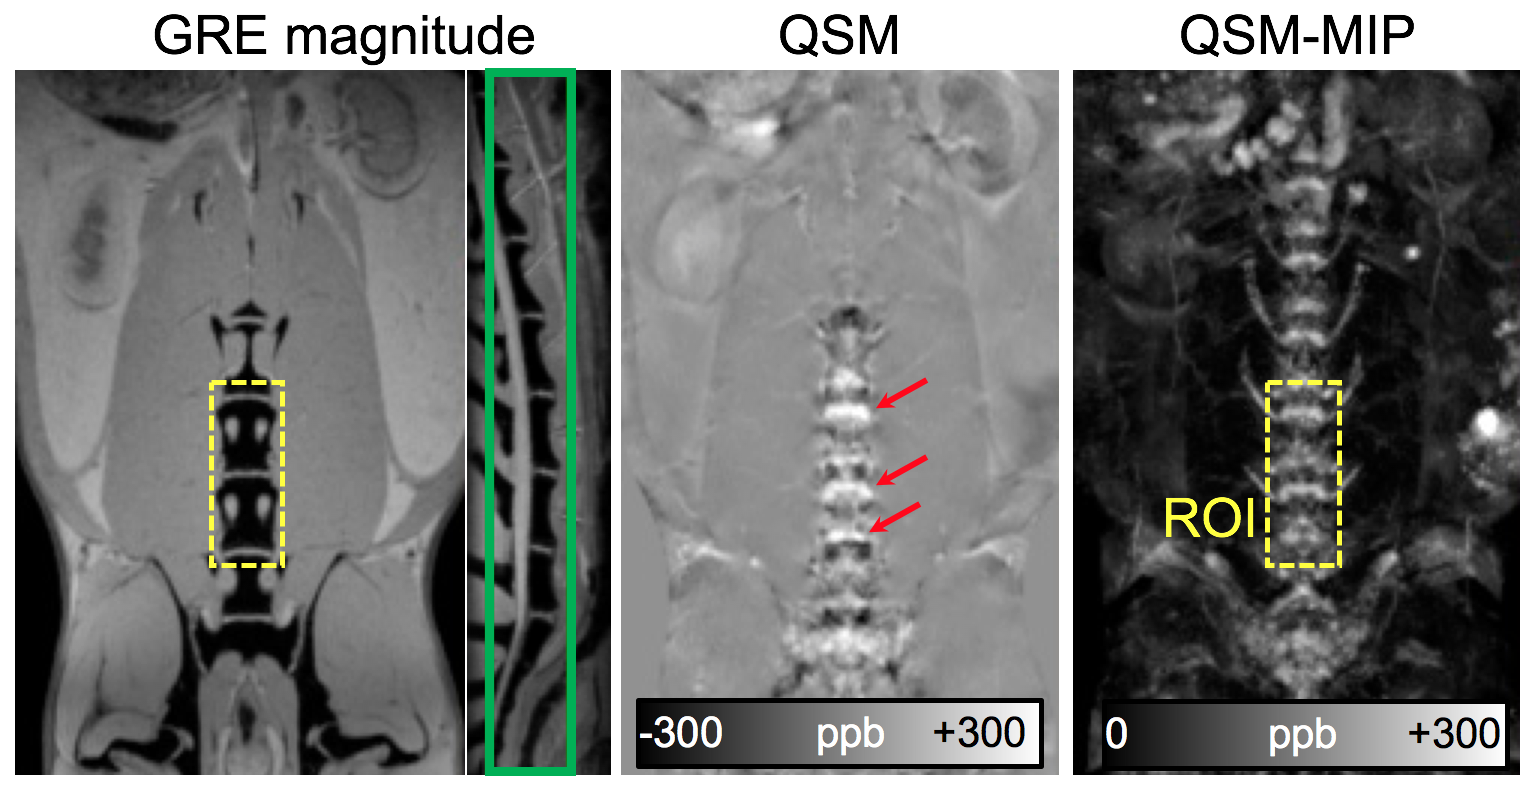
QSM was reconstructed using an iLSQR method5 from the reconstructed complex data. For a longitudinal comparison, quantitative analysis was performed from a manually drawn region of interest (ROI). To minimize errors from a subjective ROI drawing, a single ROI covering two marrow levels was manually drawn on a maximum intensity projected QSM (QSM-MIP) image (yellow dotted box in Fig.1). In this step, MIP was performed from 24 mm thickness of stacked slices covering the entire marrow regions but excluding common iliac veins, which have high paramagnetic susceptibility values (green box in Fig. 1). A Pearson's correlation coefficient was calculated between the injected iron doses and the ROI QSM differences of the two scans.
Results
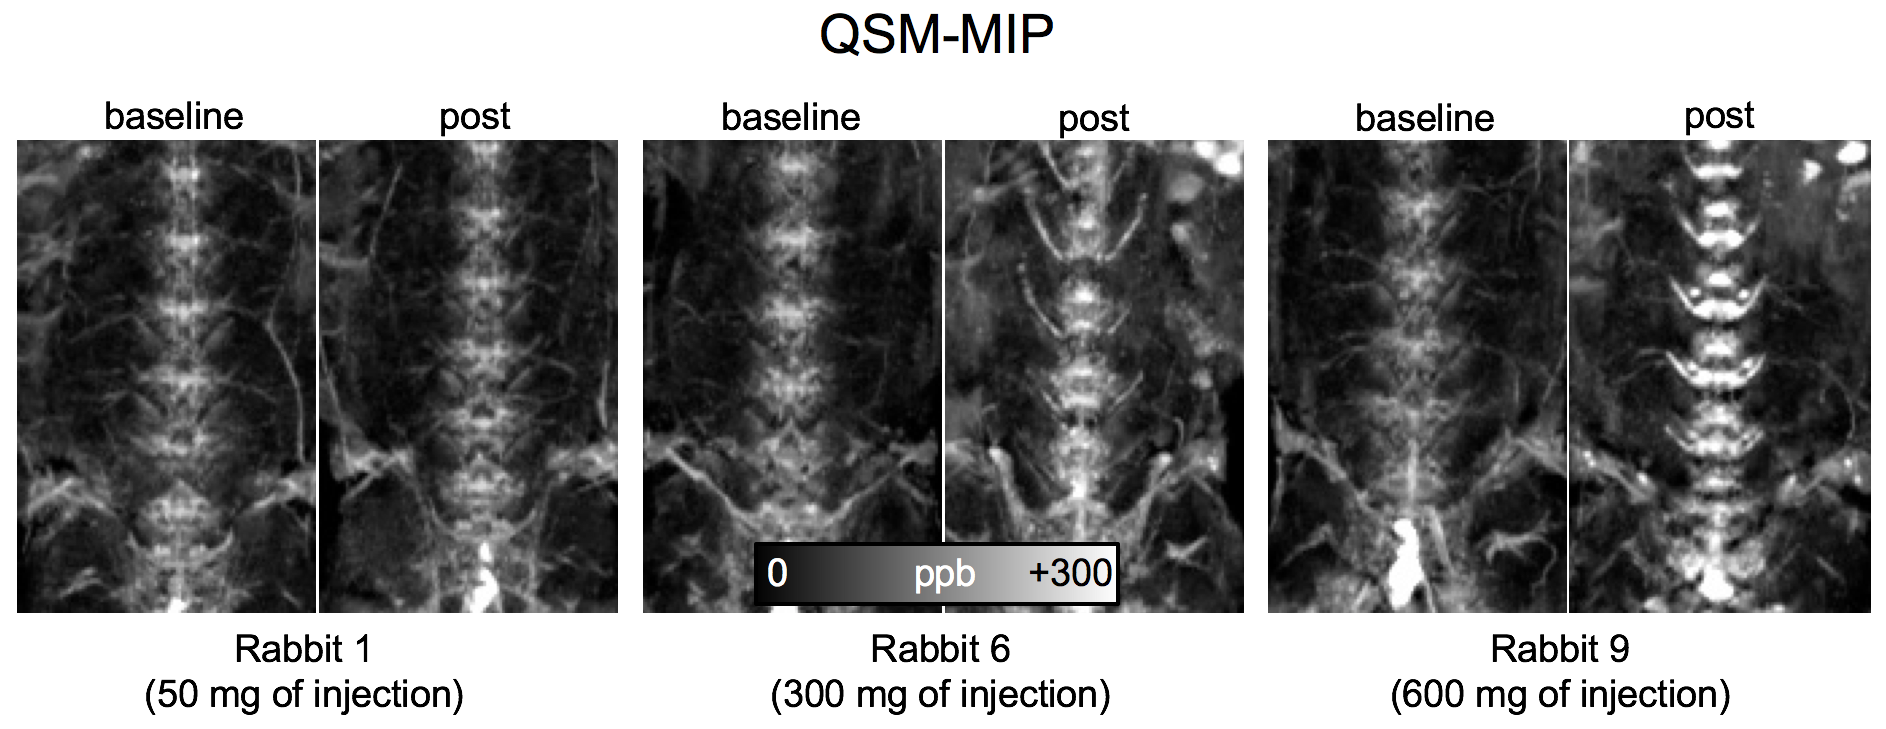
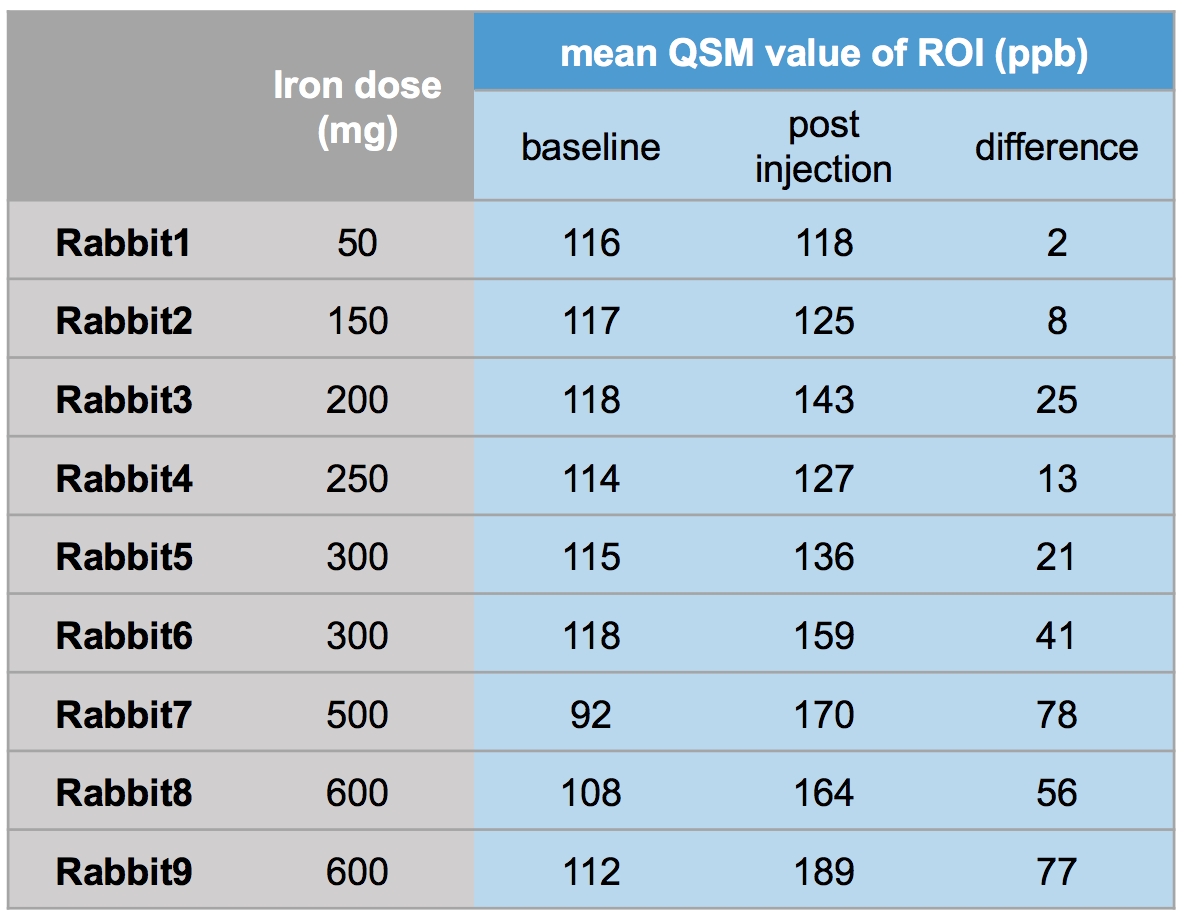
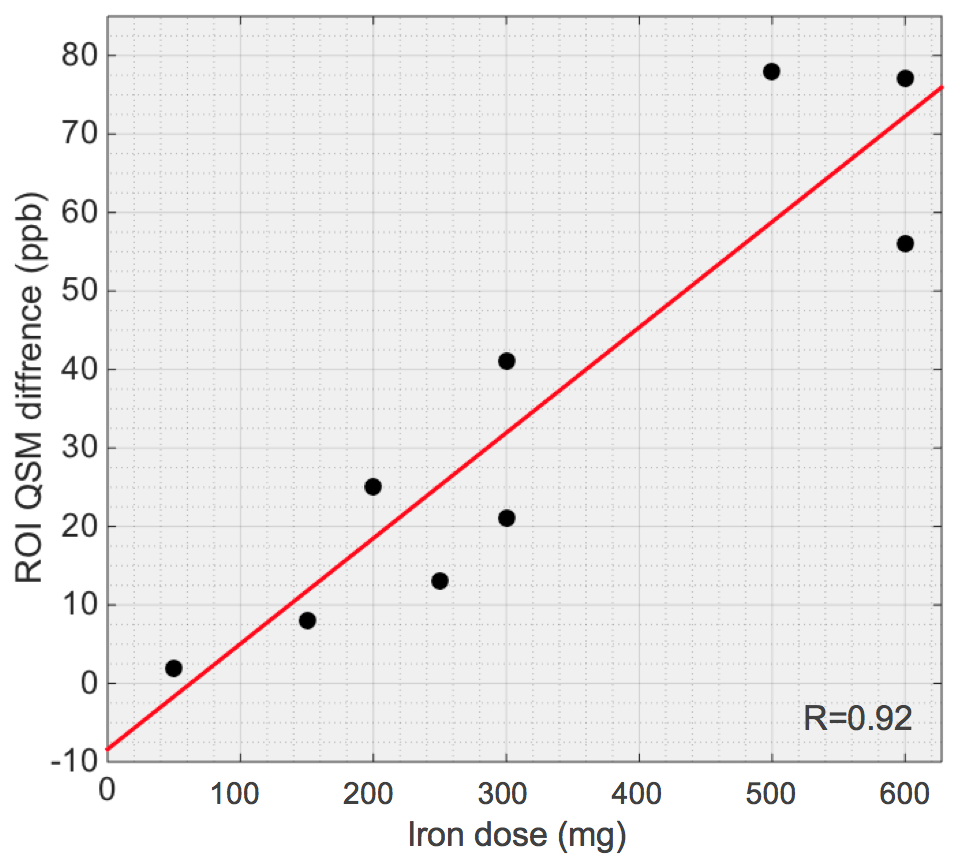
Figure 1 shows the resulting magnitude, QSM and QSM-MIP images from a rabbit with severe iron overload (500 mg dose). Although bone marrow shows noise level signals in magnitude image, QSM reveals high paramagnetic values in the marrow regions (arrows in Fig. 1). In QSM-MIP images from the different rabbits, noticeable differences were observed across the rabbits after iron injections (Fig. 2). Figure 3 summarizes ROI mean values measured from QSM-MIP images. The ROI QSM difference between the baseline and the post-injection shows a linear correlation (r=0.92) with the injected iron doses (Fig. 4).Discussion
We observed a linear correlation between the injected iron dose and the measured magnetic susceptibility in iron overload rabbit models. The results demonstrated the clinical potential of QSM as a non-invasive bone marrow iron quantification. For further validations, the correlation between the magnetic susceptibilities and the actual iron accumulations in the bone marrows based on the histochemical analysis should be demonstrated.Acknowledgements
This research was supported by Basic Science Research Program through the National Research Foundation of Korea (NRF) funded by the Ministry of Science, ICT & Future Planning (2014R1A1A1038210).References
1. Queiroz-Andrade M, Blasbalg R, Ortega CD, et al. MR imaging findings of iron overload. Radiographics. 2009;29(6):1575-89.
2. Papakonstantinou O, Alexopoulou E, Economopoulos N, et al. Assessment of iron distribution between liver, spleen, pancreas, bone marrow, and myocardium by means of R2 relaxometry with MRI in patients with beta-thalassemia major. J Magn Reson Imaging. 2009;29:853-9.
3. Langkammer, C., Schweser, F., Krebs, N., Deistung, A., Goessler, W., Scheurer, E., et al. (2012). Quantitative susceptibility mapping (QSM) as a means to measure brain iron? A post mortem validation study. NeuroImage, 62(3), 1593–1599.
4. Sharma, S. D., Hernando, D., Horng, D. E., & Reeder, S. B. (2014). Quantitative susceptibility mapping in the abdomen as an imaging biomarker of hepatic iron overload. Magnetic Resonance in Medicine, 74(3), 673–683.
5. Li, W., Wang, N., Yu, F., Han, H., Cao, W., Romero, R., et al. (2015). A method for estimating and removing streaking artifacts in quantitative susceptibility mapping. NeuroImage, 108, 111–122.
Figures