1599
Non-Gaussian water diffusion kurtosis imaging and T2* mapping of Intervertebral Disc Degeneration at 3T MR1Radiology, Renmin Hospital of Wuhan University, Wuhan, People's Republic of China, 2GE healthcare China
Synopsis
To assess the feasibility of detecting early biochemical changes of nucleus pulposus (NP) in intervertebral disk degeneration (IVDD) by diffusion kurtosis imaging (DKI), and compare mean kurtosis (MK) and T2* mapping in IVDD according to Pfirrmann grades. Twenty individuals underwent lumbar sagittal T2-weighted image, DKI and T2* mapping. DKI related parameters—mean kurtosis (MK) and T2* values were measured. The differences between MK and T2* value in NP were highly significant. Pfirrmann grades were inversely significantly correlated with T2* values in the NP, and positively correlated with MK values, especially between Pfirrmann grade II ,III and Ⅳ.
Purpose
Intervertebral disc degeneration (IVDD) is a major health problem in middle-aged and elderly groups and its development is trending to the younger age group. Quantitative biomarker is hence in need for early diagnosis of IVDD. T2* relaxation rate reflects the spatial macromolecule architecture in conjunction with water molecule mobility [1] and has been reported as a reliable tool for quantitative assessment of various cartilaginous tissues. On the other hand, diffusion imaging reflects the level of water molecule diffusion under the influence of diffusion gradients and reflects the micro-structure of tissues. Diffusion kurtosis imaging (DKI) further adapts a non-Gaussian diffusion model and was shown to better characterize the tissue microstructure functions [2]. In this work, the use of T2* and DKI are compared in detecting IVDD at early stages.Method
We recruited 20 asymptomatic adults (10 men and 10 women), with a mean age of 32.60±13.98 years (range,20-50 years). The volunteers were enrolled in this ethic committee approved study, and a total of 100 lumbar discs were examined. The lumbar discs were classified according to the conventional Pfirrmann grade system[3] into Pfirrmann I-IV grades as a marker of IVDD. All the participants underwent MR exams that included concentional T1WI, T2WI anatomical imaging as well as T2* mapping and DKI imaging. T2* map and DKI metrics were then processed using the Omni Kinetics software (GE life science, USA). Three ROIs were placed on the mean kurtosis (MK) and T2* maps of nucleus pulposus (NP) and the averaged measurements were used. Kruskal-Wallis test was applied to compare the difference in MK and T2*values of various disc degeneration grades of NP .Associations between MK value, T2* relaxation time and Pfirrmann grade were tested using Spearman rank correlation.Results
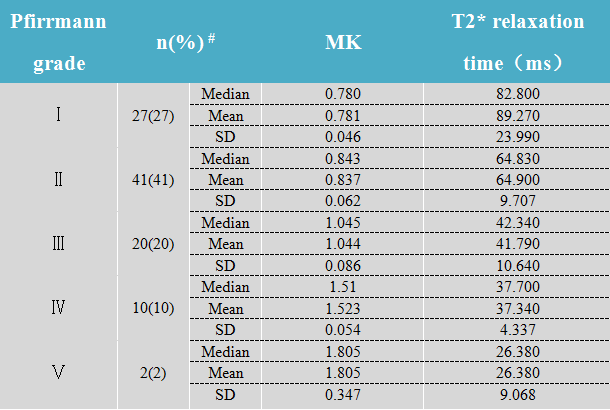
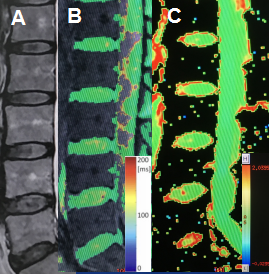
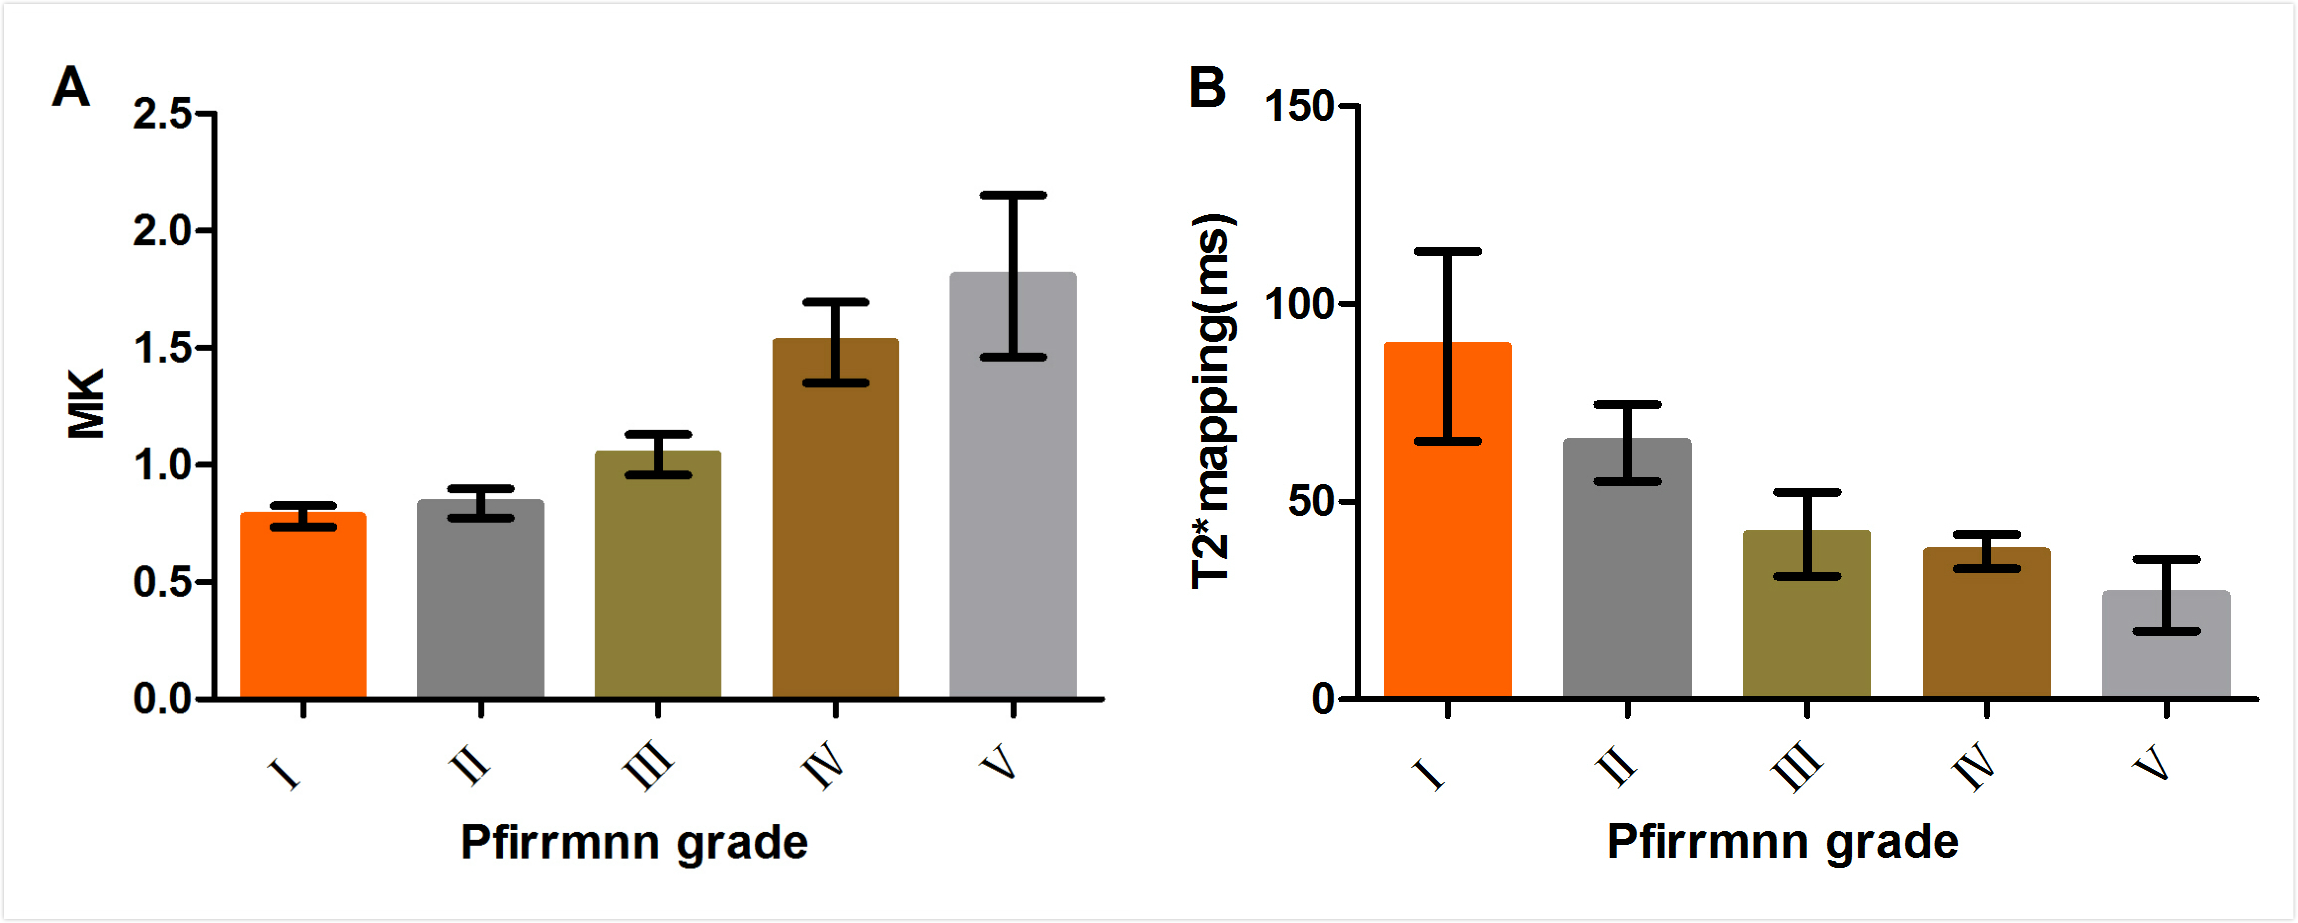
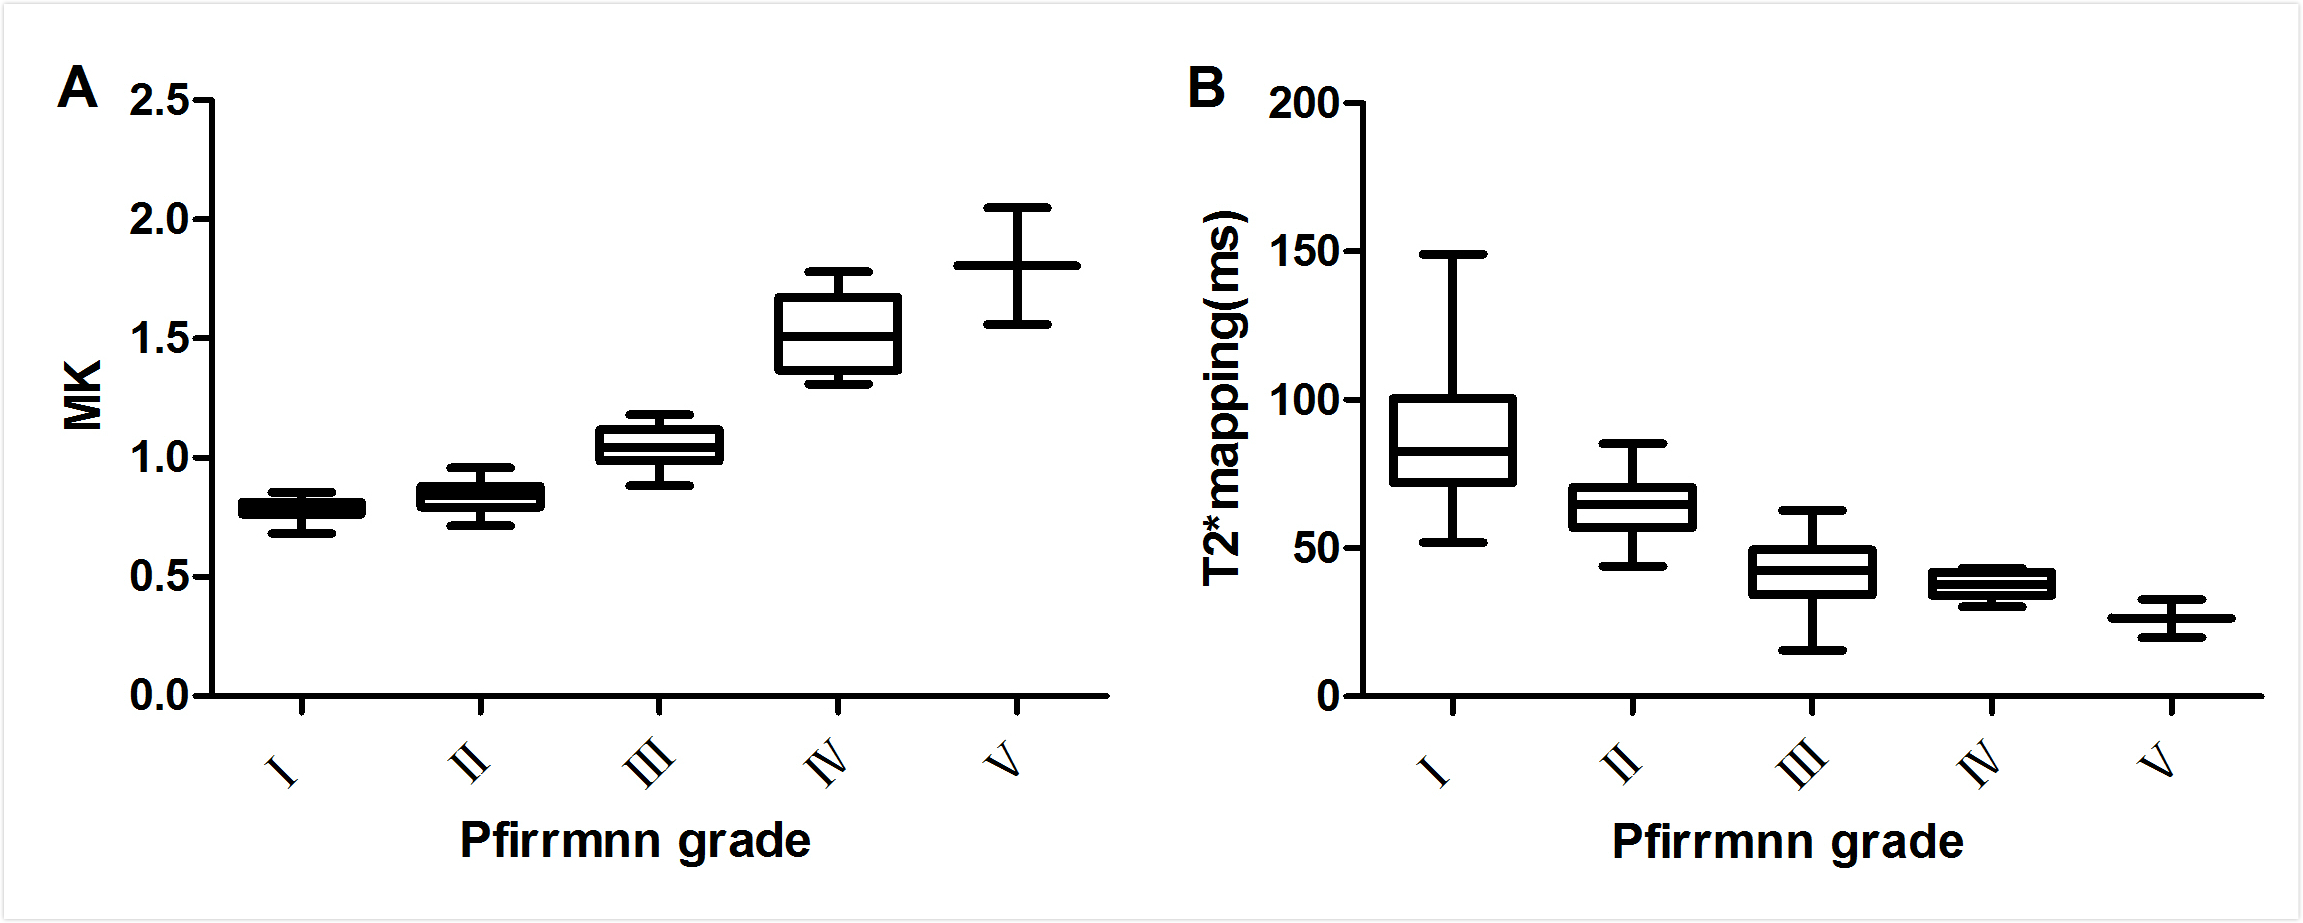
A total of 20 subjects with 100 intervertebral lumbar disks from L1-2 to L5-S1 were included in this study. The T2WI, T2* and MK maps of a representative subject are shown in Figure 1. The distribution of the MK and T2* values of NP with respect to the Pfirrmann grading is shown in Table 1 and Figure 2. The differences between MK and T2* values in NP were statistically significant (P<0.001). Pfirrmann grades were inversely correlated with T2* values (Figure 3B) in the NP (r=–0.51, P<0.001) and positively correlated with MK (Figure 3A) values (r=0.55, P<0.001), especially between Pfirrmann grade II ,III and Ⅳ(P<0.001).Discussion
In this study, the use of T2* map and DKI derived metrics were used and compared as biomarkers of IVDD. Statistically significant correlations were observed between MK, T2* relaxation rates and the Pfirrmann grades. In addition to the previously reported T2*, MK from DKI was seen to be a viable biomarker of IVDD, due to altered microstructures. However, similar performance was seen between MK and T2* in differentiating different grades of IVDD, and more detailed comparison would require further study with a larger cohort, and perhaps with diffusion models such as intravoxel inhoherent motion. Nevertheless, quantitative metrics such as investigated in this study shows great promise for early detection and grading of IVDD as compared to qualitative inspections.Acknowledgements
I would like to acknowledge my gratitude to my graduate study supervisor,Professor Yun fei Zha.References
[1].Ellingson AM, Mehta H, Polly DW et al: Disc degeneration assessed by quantitative T2* (T2 star) correlated with functional lumbar mechanics. Spine (Phila Pa 1976), 2013; 38: E1533-40.
[2].Jensen JH, Helpern JA, Ramani A, Lu H, Kaczynski K. Diffusional kurtosis imaging: the quantification of non-gaussian water diffusion by means of magnetic resonance imaging. Magn. Reson. Med. 2005; 53(6): 1432-1440.
[3].Pfirrmann CW, Metzdorf A, Zanetti M, et al. Magnetic resonance classification of lumbar intervertebral disc degeneration[J]. Spine (Phila Pa 1976),2001,26(17): 1873 - 1878.
Figures