1598
Perfusion and Fat Content of Lumbar Vertebral Body: Global and Regional Analysis1Department of Nuclear Medicine, Chang Gung Memorial Hospital, Taoyuan, Taiwan, 2Program of Electrical and Communications Engineering, Feng Chia University, Taichung, Taiwan, 3Department of Automatic Control Engineering, Feng Chia University, Taichung, Taiwan, 4Department of Diagnostic Radiology, The University of Hong Kong, Hong Kong, 5Department of Radiology, Wan Fang Hospital, Taipei Medical University, Taipei, Taiwan, 6Department of Radiology, School of Medicine, College of Medicine, Taipei Medical University, Taiwan
Synopsis
Vertebral blood perfusion has been reported that there was a decrease trend in normal aging people and post-menopause women and those with arteriosclerosis, fat marrow increased and osteoporosis. Although DCE-MRI and MRS have shown potential probing bone marrow content and blood perfusion characteristics of vertebra body in previous studies, all of these were ROI analysis only and lack regional information for bone marrow content and blood perfusion. Therefore, The purposes of this study were to investigate the regional perfusion and bone marrow content in vertebra body with use of DCE-MRI and six-point Dixon IDEAL technique by pixel-by-pixel analysis.
Introductions
Vertebral body contains medulla ossium rubra (red marrow) and medulla ossium flava (yellow marrow). Both types of bone marrow contain numerous blood vessels and capillaries. The normal spine contains red marrow rich in adipocytes, and fat content increases progressively with age [1]. Using MRS. Previous studies have described that a decrease in bone perfusion is associated with a corresponding increase in vertebral marrow fat content [2-4]. Although DCE-MRI and MRS have shown potential probing the bone marrow content and blood perfusion characteristics of the vertebra body in previous studies, all of them are a ROI (whole vertebra body) analysis only and lack regional information for bone marrow content and blood perfusion. Recently, multi-point Dixon IDEAL (iterative decomposition of water and fat with echo asymmetry and least-squares estimation) techniques have widened the field of utilization, a water-only image and a fat-only image computed by pixel-by-pixel [5,6]. Perfusion parameters map can also be calculated pixel-by-pixel using pharmacokinetic model analysis for DCE-MRI data. The purposes of this study were to investigate the local perfusion and bone marrow content in vertebra body with use of DCE-MRI and six-point Dixon IDEAL technique by pixel-by-pixel analysis.Methods
In this study, a total of 31 subjects (23-86 years; 12 male, 19 female) was enrolled and they were performed in 1.5T MRI scanner (Siemens, Avanto). MRI consisted of three pulse sequences: (1) the STEAM 1H-MRS sequence without water suppression on the center of L1 and L2 vertebra (TR/TE 6000/20 msec, bandwidth 2 kHz, NEX 10, voxel size: 1.5x1.5x1.5cm3); (2) Two axial gradient-echo images (L1 and L2) for sequential acquisitions at six TEs was used for 6-pt IDEAL reconstruction with scanning parameters: TR=43 ms; TE=1.9/4.5/7.8/10.6/13.3/16.1 ms; flip angle=5⁰; FOV=300 x 290 mm2; matrix size=256 x 248; slice thickness =10 mm. (3) The gradient-echo sequence (TR/TE=40/4 ms; flip angle=40⁰; FOV=300 x 290 mm2; matrix size=256×248; slice thickness=10 mm) was applied for DCE-MRI measurement in L1 and L2. For pixel-by-pixel comparison, the imaging location was same between DCE-MRI and 6-pt IDEAL. The interval time was 2 seconds and total acquired time was 7 minutes. Bolus Gd-DTPA injection with 0.1 mmole/kg via auto-injector at a rate of 3 ml/sec was followed by a 20 ml saline flush at the same rate. The data of DCE-MRI images and DIXON images were analyzed with pixel-by-pixel by an in-house-developed software written in MATLAB (The MathWorks, Inc.). The fat ratio is given as relative fat signal intensity in percent of total signal intensity Ifat/(Ifat+Iwater)x100%. For regional analysis, the signal–time curves pixel-by-pixel, which signal enhancement over 10 % of baseline (S0), were fitted to the Toft model using nonlinear least-squares error-curve fitting. The peak enhancement map was generated by (Smax –S0 )/ S0´ 100%, where Smax was peak value in fitted signal-time curve. For global analysis, the ROI was placed on whole vertebral body, mean fat ratio and mean peak enhancement were averaged from whole ROI. A P value of less than 0.05 was considered as statistically significant.Results
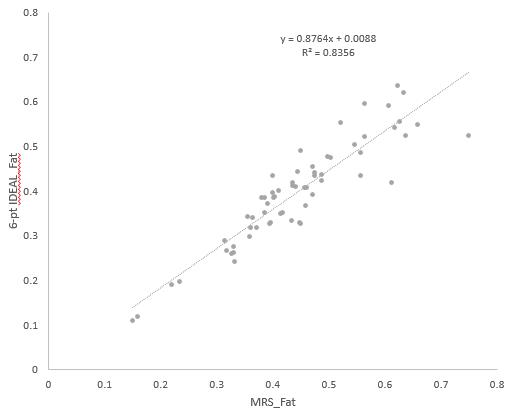
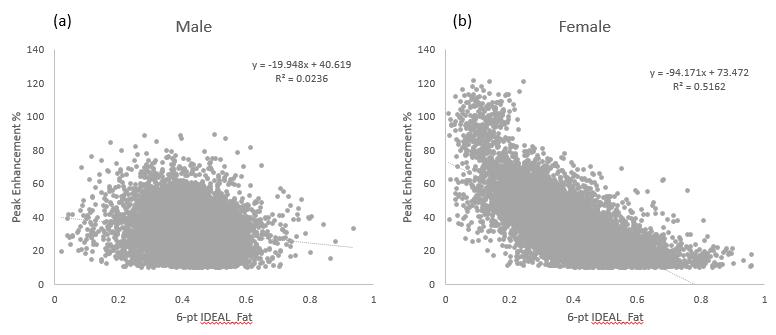
Fig. 1 illustrates the content of water and fat at 1H-MRS spectrum in vertebra. Fig. 2 shows the fat ratio, water ratio and corresponding peak enhancement map. The vertebra fat contents measured by 6-pt IDEAL were significantly correlated with that measured by MRS with a high correlation coefficient 0.91 (P < 0.001) (Fig. 3). Fig. 4 plotted the scatter diagram in a ROI of vertebral body between fat ratio and peak enhancement ratio for male and female group. The correlation coefficients were r=-0.84 (P < 0.001) in female group and r=-0.11 in male group. Fig. 5 plotted the scatter diagram in pixel-by-pixel of vertebral body between fat ratio and peak enhancement ratio for male and female group. The correlation coefficients were r=-0.72 (P < 0.001) in female group and r=-0.15 in male group.Conclusions
Our results show the fat ratio with high correlation between MRS and six-echo Dixon IDEAL in global analysis (Fig 3), suggestive the fat content from 6-pt IDEAL is reliable. Both results (global and regional) indicate that the vertebral perfusion (peck enhancement) is negative correlation with fat content in female group, but no correlation in male group. Our initial study for comparison between perfusion and fat content by pixel-by-pixel demonstrates the similar results in regional and global analysis and consequently imply the method of regional analysis is reliable. The vertebral blood perfusion and fat content depend on regional characteristics and the homogeneity in the vertebral body.Acknowledgements
The study was supported partly from the Ministry of Science and Technology, R. O. C. under the Grant No. MOST 105-2221-E-035 -049 -MY2 and MOST 103-2320-B-038 -005 -MY3. This prospective study was approved by the institution review board of Taipei Medical University-Wan Fang Hospital.References
1. D. Vanel, C. Dromain, and A. Tardivon, "MRI of bone marrow disorders," Eur Radiol, vol. 10, pp. 224-9, 2000.
2. J. F. Griffith, D. K. Yeung, G. E. Antonio, S. Y. Wong, T. C. Kwok, J. Woo, et al., "Vertebral marrow fat content and diffusion and perfusion indexes in women with varying bone density: MR evaluation," Radiology, vol. 241, pp. 831-8, Dec 2006.
3. H. T. Ma, J. F. Griffith, D. K. Yeung, and P. C. Leung, "Modified brix model analysis of bone perfusion in subjects of varying bone mineral density," J Magn Reson Imaging, vol. 31, pp. 1169-75, May 2010.
4. T. T. Shih, C. J. Chang, C. Y. Hsu, S. Y. Wei, K. C. Su, and H. W. Chung, "Correlation of bone marrow lipid water content with bone mineral density on the lumbar spine," Spine (Phila Pa 1976), vol. 29, pp. 2844-50, Dec 15 2004.
5. Hyeonjin K, et al, MRM, 59:521(2008).
6. Huanzhou Yu, et al, JMRI, 26:1153(2007).
Figures
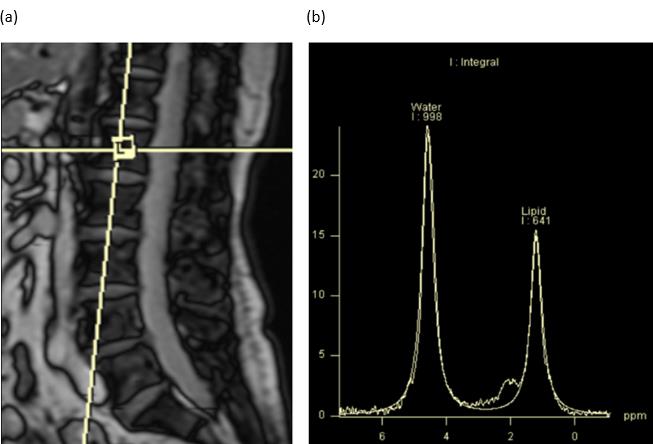
Figure 1. (a) Sagittal image of lumbar spine with marked volume of interest for spectroscopy.
(b) Spectrum from a 64.3-year-old female volunteer with relative fat intensity 39.1%.