1591
Simplified approach to quantification for hand synovitis in rheumatoid arthritis using dynamic contrast enhanced MRI: pixel-by-pixel time intensity curve shape analysis1Graduate School of Health Sciences, Hokkaido University, Sapporo, Japan, 2Faculty of Health Sciences, Hokkaido University, Sapporo, Japan, 3National Sale Division, CT Sales Department, Application Group, Toshiba Medical Systems Corporation, Tochigi, Japan, 4Internal Medicine 2, Hokkaido University Hospital, Sapporo, Japan, 5Yaesu Clinic, Tokyo, Japan
Synopsis
Quantification for synovitis using time intensity curve (TIC) shape analysis of rheumatoid arthritis has been believed to require long acquisition time up to 6-7 minutes to observe washout phase. In this study, we found that wash out phase does not contribute to accurate depiction of synovitis in the hand and simplified TIC shape analysis could significantly decrease acquisition time from about 6 minutes to 3 minutes.
Purpose
Assessment for synovitis has an important role to decide the treatment plan of rheumatoid arthritis (RA) 1-3. Manual outlining method can quantify synovitis accurately, while this method is time-consuming 4. In a previous study, pixel-by-pixel time intensity curve (TIC) shape analysis was proposed to be a useful method to quantify synovitis in RA without manually setting region of interest, where the TIC shape of synovitis is characterized by early enhancement followed by washout 5,6. However, long acquisition time up to 6-7 minutes is necessary to observe washout phase. In this study, we tried to optimize the parameters for carpal and finger joints and to decrease acquisition time required for TIC shape analysis. The purpose of study is to validate “simplified TIC shape analysis” which is considered only early enhancement phase for quantification of synovitis in patient with RA. Second purpose is to demonstrate the practical utility by applying TIC shape analysis to image acquired by two facility with different MRI systems.Materials and Methods
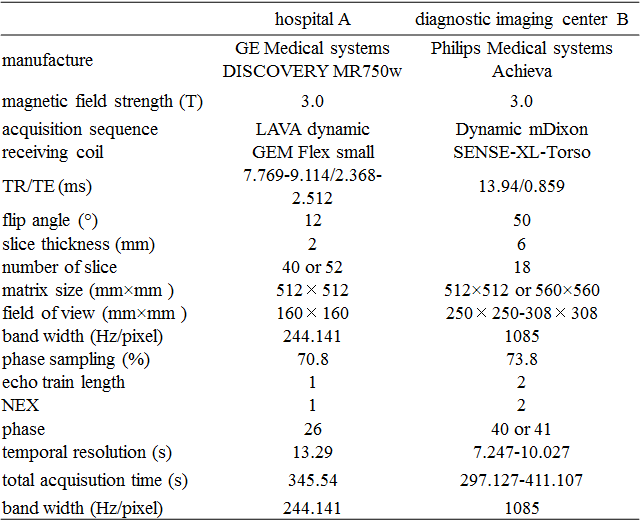
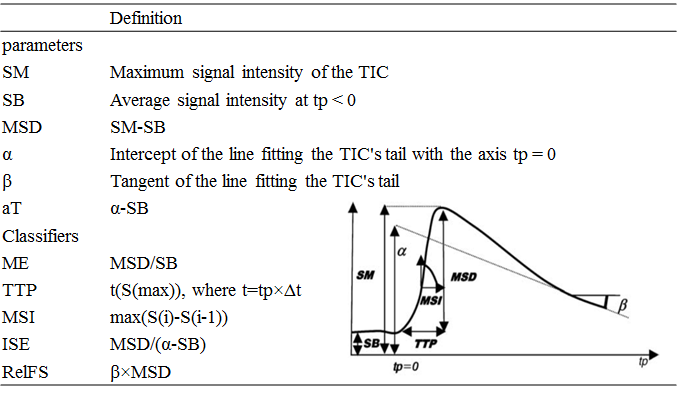
Fourteen patients (13 women and 1 man; average age, 56.3 years; range, 38-67 years) with RA were enrolled from the hospital A (7 women and 1 man; average age, 57.9 years; range, 38-67 years) and diagnostic imaging center B (6 women, average age, 54.2 years; range, 43-62 years). These patients underwent dynamic contrast enhanced magnetic resonance imaging (DCE-MRI) of the hand. Table 1 shows the acquisition parameters. TIC shape types were defined according to the parameters and classifiers (Table 2) 6. TIC shape analysis was targeted for wrist and finger joints on images acquired at hospital A. In contrast, TIC shape analysis was performed only for carpal joint owing to pixel misregistration by motion of fingers. After optimization of early enhancement and washout phase parameters to determine the TIC shape using data from Hospital A, contribution of washout phase parameters to the classification of the types was investigated for the data from Hospital A and diagnostic imaging center B. Furthermore, to prove that only early enhancement phase is essential to quantification for synovitis, TIC shape analysis was performed using only early enhancement phase (about 3 minutes). We performed 5 different TIC shape analyses (1, original TIC shape analysis from the previous study 5; 2, optimized TIC shape analysis; 3, optimized TIC shape analysis without “RelFS (relative final slope)” considering washout; phase 4, optimized TIC shape analysis without “ISE (maximum slop of increase)” considering washout; phase 5, optimized TIC shape analysis without both parameters considering washout phase) on full acquisition time (about 5-7 minutes) and short acquisition time (about 3 minutes). The validity of quantification for synovitis was evaluated using Pearson’s correlation coefficient between TIC shape analyses and the manual outlining method as a reference standard.Results
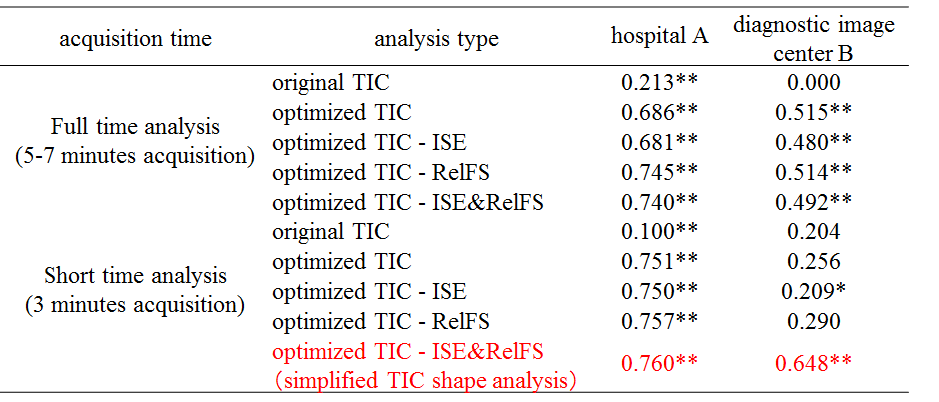
The result of statistical analysis is shown in Table 3. The parameters for TIC could be optimized (original TIC: r=0.213, optimized TIC: r=0.686). As for image acquired by hospital A, TIC shape analysis without the parameters considering washout phase belonged to the same correlation category (r=0.61-0.80; good correlation) with TIC shape analysis with those parameters. In the data from diagnostic imaging center B, simplified TIC shape analysis was superior to other analysis type.Discussion
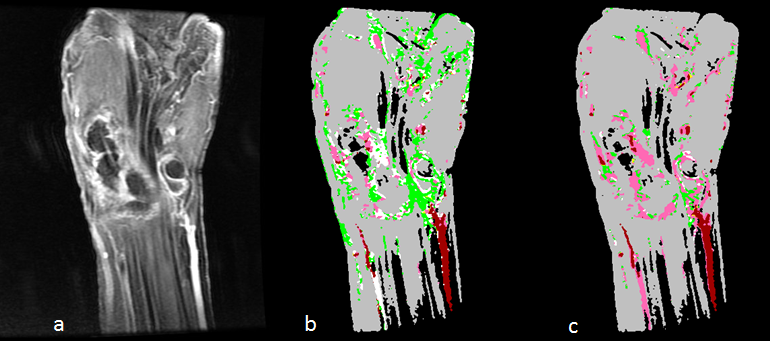
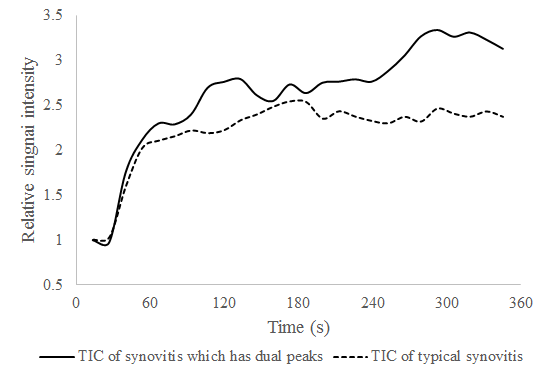
Long acquisition time (5-7 minutes) has no advantage in terms of accurate depiction of pixels representing synovitis. Simplified TIC may suffice for differentiating between synovitis and other tissues (Figure 4). In some of pixels of synovitis, TIC shape has dual peaks possibly by domination from both radial artery and ulnar artery (Figure 5). This shape type may have complicated the analyses. By using only early enhancement phase, influence from the second peak was eliminated from the analysis.Conclusion
This study suggests that simplified TIC analysis method could facilitate accurate quantification and localization of synovitis in the carpal and finger joints. Hence, dynamic image acquisition might be completed as short as 3 minutes. In addition, TIC shape analysis has a potential to be performed in multiple institutions with different MRI systems.Acknowledgements
No acknowledgement found.References
1. Resnick, D. Common disorders of synovium-lined joints: pathogenesis, imaging abnormalities, and complications. American Journal of Roentgenology 151.6 (1988): 1079-1093.
2. Firestein, G. S. Rheumatoid synovitis and pannus. Rheumatology 1 (1998): 13-1.
3. Ostergaard, M. Different approaches to synovial membrane volume determination by magnetic resonance imaging: manual versus automated segmentation. Rheumatology 36.11 (1997): 1166-1177.
4. Sakashita, Taro, et al. Accurate quantitative assessment of synovitis in rheumatoid arthritis using pixel-by-pixel, time–intensity curve shape analysis. The British journal of radiology 89.1061 (2016): 20151000.
5. van der Leij, Christiaan, et al. Rheumatoid Synovial Inflammation: Pixel-by-Pixel Dynamic Contrast-enhanced MR Imaging Time-Intensity Curve Shape Analysis—A Feasibility Study. Radiology 253.1 (2009): 234-240.
6. Lavini, Cristina, et al. Pixel-by-pixel analysis of DCE MRI curve patterns and an illustration of its application to the imaging of the musculoskeletal system. Magnetic resonance imaging 25.5 (2007): 604-612.
Figures