1586
Feasibility of Quantifying Bone Metabolism in the Femoral Neck in Human Subjects using Multi-Modality Imaging1University of Pennsylvania, Philadelphia, PA, United States
Synopsis
18F-sodium fluoride (NaF) is a readily available radiotracer that has shown great potential to study bone metabolism associated with osseous diseases such as osteoporosis. We analyzed PET/CT and MRI data to study the effects of bone volume fraction and marrow distribution on the uptake of NaF in the proximal femur. Our data showed that the mean standardized uptake (SUVmean) decreased with age and became more significant when local adjustments for bone and bone marrow were taken into account. We foresee the importance of high-resolution microstructural bone MRI for the partial volume correction of PET data for accurate quantification bone metabolism.
Purpose
NaF is a readily available radiotracer that has shown great potential to study bone metabolism associated with osseous diseases such as osteoporosis1. It has been demonstrated that NaF-PET/CT can be used to monitor bone turnover in the femoral neck. NaF functions by depositing 18F on the hydroxyapatite of newly formed bone2. While NaF uptake should occur only the remodeled regions of bone, PET imaging lacks the resolution needed to localize such regions. Consequently, the presence of bone marrow and bone tissue in the same analysis region underestimates the NaF uptake measures. The behavior of NaF in the presence of yellow bone marrow was of interest because yellow marrow contains mesenchymal stem cells which can differentiate into osteoblasts and affect bone metabolism. The goal of this study was to use MRI to quantify the bone marrow content and CT to quantify the bone volume fraction (BVF) and use these values to partial-volume correct the NaF-PET data in the femoral neck.Methods
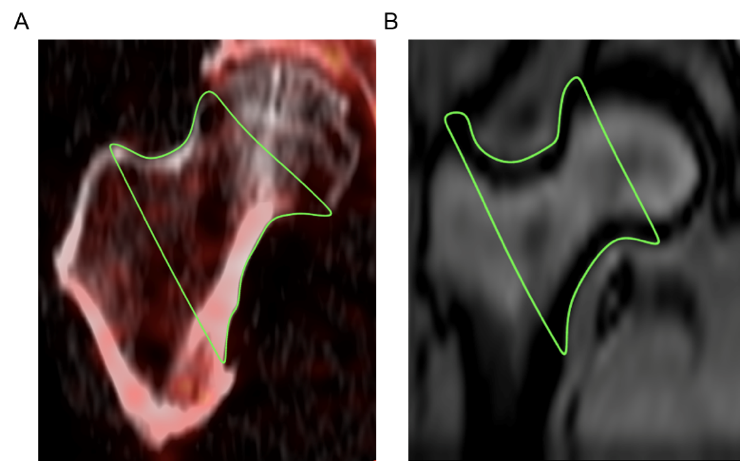
We obtained NaF-PET/CT and MRI (Siemens 3T, TSE, 0.4 x 0.4 x 3 mm3) images from 27 male patients (age 36-82 years). OsiriX software (Pixmeo, Bemex, Switzerland) was used to define a volume of interest (VOI) of the right femoral neck region using anatomical landmarks from CT scans: the epiphyseal line as the proximal boundary and the intertrochanteric ridge as the distal boundary2 (Figure 1). For each patient, SUVmean and BVF were calculated from the PET and CT VOI statistics, respectively. Two operators each completed this PET/CT segmentation independently. A semi-automatic segmentation algorithm developed in the authors’ laboratory was used to define a similar VOI on MRI images and calculate a corresponding yellow bone marrow fraction (YBMF) and red bone marrow fraction (RBMF). Each patient’s SUVmean was then divided by the corresponding BVF, YBMF, and RBMF to obtain partial volume corrected SUVmean values.Results
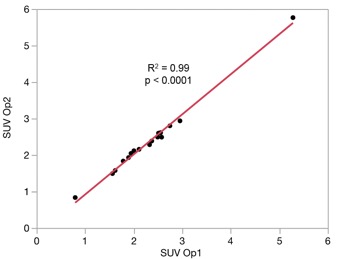
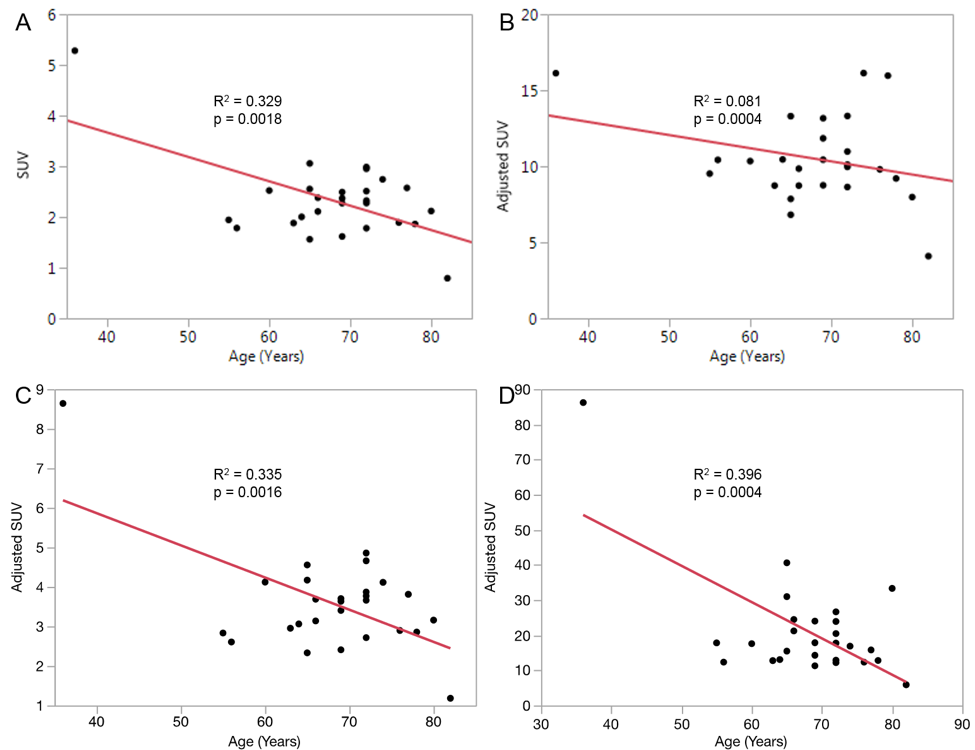
Figure 2 shows that the SUVmean data independently obtained by two operators were strongly correlated (R2 = 0.99, p < 0.0001). The data suggest that SUVmean decreases with increasing age (Figure 3a: R2 = 0.32, p = 0.0018). Partial-volume correction for BVF, YBMF and RBMF resulted in R2 = 0.08, p = 0.0004 (Figure 3b), R2 = 0.34, p = 0.0016 (Figure 3c), and R2 = 0.04, p = 0.0004 (Figure 3d), respectively. Furthermore, each individual adjustment led to an increase in SUVmean as expected.Discussion
The strong correlation between operator datasets demonstrated that the protocol to determine SUVmean is repeatable. The decrease in SUVmean with age reflected what was observed previously2. Adjusting for BVF, RBMF, and YBMF provided SUVmean data associated to various compartments within the femoral neck. Adjusting for BVF measured NaF uptake in both cortical and trabecular bone. Adjusting for RBMF and YBMF measured NaF uptake on trabecular bone surfaces that enclose red and yellow marrow, respectively. The increase in SUVmean associated with the adjustment for BVF was due to the fact that 18F is only absorbed by bone, and non-bony material was excluded. The substantial increase in SUVmean after adjusting for RBMF of the femoral neck suggested that a large amount of trabecular bone surface area is in contact with red marrow. Since the amount of red bone marrow in the human body decreases with age, this could indicate why whole-region SUVmean also decreases with age3. A subtle increase in SUVmean after YBMF adjustment was also observed. This is interesting due to the fact that yellow bone marrow contains mesenchymal stem cells that can affect bone metabolism. The amount of surface area in contact with red and yellow marrow should be taken into account for further improvement of the bone metabolism quantification based on PET data.Conclusion
Our study demonstrated the feasibility and repeatability of using NaF-PET as a means to study the metabolic rate of bone. Since available bone surface area seemed to be significantly influential on the amount of NaF uptake, surface area to volume ratio (SA:V) would be a useful measurement that can be derived from high-resolution microstructural MRI of the proximal femur recently shown feasible.3-4 In addition, these high-resolution MRI sequences can quantify YBMF and RBMF, making a comprehensive partial-volume correction of PET data feasible at the proximal femur on a PET/MRI system, eliminating the additional radiation exposure associated with CT scans.Acknowledgements
No acknowledgement found.References
1. Blake GM, Siddique M, Frost ML, Moore AE, Fogelman I. Quantitative PET Imaging Using (18)F Sodium Fluoride in the Assessment of Metabolic Bone Diseases and the Monitoring of Their Response to Therapy. PET Clin. 2012 Jul;7(3):275-91. doi: 10.1016/j.cpet.2012.04.001. Epub 2012 May 31.
2. Raynor W, Houshmand S, Gholami S, Emamzadehfard S, Rajapakse CS, Blomberg BA, Werner TJ, Høilund-Carlsen PF, Baker JF, Alavi A. Evolving Role of Molecular Imaging with (18)F-Sodium Fluoride PET as a Biomarker for Calcium Metabolism. Curr Osteoporos Rep. 2016 Aug;14(4):115-25. doi: 10.1007/s11914-016-0312-5.
3. Han M, Chiba K, Banerjee S, Carballido-Gamio J, Krug R. Variable flip angle three-dimensional fast spin-echo sequence combined with outer volume suppression for imaging trabecular bone structure of the proximal femur. J Magn Reson Imaging. 2015 May;41(5):1300-10.
4. Chang G, Honig S, Brown R, Deniz CM, Egol KA, Babb JS, Regatte RR, Rajapakse CS. Finite element analysis applied to 3-T MR imaging of proximal femur microarchitecture: lower bone strength in patients with fragility fractures compared with control subjects. Radiology. 2014 Aug;272(2):464-74.
Figures