1585
Simultaneous measurement of muscle transverse relaxation rates of R2, R2' and R2*: application in unilateral femoral artery embolization1Academy for Advanced Interdisciplinary Studies, Peking University, Beijing, People's Republic of China, 2College of Engineering, Peking University, Beijing, People's Republic of China, 3interventional radiology and vascular surgery, Peking University First Hospital, Beijing, People's Republic of China, 4Department of Radiology, Peking University First Hospital, Beijing, People's Republic of China
Synopsis
Diagnosis of the ischemic lesion is challenging and often requires the use of pharmaco-mechanical methods. This study demonstrates the feasibility of using a susceptibility-based MRI technique with the multi-echo gradient and spin echo (MEGSE) sequence to assess the skeletal muscle oxygenation alternations in animal model of unilateral femoral artery embolization. The results shown that the skeletal muscle R2 decreases obviously from after femoral artery embolization, while R2’ increases correspondingly. MEGSE seems to be an appropriate method for the evaluation of skeletal muscle ischemia after embolization.
Introduction
Acute lower extremity ischemia secondary to thromboembolism is a common problem treated by vascular surgeons1,2. Diagnosis of the ischemic lesion is challenging and often requires the use of pharmaco-mechanical methods. MRI based R2 and R2* measurements, which can provide information of tissue ischemia and edema, seem to be a promising method to evaluate injure caused by distal embolization.Purpose
To demonstrate the feasibility of using a susceptibility-based MRI technique with the multi-echo gradient and spin echo (MEGSE) sequence to assess the skeletal muscle oxygenation alternations in animal model of unilateral femoral artery embolization.Materials and Methods
Animal preparation
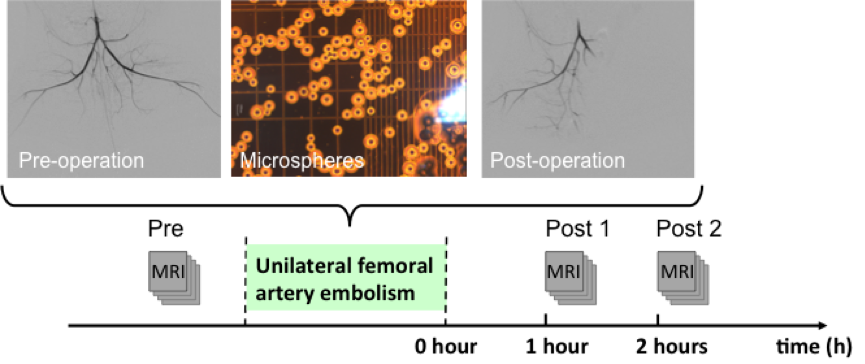
Approved by the local institutional review board for experimental animal studies, 20 New Zealand White rabbits were included in this study. The 20 rabbits were randomized into embolism (n = 10) and control (n = 10) groups. Femoral artery embolization was induced by injection of a 50000-microsphere dose into the femoral artery under the guidance of digital subtraction angiography (DSA). Diagram of the imaging scheme is shown in Fig. 1. After the surgery, rabbits were transferred to the MR table for muscle imaging. The three status were defined as follows: Pre, before surgery; Post 1: 1 hour after the surgery; Post 2: 2 hours after the surgery.
MRI Methods
All examinations were performed on a 3.0-T whole-body MRI system (Signa ExciteTM; GE Medical Systems, Milwaukee, WI, USA). MEGSE sequence was applied to acquire source images. In total, 32 echoes with an echo spacing of 3.75 ms were implemented. The spin echo occurred at the 7th echo. The detailed imaging parameters were as follows: TR = 1500 ms, TE = 56 ms, readout bandwidth = 62.5 kHz, acquired matrix = 128 × 128, FOV = 150 × 150 mm2, slice thickness = 6 mm, and number of signals averaged (NSA) = 1. Axial T2-weighted images were also acquired using a fast spin-echo sequence with scanning parameters of FOV = 150 × 150 mm2, TR = 3000 ms, TE = 80 ms, slice thickness = 6 mm, acquired matrix = 256 × 256, and NSA = 1.
Data Analysis
Data analysis was performed by using self-developed Matlab (MathWorks Inc., Natick, MA, USA) routines. Before analysis, all the MEGSE images were filtered using a Gaussian low-pass filter (kernel size = 3 × 3) to improve the signal-to-noise ratio (SNR). Nonlinear least-square fitting algorithm was used to fit R2, R2’ and R2* on a pixel-by-pixel basis. Data were reported as mean ± standard deviation. Regions of interest (ROIs) were placed manually on the muscles. A paired, two-sided Student t-test was applied to assess statistical differences between the different statuses.
Results
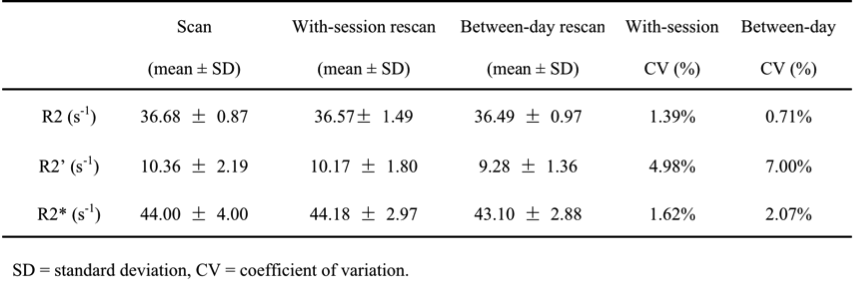
The baseline reproducibility results of R2, R2’ and R2* measurements are summarized in Table 1.
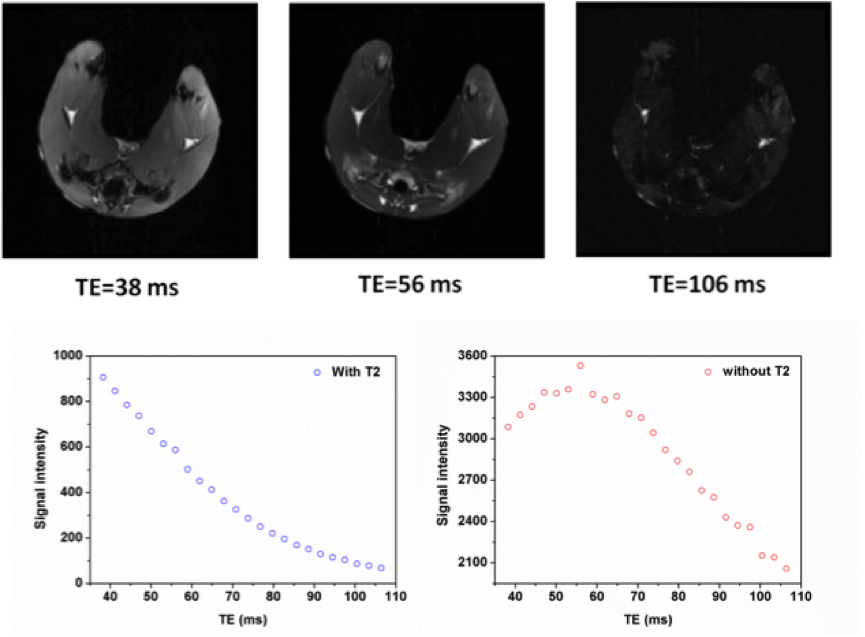
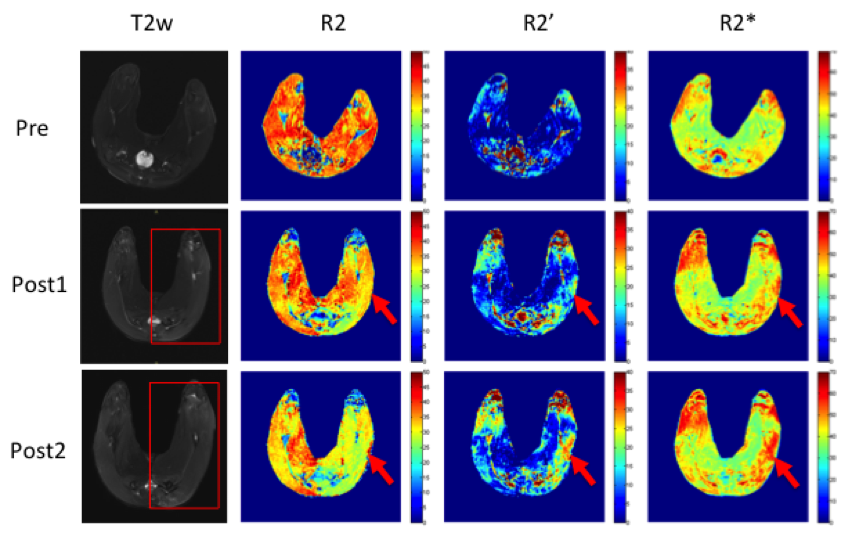
Representative MEGSE images with typical TEs of 38 ms, 56 ms and 106 ms are shown in Fig 2. The measured signal and the signal after removing R2 effects are plotted as a function of TE (Fig 2). Fig. 3 demonstrates a representative case about the performances in T2w image, R2, R2’ and R2* maps after unilateral femoral artery embolization. It is shown that the R2 decreases obviously from pre to post1, and from post1 to post2, while R2’ increases correspondingly. Signal changes in the T2w images and R2* maps are less significant in this case.
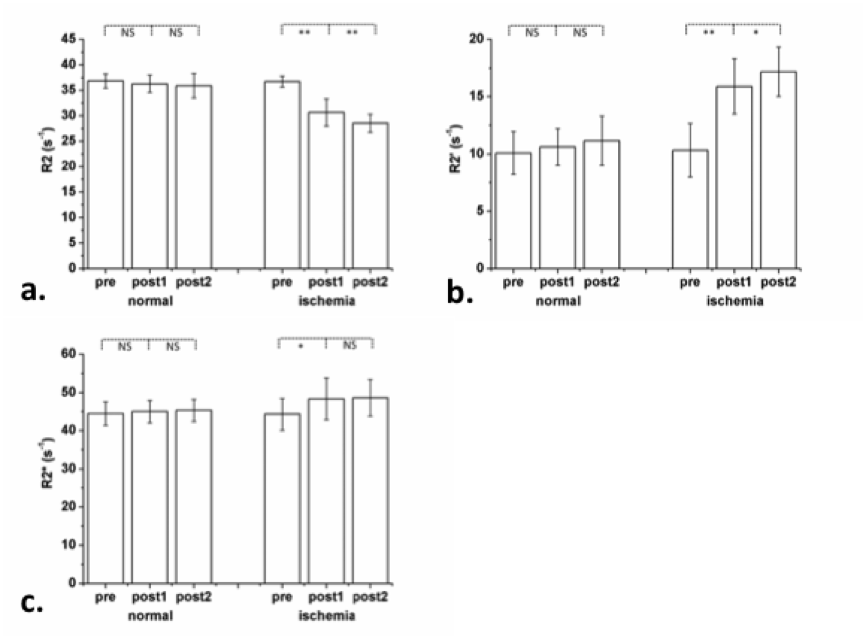
Average values of R2, R2’ and R2* of both lower limb muscles of all ten rabbits are shown in Fig 4. The average R2 decreases significantly from 36.74 ± 1.09 s-1 (pre) to 30.64 ± 2.65 s-1 (post1, P < 0.01) and to 28.53 ± 1.76 s-1 (post2, P < 0.01), while the average R2’ rises markedly from 10.33 ± 2.34 s-1 (pre) to 15.90 ± 2.42 s-1 (post1, P < 0.01) and to 17.18 ± 2.15 s-1 (post2, P < 0.05). The average R2* increases from 44.29 ± 4.20 s-1 (pre) to 48.33 ± 5.48 s-1 (post1, P < 0.05) and to 48.61 ± 4.80 s-1 (post2, NS, P > 0.05).
Conclusion
In clinical routine, it is desirable to acquire R2* and R2 maps within a single scan to provide complementary information. This study demonstrates the feasibility of using the MEGSE sequence to achieve simultaneous R2, R2’ and R2* measurement. MEGSE seems to be an appropriate method for the evaluation of skeletal muscle ischemia after embolization.Acknowledgements
No acknowledgement found.References
1. Eliason J L, et al. Annals of surgery, 2003, 238(3): 382-390.
2. Kempe K, et al. Journal of vascular surgery, 2014, 60(3): 702-707.
Figures